

Key Highlights
- Bitcoin started a steady increase above $70,000 and $73,500.
- A bullish trend line is forming with support at $72,650 on the 4-hour chart of BTC/USD.
- Ethereum also climbed over 10% and surpassed $2,350.
- Gold is grinding higher toward the $4,950 resistance.
Bitcoin Price Technical Analysis
Bitcoin price remained supported above $68,000 against the US Dollar. BTC formed a base and started a recovery wave above $70,000.
Looking at the 4-hour chart, the price settled above $71,200, the 100 simple moving average (red, 4-hour), and the 200 simple moving average (green, 4-hour). The bulls even pumped the price above $75,000.
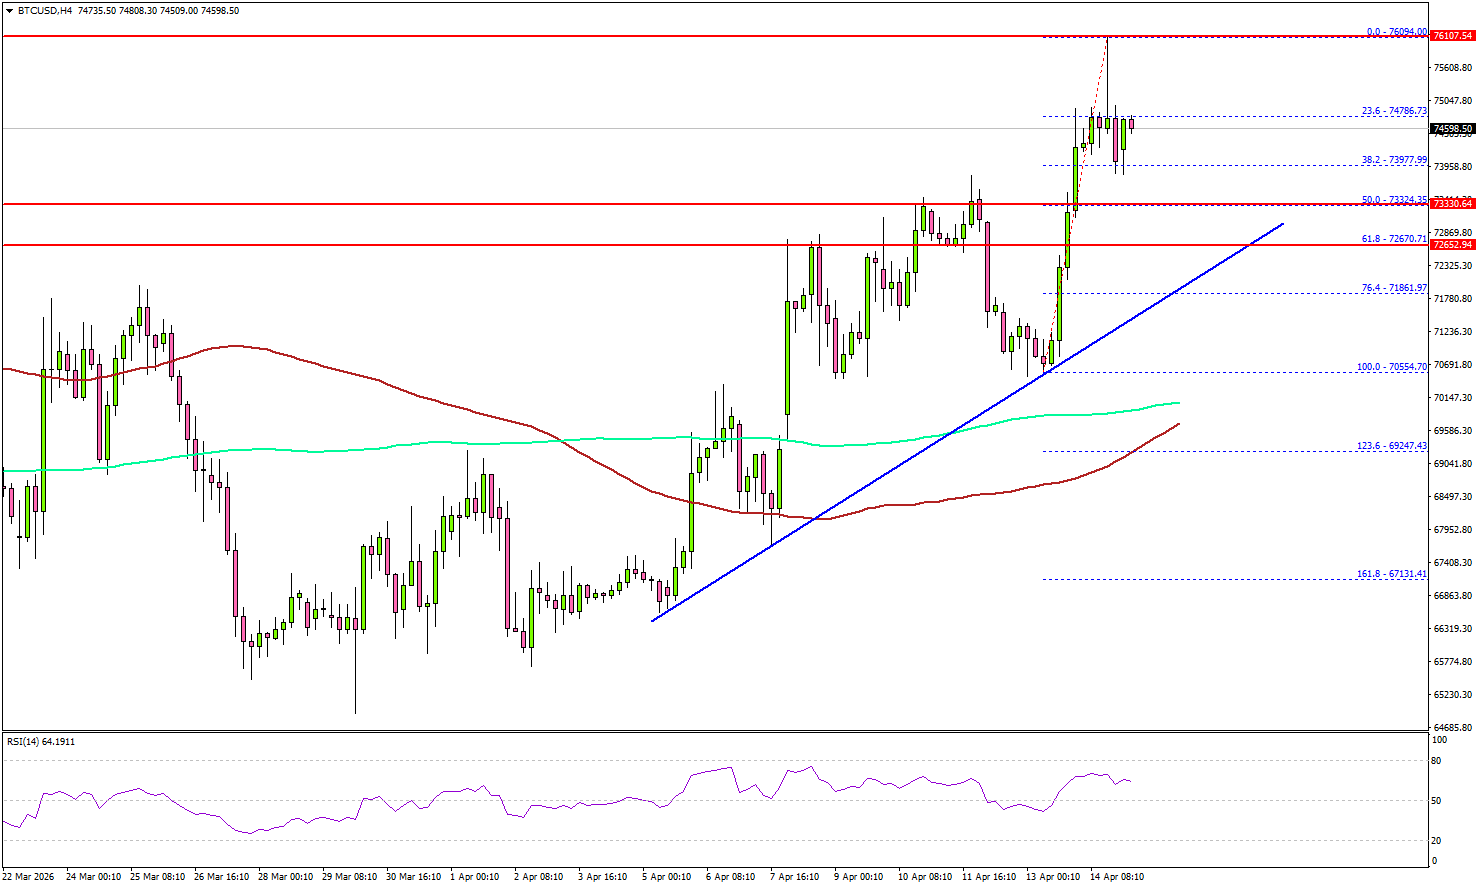
A high was formed at $76,094, and the price started a consolidation. Immediate support sits at $74,000 and the 38.2% Fib retracement level of the upward move from the $70,554 swing low to the $76,094 high.
The first key support could be $73,350. The main breakdown support could be near $72,500. There is also a bullish trend line forming with support at $72,650 and the 76.4% Fib retracement level of the upward move from the $70,554 swing low to the $76,094 high.
A downside break below $70,650 might start another decline. The next major support is $71,200, below which BTC could decline toward $70,000.
On the upside, the price now faces resistance near $76,000. The first key hurdle is $76,500. A close above $76,500 could send the price toward $78,000. Any more gains might call for a test of $80,000.
Looking at Ethereum, the price also gained bullish momentum above $2,300, and the bulls could now aim for a move toward $2,500.
Today’s Key Economic Releases
- US Import Price Index for March 2026 (MoM) – Forecast +2.0%, versus +1.3% previous.
- NY Empire State Manufacturing Index for April 2026 – Forecast -0.5, versus -0.2 previous.


Leave a comment