
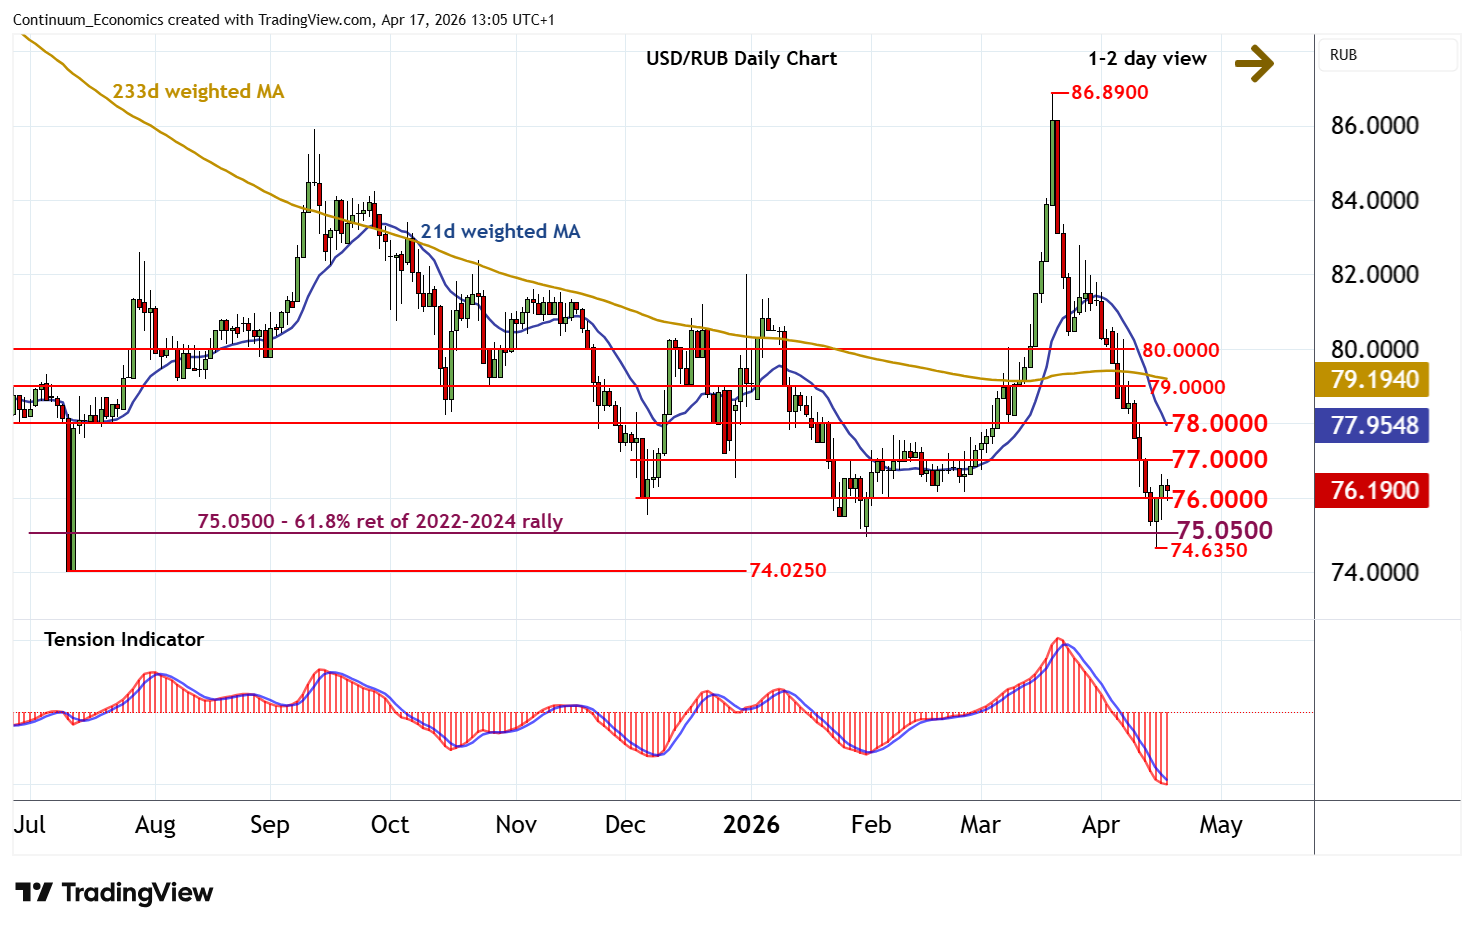
The anticipated continuation of mid-March losses has posted a fresh 2026 year low at 74.6350

| Levels | Comment | Levels | Comment | |||||
| R4 | 80.0000 | * | break level | S1 | 76.0000 | * | congestion | |
| R3 | 79.0000 | ** | congestion | S2 | 75.0500 | ** | 76.4% ret of 2022-2024 rally | |
| R2 | 78.0000 | * | congestion | S3 | 74.6350 | ** | 15 Apr YTD low | |
| R1 | 77.0000 | ** | congestion | S4 | 74.0250 | ** | 10 Jul 2025 (y) low |
Asterisk denotes strength of level
12:30 BST – The anticipated continuation of mid-March losses has posted a fresh 2026 year low at 74.6350, before bouncing sharply back above congestion support at 76.0000. Oversold daily stochastics are unwinding, suggesting room for a test of congestion resistance at 77.0000. But the bearish daily Tension Indicator and negative weekly charts should limit any further break in renewed selling interest beneath further congestion around 78.0000. Meanwhile, support is at 76.0000. But a close below the 75.0500 multi-month Fibonacci retracement will add weight to sentiment and extend November 2024 losses below the 74.0250 year low of 10 July 2025.


Leave a comment