
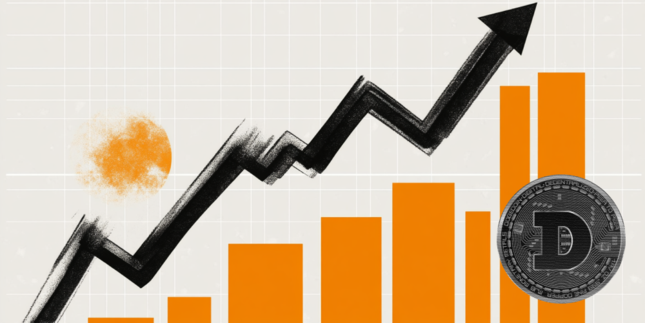
Dogecoin (DOGE) is grinding up above $0.0976, gaining along with the broader cryptocurrency market at the time of writing on Wednesday. The leading meme coin is showing a neutral-to-bullish outlook, building on robust support levels and growing investor conviction in risk assets after President Donald Trump extended the United States (US)-Iran ceasefire on Tuesday.
Although neither the US nor Iran has confirmed the second round of peace negotiations, sentiment across the crypto market remains relatively elevated.
The crypto Fear & Greed Index holds at 32 on Wednesday, in the fear territory, up from 23 last week and 8 in March, in the extreme fear territory. If market sentiment continues to improve, it could steady risk appetite, raising the odds of an extended recovery.

Retail demand cools as Dogecoin gains
Interest in Dogecoin derivatives remains relatively subdued, as futures Open Interest (OI) steadies at $1.22 billion on Wednesday. Retail investors appear cautiously optimistic, given that OI remains low but stable as the price approaches the $0.10 pivotal level.
It is worth monitoring the reaction to Dogecoin’s potential break above $0.10, which could signal a bullish turnaround, sustaining gains and strengthening the derivatives market.

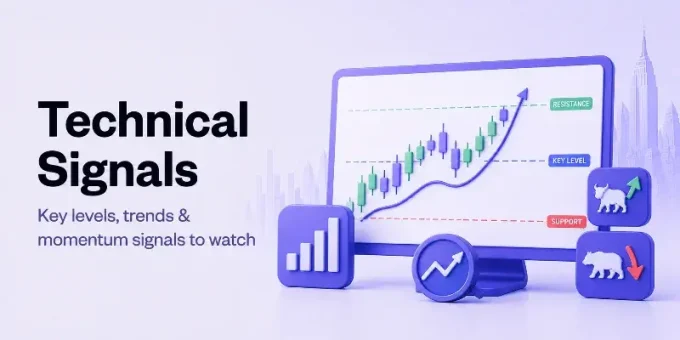
Technical outlook: Dogecoin showcases recovery potential
Dogecoin trades at $0.098, holding above the 50-day Exponential Moving Average (EMA) at $0.095. The meme coin position hints at a mildly constructive bias, yet it remains capped beneath the descending trendline barrier projected around $0.101 and the higher 100-day and 200-day EMAs at $0.105 and $0.128, respectively.
Momentum is moderately positive, with the Relative Strength Index (RSI) hovering at 57 on the daily chart. The Moving Average Convergence Divergence (MACD) upholds a slightly positive histogram on the same chart, suggesting lingering upside pressure but not a clean bullish breakout.

On the topside, initial resistance emerges at the descending trend line near $0.101, followed by the 100-day EMA at $0.105 and then the 200-day EMA at $0.128. A daily close above the cluster of moving averages would be needed to unlock a more decisive bullish phase. On the downside, the immediate support is the 50-day EMA at $0.0958. A break below that zone could expose the deeper structural floor associated with the ascending trendline (dotted) near $0.090.
(The technical analysis of this story was written with the help of an AI tool.)


Leave a comment