
The Monetary System No One Fully Explains: How the Dollar Actually Works
Most financial commentary treats the dollar’s value as a given. Economists debate interest rates, inflation targets, and fiscal deficits, yet rarely address the more fundamental question sitting beneath all of it: what gives the world’s most widely held currency its value in the first place? Understanding what backs the US dollar is not merely an academic exercise. It is the foundational question for anyone holding savings, planning for retirement, or managing long-term wealth in a dollar-denominated environment.
The answer has changed dramatically over the past century, and the implications of that change continue to compound. Furthermore, the mechanisms that once provided a hard constraint on money supply no longer exist in their original form, which carries profound consequences for long-term savers and investors alike.
When big ASX news breaks, our subscribers know first
From Commodity to Decree: How Dollar Foundations Shifted Over Time
Bimetallism, Gold Convertibility, and the Bretton Woods Era
For most of American monetary history, the dollar maintained a direct, legally enforceable link to physical metal. Under earlier bimetallic arrangements, paper dollars could be exchanged for fixed quantities of gold or silver at any chartered bank. This convertibility was not symbolic — it was a hard constraint on how many dollars could exist at any given time.
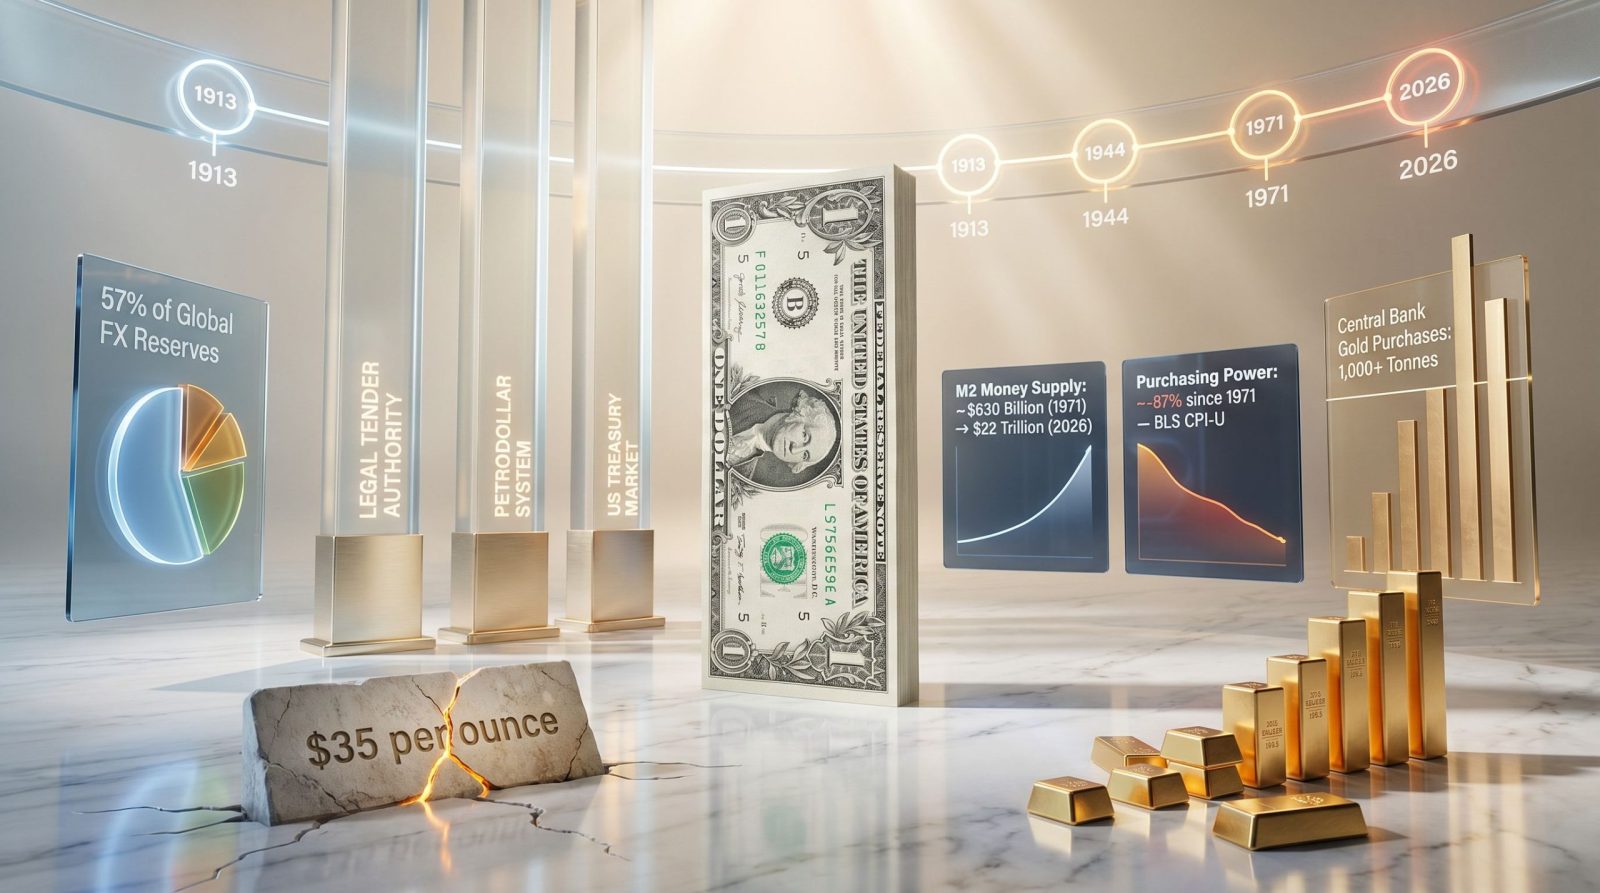
The Bretton Woods Conference of 1944 formalised a new version of this logic at the international level. Representatives from 44 nations gathered in New Hampshire to establish a post-war monetary architecture anchored to a single commitment: the US would exchange dollars for gold at a fixed rate of $35 per troy ounce, and all other participating currencies would peg their values to the dollar. The arrangement made the dollar the world’s de facto reserve currency by design, not by accident.
The system functioned as long as US gold reserves remained adequate relative to outstanding dollar obligations. However, that condition eroded through the 1960s as simultaneous expenditure on military operations abroad and large-scale domestic programmes expanded the government’s fiscal footprint well beyond what its gold stock could comfortably support.
The 1971 Inflection and Its Compounding Consequences
On August 15, 1971, the convertibility mechanism was suspended. Foreign governments could no longer exchange their dollar holdings for physical gold at the US Treasury. The decision was characterised at the time as a temporary measure. More than five decades later, the gold window remains closed. The end of the gold standard represented one of the most consequential shifts in modern monetary history.
The immediate consequences included significant currency volatility, commodity price disruptions, and the beginning of an entirely new monetary regime. The deeper consequence, however, was structural: by severing the link between dollars and a physically constrained asset, the system removed the hard ceiling that had previously governed money supply expansion.
| Era | Backing Mechanism | Supply Constraint |
|---|---|---|
| Classical Gold Standard (pre-1934) | Fixed gold convertibility | Physical gold stock |
| Bretton Woods (1944–1971) | Dollar-gold peg at $35/oz | US gold reserve adequacy |
| Post-1971 Fiat System | Government decree and institutional trust | None — policy-determined |
What Backs the US Dollar Today: Three Demand-Side Pillars
Pillar One: Legal Authority, Tax Obligations, and Federal Reserve Architecture
The dollar’s most immediate foundation is the legal and institutional framework of the US government itself. Federal law designates dollars as legal tender for all debts, public and private. More importantly, the government’s power to levy taxes creates a structural and recurring demand for dollars that no alternative currency can replicate domestically. Every business and individual with US tax obligations must ultimately acquire dollars to meet them.
At the central bank level, Federal Reserve notes in circulation are backed primarily by US Treasury securities held on the Fed’s balance sheet. This means that the paper dollar in circulation is, in a technical sense, a liability of the Federal Reserve collateralised by government debt. The phrase full faith and credit represents not just a motto but the combined institutional, judicial, and fiscal machinery of the world’s largest economy.
Pillar Two: The Petrodollar System and Global Trade Denomination
Following agreements reached with Saudi Arabia and other major oil producers in 1974, crude oil became priced and settled in US dollars. The structural consequence was significant: any nation that imports oil, which is nearly every nation, must hold or acquire dollars to do so. This embedded dollar demand within the architecture of global energy markets in a way that proved self-reinforcing for decades.
Beyond oil, the dollar retains pricing dominance across a wide range of globally traded commodities including metals, agricultural products, and international freight contracts. BRICS-aligned nations have pursued bilateral trade arrangements denominated in non-dollar currencies, and measurable progress has been made. However, the scale of existing dollar-denominated infrastructure means any transition is measured in decades rather than years.
Pillar Three: US Treasury Debt as the World’s Primary Reserve Asset
The third pillar is the global sovereign bond market. Foreign central banks and governments hold trillions of dollars in US Treasury securities as their primary reserve instrument. This creates a self-reinforcing cycle: nations accumulate dollars through trade, deploy those dollars into Treasuries, which supports dollar demand, which enables further accumulation.
The critical observation is that no alternative sovereign debt market currently offers comparable depth, transparency, or settlement infrastructure. That structural advantage has sustained Treasury demand even as fiscal conditions in the US have deteriorated. Furthermore, understanding the broader role of gold in the monetary system helps contextualise why institutions increasingly view alternatives to dollar-denominated assets as necessary hedges.
Key Analytical Point: All three pillars that replaced gold as the dollar’s foundation are demand-side mechanisms. They create reasons to hold dollars, but none of them limits how many dollars can be created. This asymmetry is the defining characteristic of the post-1971 monetary system and the origin of its long-term purchasing power challenge.
What Has Happened to Purchasing Power Since the Gold Standard Ended
The Mathematics of Unconstrained Money Creation
When a physical commodity governs the money supply, expansion is limited by the rate at which that commodity can be extracted or acquired. Gold’s annual mine supply grows at approximately 1 to 2 percent per year [World Gold Council, Supply Data 2025], a rate that cannot be altered by government decree regardless of fiscal need. Remove that constraint, and money supply becomes a policy variable rather than a physical one.
The data on what followed 1971 is unambiguous. US M2 money supply expanded from approximately $630 billion in 1971 to over $22 trillion by 2026 [Federal Reserve H.6 Money Stock Measures, March 2026], representing a 35-fold increase over five decades. The Bureau of Labor Statistics’ Consumer Price Index documents the corresponding consequence: cumulative purchasing power erosion of approximately 87 percent since 1971 [BLS CPI-U, 2026].
That erosion is not abstract. It is visible in the price of ordinary goods and assets:
| Asset or Good | 1971 Price | 2026 Price | Implied Dollar Erosion |
|---|---|---|---|
| Regular gasoline (per gallon) | ~$0.36 | ~$3.50+ | ~90% in dollar terms |
| Median new home | ~$24,000 | ~$400,000+ | ~94% in dollar terms |
| $100 consumer goods basket | $100 | ~$800 | ~87.5% |
Sources: US Census Bureau, New Residential Sales; BLS CPI-U 2026
Those price increases do not reflect goods becoming more expensive in any absolute sense. They reflect a currency that has shrunk relative to the productive economy it is supposed to measure.
Fiscal Dominance: The Structural Mechanism Behind Continued Erosion
Economists use the term fiscal dominance to describe a specific macroeconomic condition: one where the accumulated debt burden of a sovereign government becomes so large that monetary policy must serve debt management objectives rather than independently target inflation. In this environment, the central bank cannot meaningfully reduce the money supply without triggering a debt servicing crisis.
Fiscal Dominance Defined: Fiscal dominance occurs when a government’s debt obligations are large enough that the central bank must prioritise debt serviceability over inflation control. In this condition, sustained money supply contraction becomes structurally incompatible with existing fiscal commitments, creating a persistent headwind for the currency’s purchasing power over time.
The current US fiscal position illustrates the mechanism clearly. As of May 2026, total gross national debt stands at approximately $36 to $39 trillion [US Treasury, Debt to the Penny; Joint Economic Committee Monthly Debt Update, May 2026]. Annual net interest payments are projected to exceed $1 trillion in fiscal year 2026 [Congressional Budget Office, Budget and Economic Outlook 2026], surpassing both defence spending and Medicare individually.
Even with Kevin Warsh sworn in as Federal Reserve Chair on May 22, 2026 [CBS News, May 22, 2026], the arithmetic of existing obligations does not change based on who holds the chair. The debt already exists. The payments are already scheduled. The structural requirement to maintain sufficient money supply to service those obligations constrains the policy space available to any central banker, regardless of their stated preferences on inflation.
Is the Dollar Losing Its Reserve Currency Status?
The IMF Data and What It Actually Shows
The US dollar’s share of global foreign exchange reserves, as reported by the IMF’s Currency Composition of Official Foreign Exchange Reserves (COFER) database, declined from approximately 72 percent in 2001 to approximately 57 percent in Q3 2025 [IMF COFER, Q3 2025]. That is a decline of 15 percentage points across 25 years.
The pace matters as much as the direction. This is a slow structural drift, not an acute crisis. No alternative reserve currency has emerged to absorb the full reallocation. Instead, the shift has been distributed across a range of assets and currencies, with one category standing out clearly.
Central Bank Gold Accumulation as an Institutional Signal
Annual net central bank gold buying exceeded 1,000 tonnes in each of 2022, 2023, and 2024 [World Gold Council, Central Bank Gold Reserves Survey]. In Q1 2026 alone, net purchases reached 244 tonnes [World Gold Council, Gold Demand Trends Q1 2026]. For context, the five-year average preceding 2022 was approximately 473 tonnes per year, meaning the recent three-year pace nearly doubled the prior baseline.
The catalyst for this acceleration is widely understood within reserve management circles. In 2022, the US and its allied governments froze approximately $300 billion in Russian central bank reserves held within Western financial institutions [US Congressional Research Service, IF12062]. The action demonstrated to reserve managers globally that dollar-denominated sovereign assets held within Western settlement infrastructure carry a dimension of geopolitical counterparty risk that had not previously been priced into reserve allocation decisions.
Central banks in Asia, the Middle East, and across the Global South responded by accelerating allocations toward assets outside the reach of Western financial infrastructure. Gold held in sovereign vaults represents exactly that kind of asset. In addition, central bank gold reserves have become an increasingly scrutinised indicator of institutional confidence in the long-term trajectory of fiat currencies.
Comparing the Available Alternatives
| Reserve Asset | Key Advantage | Key Limitation |
|---|---|---|
| US Dollar (~57% share) | Unmatched liquidity and market depth | Fiscal dominance and geopolitical freeze risk |
| Euro (~20% share) | Large economy, independent central bank | Fragmented sovereign debt market across member states |
| Chinese Renminbi (~3% share) | Growing bilateral trade use | Capital controls restrict free convertibility |
| Gold (~15% of CB reserves) | No counterparty risk, geologically supply-constrained | No yield, requires physical custody arrangements |
| IMF Special Drawing Rights | Multilateral institutional legitimacy | Not freely tradeable; limited practical utility |
Sources: IMF COFER Q3 2025; World Gold Council 2026
Why Gold and Silver Occupy a Structurally Different Position
Geology as a Monetary Property
The distinction between gold and a fiat currency is not primarily about history or sentiment. It is about supply mechanics. Gold’s annual mine output grows at roughly 1 to 2 percent per year [World Gold Council, Supply Data 2025]. That rate is determined by geology, ore grade distributions, metallurgical processing constraints, and the economics of exploration, not by legislative authority or central bank preference. No government can authorise additional gold into existence.
This supply characteristic is what has allowed gold to function as a purchasing power reference point across multi-decade and multi-century timeframes, through monetary regime changes, wars, technological revolutions, and the rise and fall of empires. Silver shares this geological scarcity property while also carrying a growing industrial demand dimension, with significant and expanding applications in solar photovoltaics, electronics, and emerging battery technologies.
What Three Years of Institutional Buying Actually Signals
Central banks are not sentimental buyers. They are the world’s most systematically resourced reserve managers, operating with full access to macroeconomic modelling, policy intelligence, and long-duration liability frameworks. When these institutions sustain three consecutive years of purchases well above their own historical baseline, the signal is worth examining carefully.
The signal is not that the dollar will collapse. Currency systems rarely collapse on short timescales. The signal is more precise: that the institutions most responsible for managing long-term monetary risk have concluded that the structural dynamics governing fiat reserve assets, specifically the absence of any hard supply constraint on money creation, justify a systematic increase in allocations toward assets that carry no such vulnerability.
Perspective: Sustained central bank gold accumulation does not represent a bet on monetary catastrophe. It represents a measured hedge against the compounding purchasing power dynamics that have characterised fiat currency systems since the gold standard was abandoned, implemented by institutions whose entire mandate depends on getting long-term reserve allocation right.
The next major ASX story will hit our subscribers first
Frequently Asked Questions About What Backs the US Dollar
Is the US Dollar Still Backed by Gold?
No. Dollar-to-gold convertibility ended on August 15, 1971, with the suspension of the Bretton Woods system. The US dollar has operated as a fiat currency for over five decades. Its value is derived from legal tender status, institutional credibility, and structural global demand rather than any redeemable physical commodity. For a detailed overview of what backs the US dollar in practical terms today, the mechanics extend well beyond a simple single-sentence answer.
What Replaced Gold as the Foundation of Dollar Value?
Three demand-side mechanisms now underpin dollar utility: the government’s legal and taxing authority, which creates mandatory domestic demand; the petrodollar energy pricing architecture, which embeds dollar demand in global commodity markets; and the US Treasury market, which functions as the primary instrument for sovereign reserve accumulation worldwide. None of these mechanisms constrains the volume of dollars that can be created.
Why Has the Dollar Lost So Much Purchasing Power Since 1971?
The gold standard imposed a physical ceiling on money supply growth. Once removed, M2 expanded from approximately $630 billion in 1971 to over $22 trillion by 2026 [Federal Reserve H.6, March 2026], a 35-fold increase. BLS CPI-U data places cumulative purchasing power erosion at approximately 87 percent over this period [BLS CPI-U, 2026].
What Is Fiscal Dominance and Why Does It Matter?
Fiscal dominance describes the condition where a government’s accumulated debt is large enough that monetary policy must accommodate fiscal needs rather than independently targeting inflation. With US national debt approaching $39 trillion and annual interest payments projected to exceed $1 trillion in fiscal year 2026 [Congressional Budget Office, Budget and Economic Outlook 2026], the structural requirement to maintain sufficient money supply to service existing obligations limits the Fed’s practical ability to implement sustained tightening regardless of its stated policy objectives.
Are Central Banks Moving Away From the Dollar?
Gradually. The dollar’s share of global reserves has declined approximately 15 percentage points since 2001 [IMF COFER]. The more analytically significant development is the destination of that reallocation, primarily into gold, which carries no counterparty risk and cannot be frozen by foreign governments. The 2022 Russian reserve freeze materially accelerated this institutional reassessment.
Does the Dollar Need to Fail for This to Affect Long-Term Savers?
No. Purchasing power erosion does not require a currency crisis. It occurs gradually through the compounding effect of money supply expansion relative to productive output. An 87 percent decline in purchasing power since 1971 [BLS CPI-U] occurred entirely without a formal dollar collapse. The relevant question for long-term savers is not whether the dollar will experience a catastrophic failure, but whether dollar-denominated savings will preserve real purchasing power over multi-decade timeframes — a question the data answers clearly. Consequently, many investors explore options such as physical gold vs ETFs as part of a broader strategy to hedge against ongoing purchasing power erosion.
Disclaimer: This article is intended for informational and educational purposes only. It does not constitute investment advice or a recommendation to buy or sell any asset. Readers should consult a qualified financial adviser before making investment decisions. Past performance of any asset class does not guarantee future results.
Want to Position Yourself Ahead of the Next Major Mineral Discovery?
Discovery Alert’s proprietary Discovery IQ model delivers real-time alerts on significant ASX mineral discoveries, transforming complex mineral data into clear, actionable insights for investors at every level — explore the historic returns major discoveries have generated and begin your 14-day free trial today to secure a genuine market-leading edge.













Leave a comment