

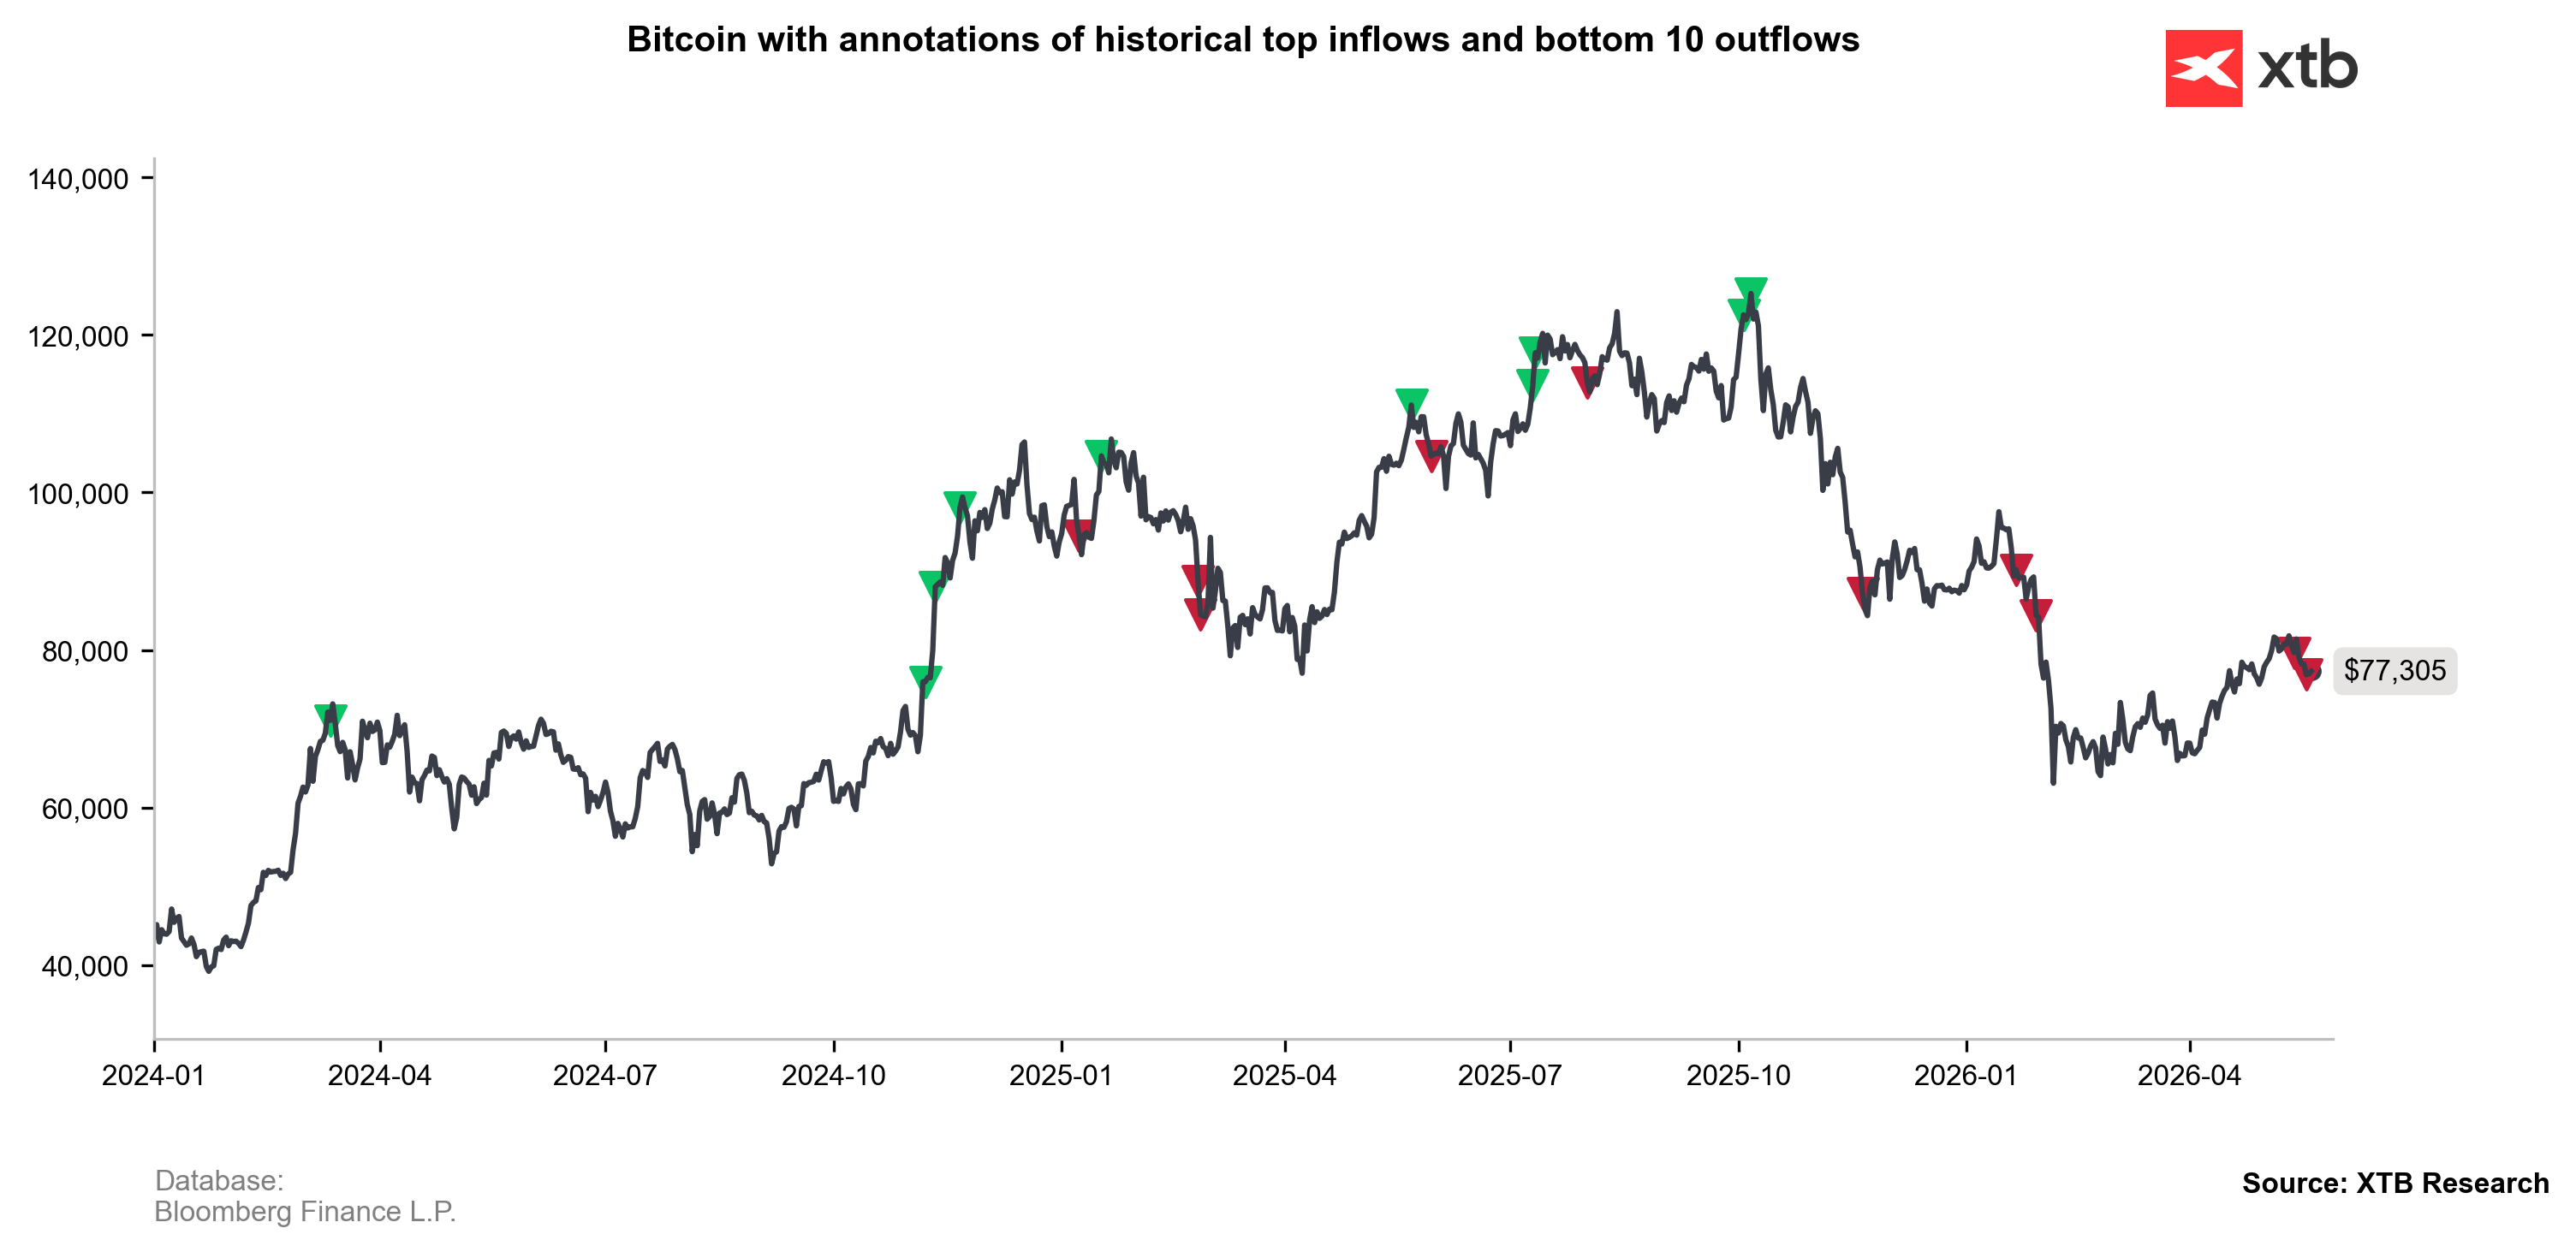
Bitcoin failed to hold above the USD 80,000 level, raising legitimate concerns among investors about whether the cryptocurrency bear market could enter a more aggressive phase and potentially push BTC back below USD 60,000. Despite record inflows into equity markets and fresh all-time highs on Wall Street, Bitcoin has struggled to regain momentum toward the USD 100,000 mark.
Key informations
- At the same time, the market is entering a historically weaker seasonal period for Bitcoin. The months between May and September have often brought corrections across crypto markets, particularly during US midterm election years. Combined with a stronger US dollar and rising Treasury yields, this increases pressure on risk assets.
- The US dollar and Treasury yields continue to move higher, weighing on both cryptocurrencies and precious metals. Equity markets remain relatively resilient thanks to solid global economic conditions and the ongoing AI-driven rally. However, investors are increasingly concerned that persistent inflation could force the Federal Reserve to maintain a more hawkish stance.
- Tensions surrounding the Strait of Hormuz remain one of the key macro risks for markets. If the conflict involving Iran continues over the coming months, elevated oil prices could push CPI inflation higher again. Such a scenario would likely strengthen the dollar further and increase pressure on speculative assets, including Bitcoin.
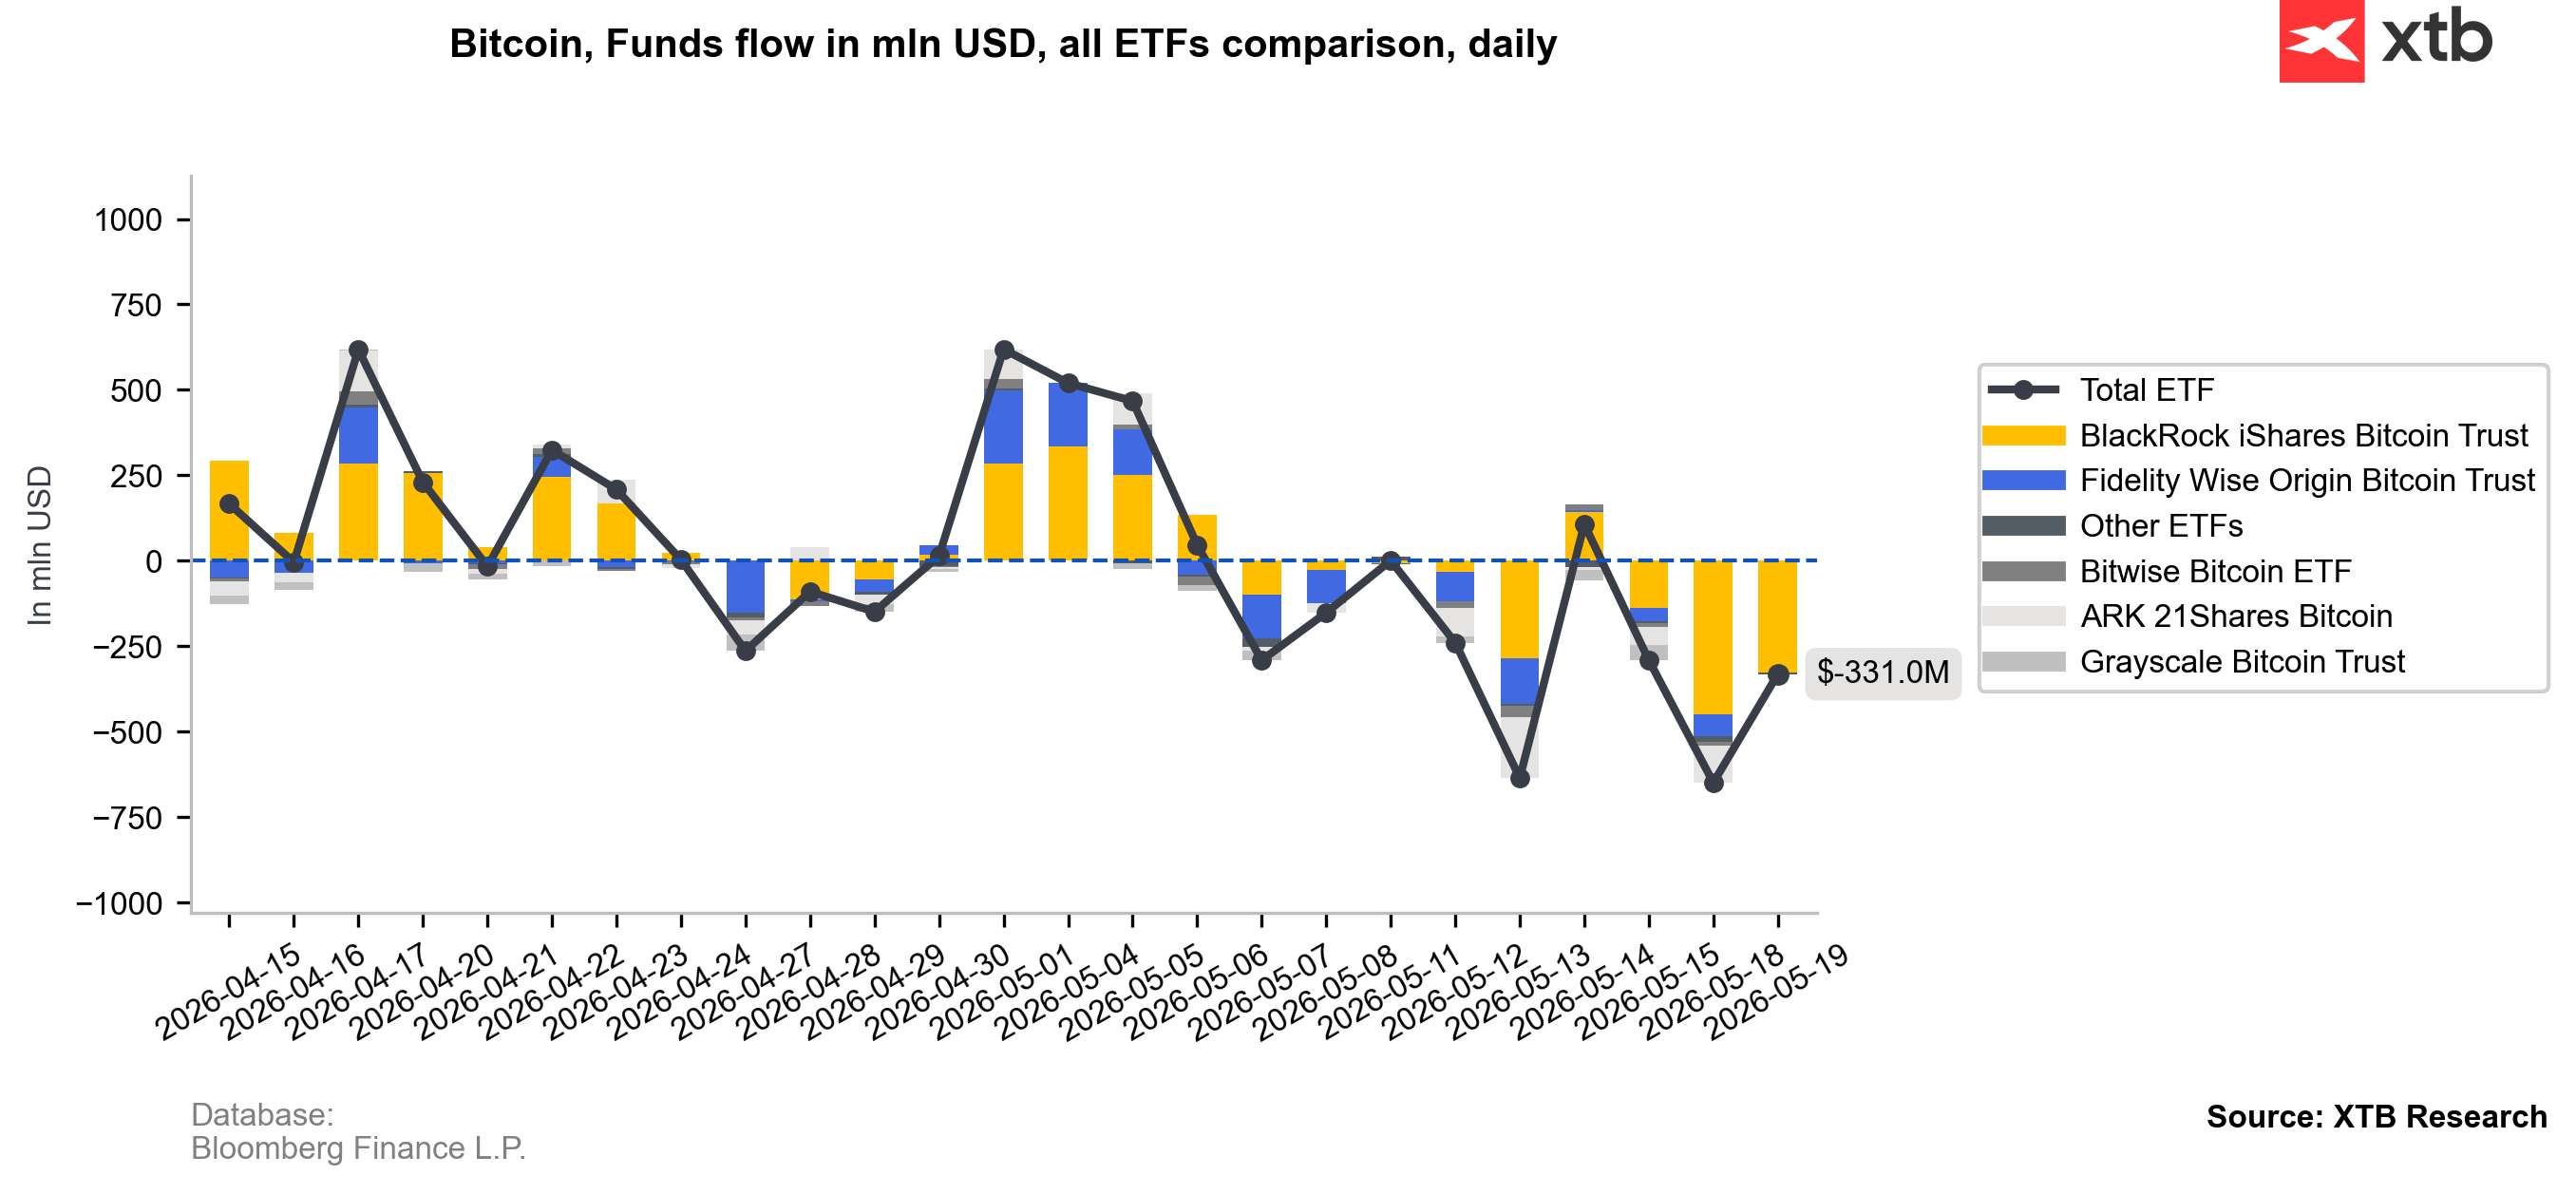
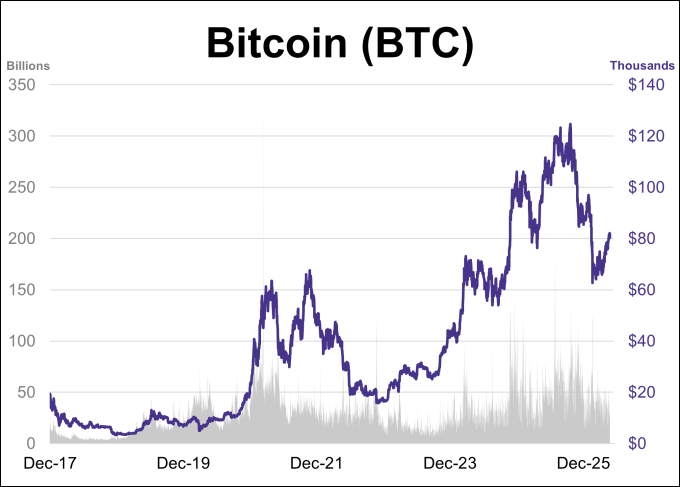
ETF funds are taking profits on Bitcoin
ETF flow data since May 12 shows a noticeable wave of BTC selling by institutional funds. Importantly, the profit-taking emerged while the Nasdaq 100 and S&P 500 were reaching fresh all-time highs. A similar pattern of ETF selling, including activity from BlackRock iShares products, appeared ahead of the major correction during the winter of 2025/2026. Despite the recent selling pressure, ETFs still hold more than USD 56.7 billion worth of Bitcoin and remain one of the most important long-term sources of demand for the market.
 Source: Bloomberg Finance L.P. XTB Research
Source: Bloomberg Finance L.P. XTB Research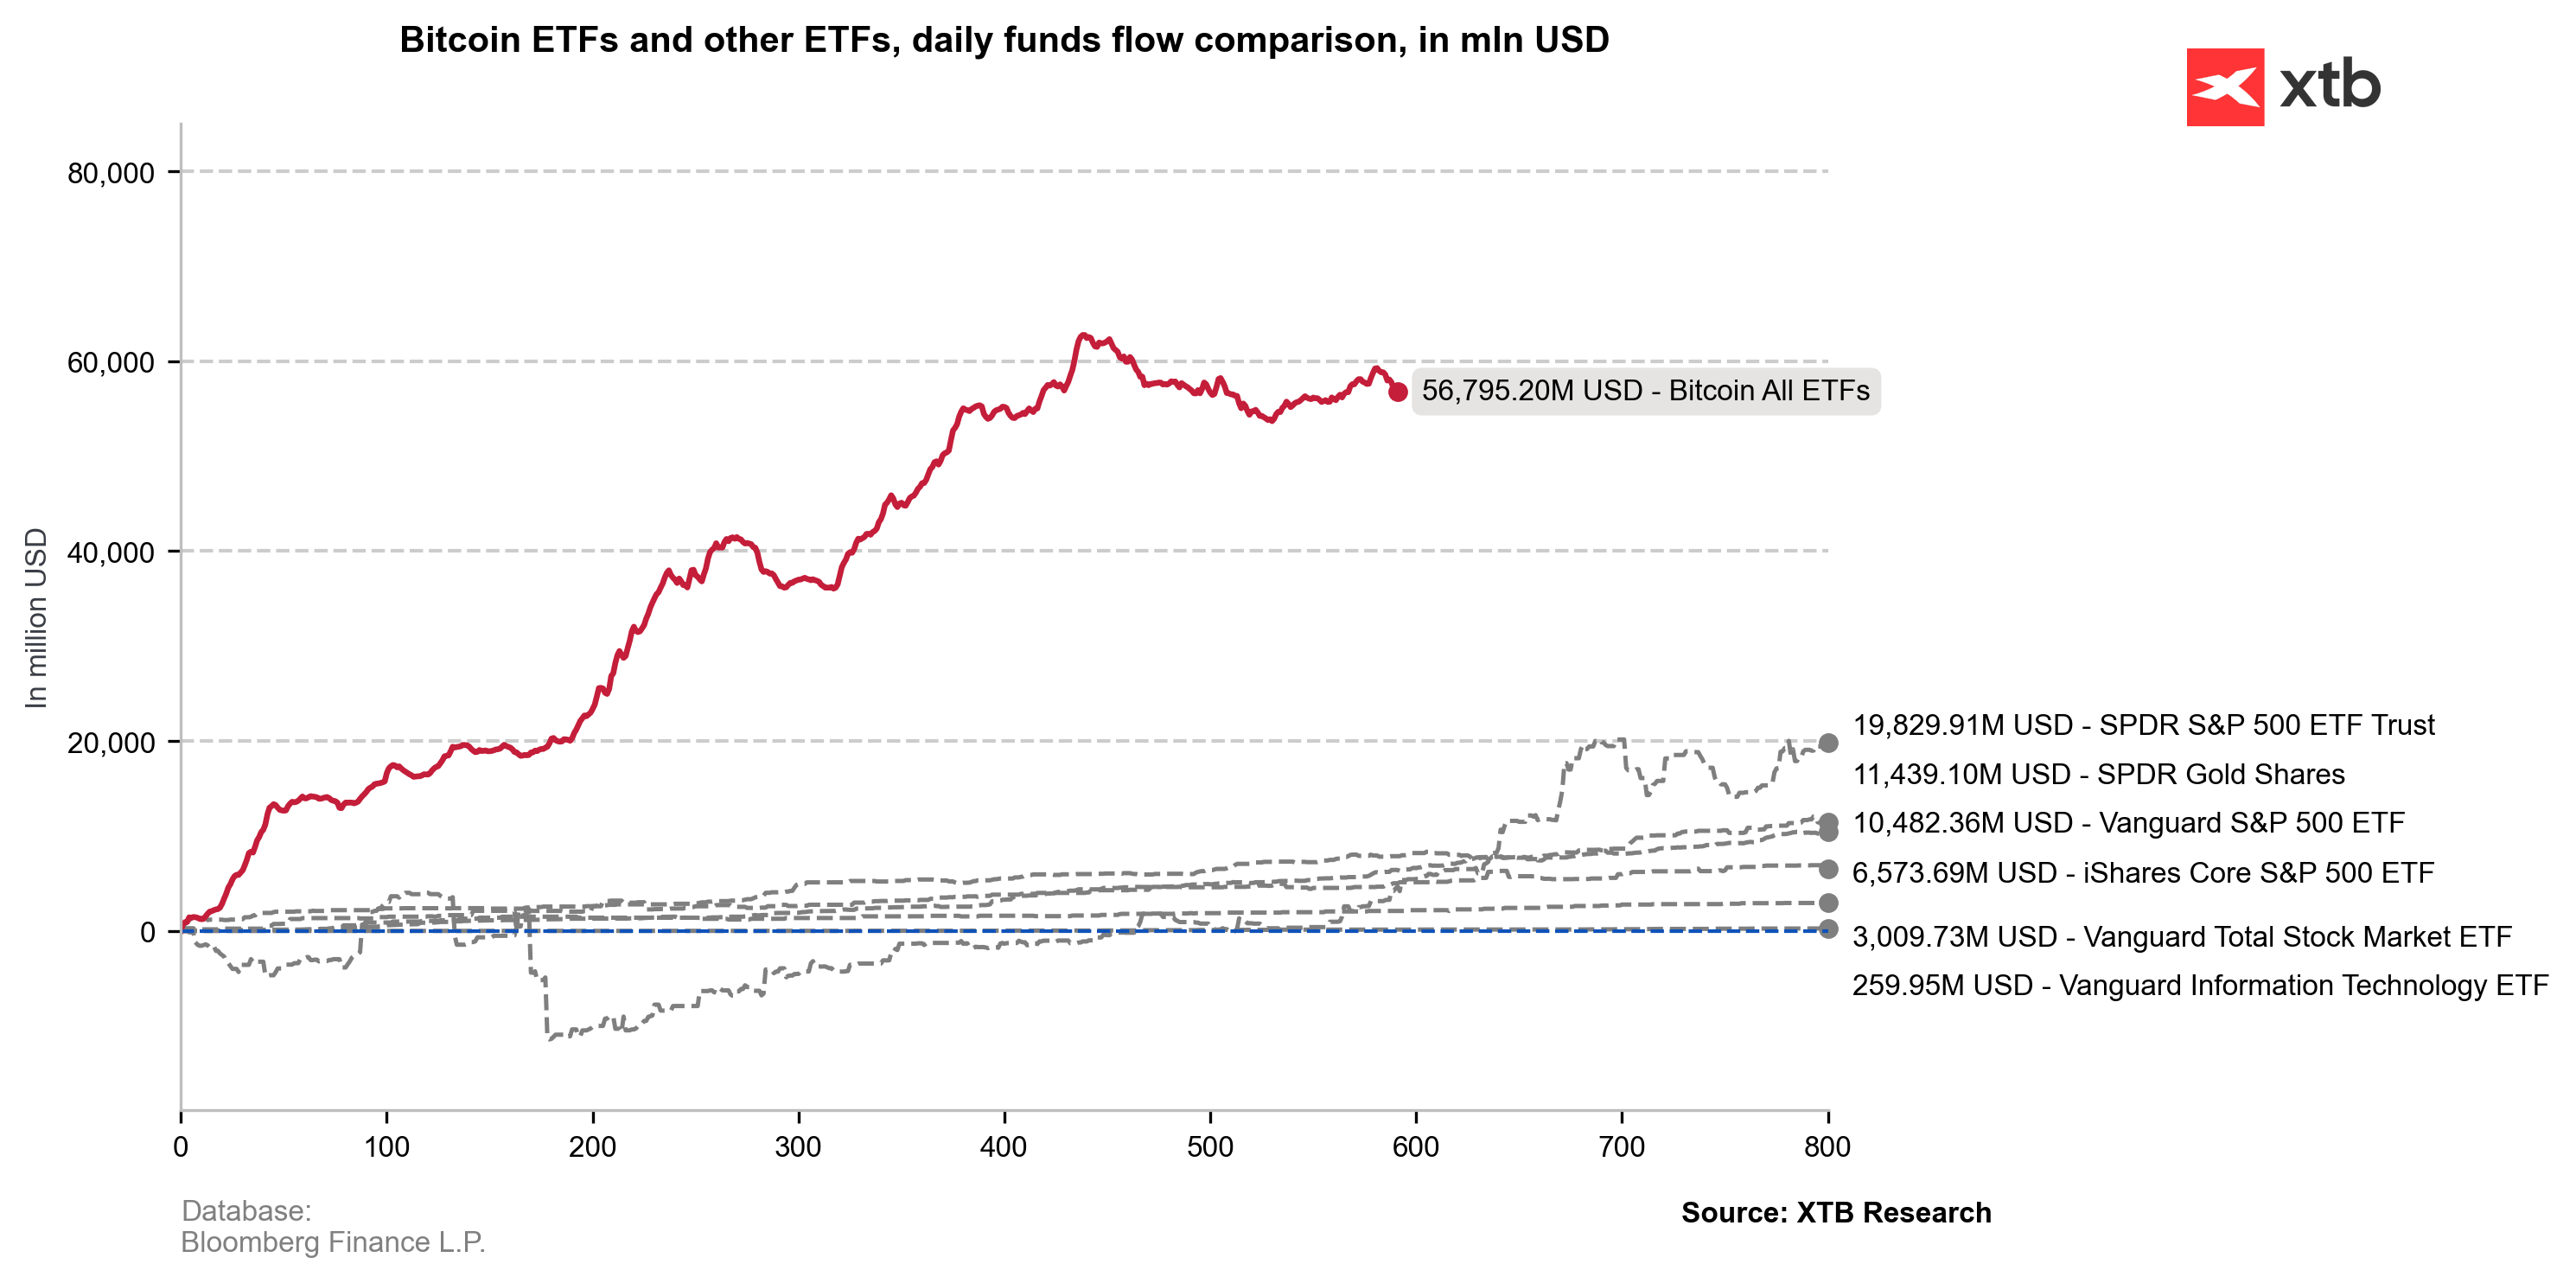 Source: Bloomberg Finance L.P. XTB Research
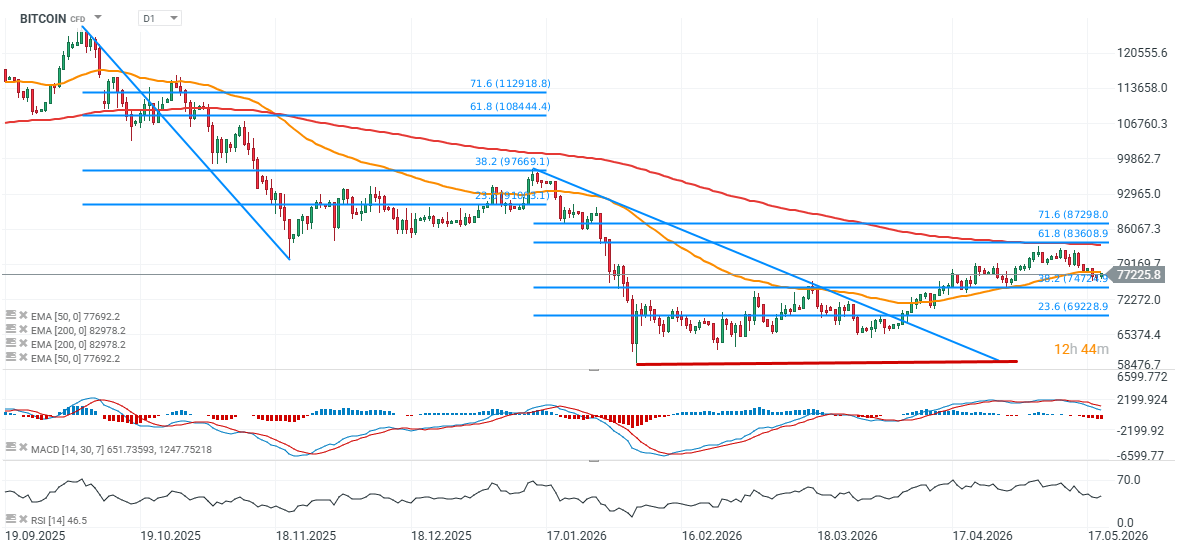
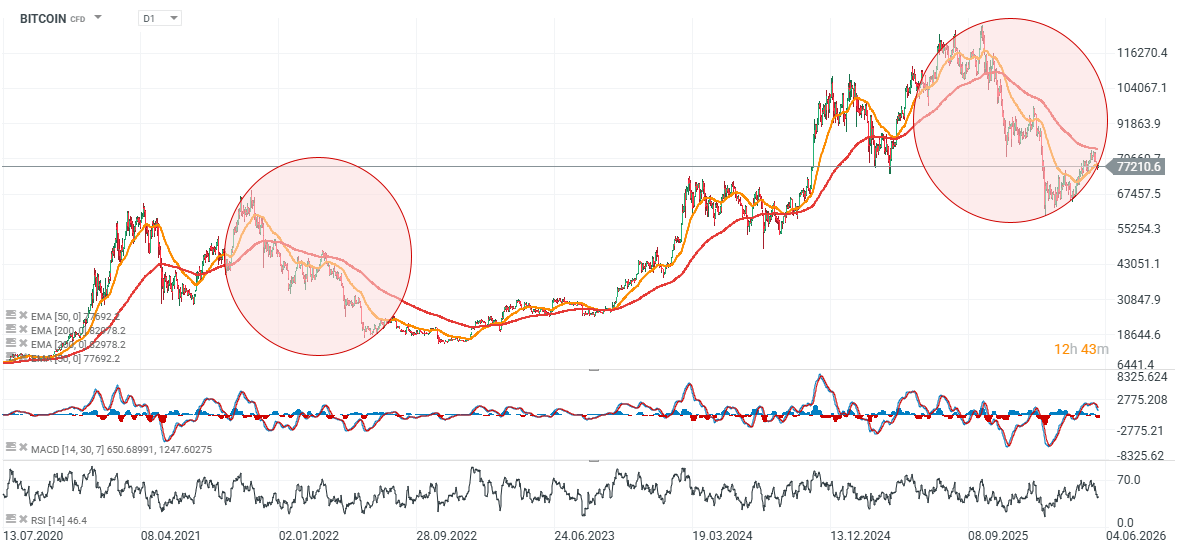
Technical analysis: history may be rhyming again
The current corrective structure increasingly resembles previous Bitcoin sell-offs. This time, however, the rebound proved significantly stronger than the one seen in late 2025 and early 2026, when BTC stalled near the 38.2% Fibonacci retracement before collapsing from around USD 97,000. The latest rally faced strong resistance near the 61.8% Fibonacci retracement around USD 83,600, where the 200-session EMA200 is also located. Since then, Bitcoin has fallen back below the EMA50, signaling weakening short-term momentum.
Source: xStation5
Could the market repeat the 2021 – 2022 scenario?
Comparing the current cycle to the 2021–2022 bear market reveals several similarities in the structure of the correction. It is important to note, however, that the current drawdown remains significantly shallower — even at the lows near USD 60,000, Bitcoin had declined roughly 50% from its highs, compared with nearly 80% during the 2022 collapse. Bitcoin’s growing market capitalization may gradually reduce its long-term volatility compared with previous cycles. Still, summer months have historically been difficult for Bitcoin, meaning the coming weeks could continue to bring elevated volatility and downside risk.
Source: xStation5
Eryk Szmyd, Financial Markets Analyst at XTB


Leave a comment