
Here are some graphs on outstanding mortgages by interest rate, the average mortgage interest rate, borrowers’ credit scores and current loan-to-value (LTV) from the FHFA’s National Mortgage Database through Q1 2026.
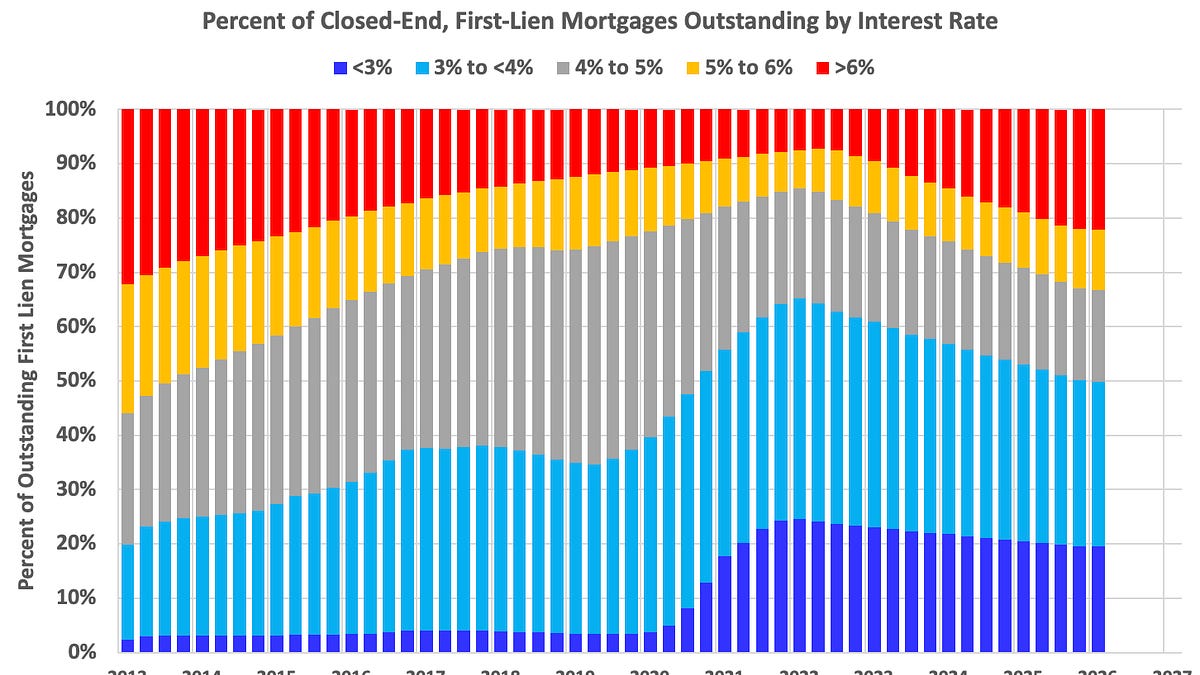
Here is some data showing the distribution of interest rates on closed-end, fixed-rate 1-4 family mortgages outstanding at the end of each quarter since Q1 2013 through Q1 2026.
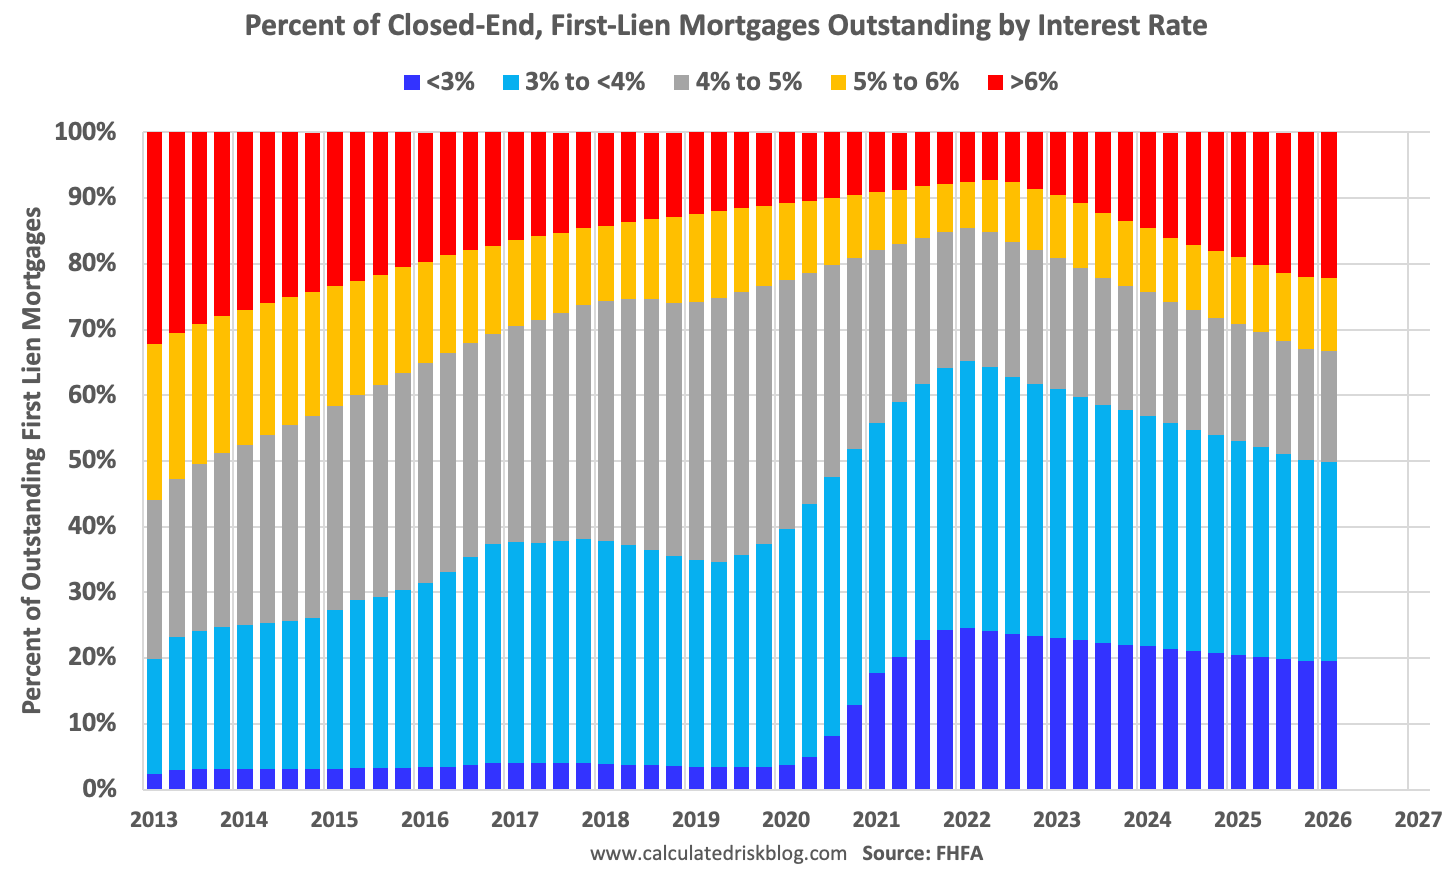
This shows the surge in the percent of loans under 3% starting in early 2020 as mortgage rates declined sharply during the pandemic.
Note that a fairly large percentage of mortgage loans were under 4% prior to the pandemic!
The percent of outstanding loans under 4% peaked in Q1 2022 at 65.1% (now at 49.9%), and the percent under 5% peaked at 85.6% (now at 66.7%). These low existing mortgage rates make it difficult for homeowners to sell their homes and buy a new home since their monthly payments would increase sharply.
This was a key reason existing home inventory levels were so low. However, time is eroding this lock-in effect.
The percent of loans over 6% bottomed in Q2 2022 at 7.3% and has increased to 22.1% in Q1 2026.
Here are graphs on the average mortgage interest rate, borrowers’ credit scores and current loan-to-value (LTV).
The following content is for paid subscribers only. Thanks to all paid subscribers!


Leave a comment