

Litecoin [$LTC] has seen some short-term volatility over the past ten days. The price has frequently moved 5-7% in just over two days, between $43 and $46.
On Wednesday, July 15, the same short-term resistance zone at $46 was tested, and Litecoin bulls faced a rejection from this area. In the past 24 hours, $LTC has shed 1.08%, and its daily trading volume has dropped 8.12%.
For a month now, Litecoin bulls have been battling against the $46 local supply zone. Does the recent bout of volatility mean they will finally succeed?
Here’s what the long and short-term price expectations for Litecoin can be.
$LTC is in a consolidation phase, but could go south once more
The Bitcoin [BTC] price move beyond $65k did not stick. In the short term, this rejection meant the wider crypto market was also facing losses. Since October 2025, both Bitcoin and most of the rest of the altcoins have been facing bear market conditions.
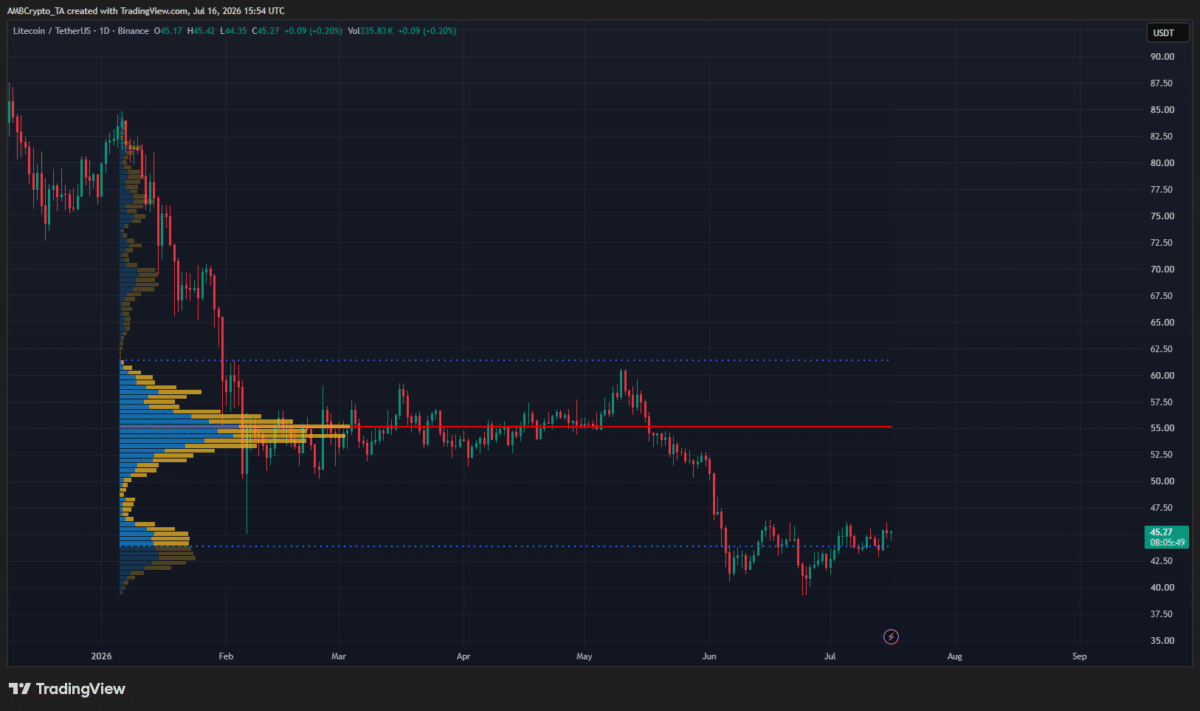
The latest swing move downward began in May. The $LTC bounce to $60.61 was followed by a swift sell-off that dragged prices below the psychological $50 level.
Using the Fixed Range Volume Profile tool from January’s high to today, we can see that the current market price was just above the Value Area Low at $43.9.
The $42-$46 was a high-volume node and represented a support zone. Overhead, the $55 level marked the Point of Control [POC]. A price move beyond $55 would be a positive sign, and a breakout past $60.61 would signal a long-term trend reversal.
Traders’ call to action- Watch the range
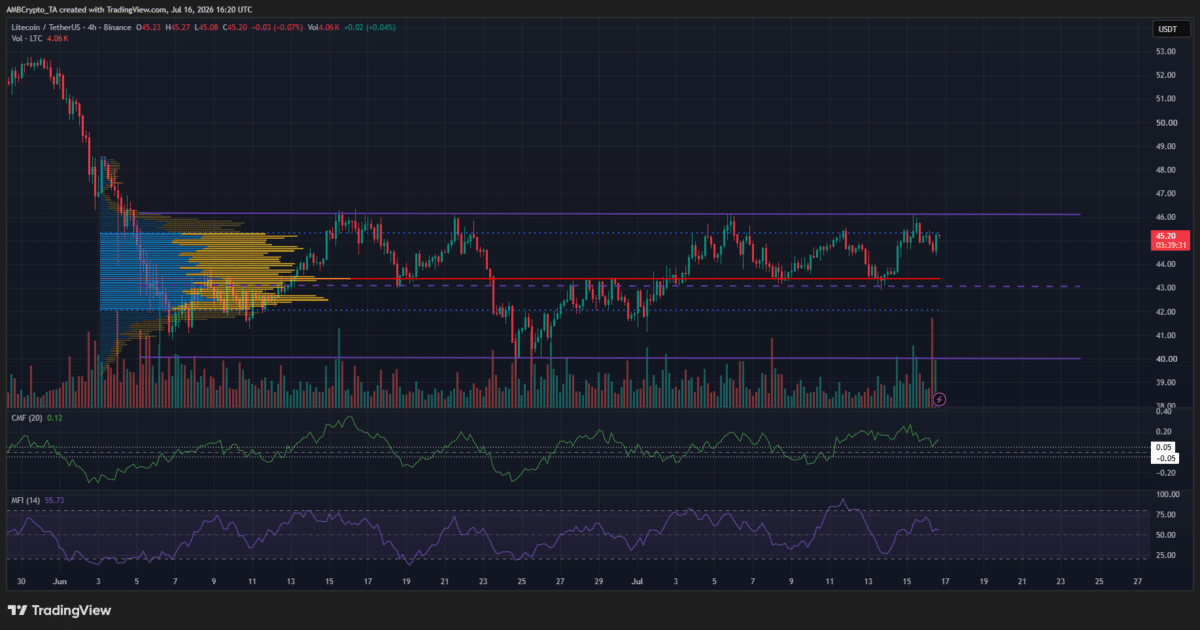
The technical range [purple] reaches from $40 to $46. Using the FRVP tool since the beginning of June, we can see a much smaller range between $42 and $45.3 [dotted blue], with the POC at $43.4.
Though the CMF and MFI indicated steady buying pressure and upward momentum, swing traders need to be wary of the $46 local supply zone.
A breakout beyond this resistance could set up a rally to ward $53-$56. However, based on the higher timeframe trend, it remains likely that such a rally would revert to a bearish move later on.
Final Summary
- The long-term trend was bearish, and the $40-$46 area served as a local consolidation zone.
- The short-term range formation and volume profiles highlighted important local support and resistance levels.









Leave a comment