Bitcoin struggles below $60,000 as Mt. Gox transfers weigh

- A wallet from bankrupt exchange Mt. Gox moved Bitcoin worth $784.20 million.
- Babylon has launched its Bitcoin staking protocol on the mainnet.
- On-chain data shows BTC’s OI-weighted funding rate is negative, signaling bearish sentiment prevails.
Bitcoin (BTC) broadly steadies around $59,000 on Wednesday after failing to gain ground a day earlier, when it briefly touched $61,400. FUD (Fear, Uncertainty, Doubt) seems to be again on the cards among Bitcoin traders as another significant Bitcoin transfer from a Mt.Gox-related wallet increases the selling pressure. In addition, on-chain data shows a negative OI-weighted funding rate for BTC, indicating a bearish sentiment in the market.
Daily digest market movers: Mt. Gox moves 13,265 Bitcoin
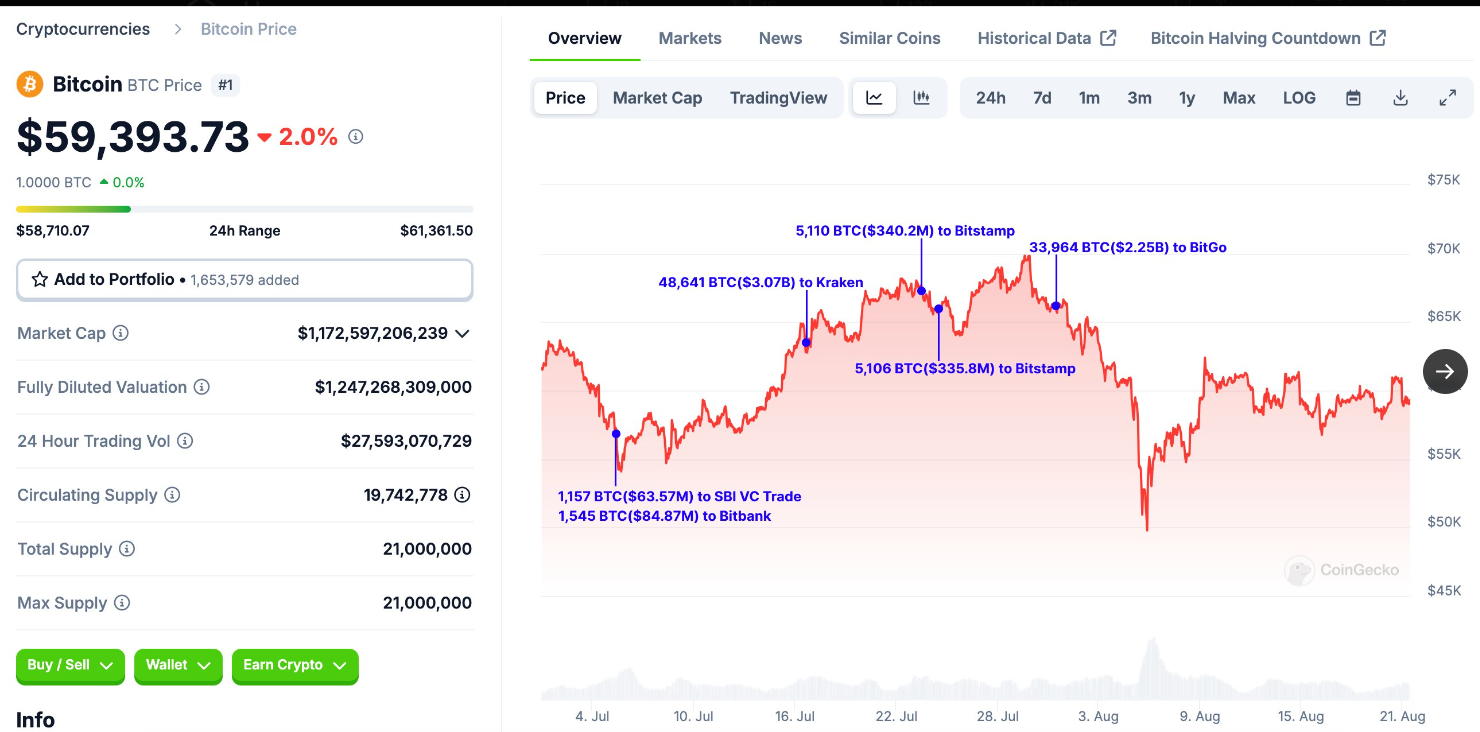
- According to Data Nerd, on Wednesday, defunct exchange Mt. Gox transferred 13,265 BTC, worth $784.20 million, to a new wallet. This transfer could later be sent to exchanges like Bitstamp, BitGo and Kraken for repayment to the creditors.
- Historically, Lookonchain data shows that Mt. Gox’s transfer of 33,964 BTC worth $2.25 billion on July 30 could have caused the Bitcoin price to crash from $66,700 to $54,000 in seven days. This recent activity could generate FUD (Fear, Uncertainty, Doubt) among traders, potentially contributing to a decline in Bitcoin’s price.

Lookonchain data for BTC
- Babylon has launched its Bitcoin staking protocol on the mainnet. Babylon Bitcoin staking protocol connects Bitcoin holders with the demand for network security from Proof-of-Stake systems like PoS chains, layer-2 solutions(L2s), Data Availability layers, oracles, and others. It does so without a trusted intermediary.
- The protocol now includes liquid staking token solutions such as Acorn and Babypie. This advancement builds on Babylon’s previous achievements, such as launching the world’s first trustless Bitcoin staking testnet, which saw over 100,000 participants within 48 hours. The project’s co-founders highlight the protocol’s potential to enhance Bitcoin’s functionality, positioning it as a security framework for Proof-of-Stake (PoS) systems and tapping into the $1 trillion ecosystem of the leading cryptocurrency.
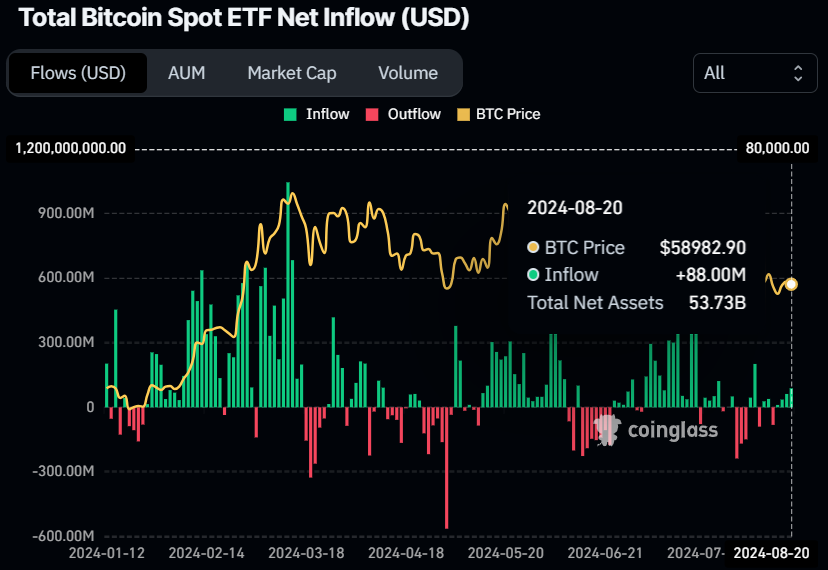
- According to Coinglass data, US spot Bitcoin ETFs saw a modest inflow of $88 million on Tuesday, marking the second consecutive day of gains this week. While these small net flows can indicate investor sentiment, they are relatively minor compared to the $53.73 billion in total Bitcoin reserves held by the 11 US spot Bitcoin ETFs. Still, the ETFs are accumulating four straight days of inflows since August 15.


Bitcoin Spot ETF Net Inflow chart
- Coinglass’s OI-Weighted Funding Rate data is a crucial metric for traders and analysts to assess market sentiment and predict future price movements. This metric relies on funding rates from futures contracts, weighted by their open interest. A positive rate (longs pay shorts) typically signals bullish sentiment as long positions compensate shorts. Conversely, a negative rate (shorts pay longs) indicates bearish sentiment, with shorts compensating longs.
- In the case of BTC, this metric stands at -0.0053%, reflecting a negative rate, indicating that shorts are paying longs. This scenario often signifies bearish sentiment in the market, suggesting potential downward pressure on BTC’s price.

BTC OI-Weighted Funding Rate chart
Technical analysis: BTC extends consolidation between $57,000 and $62,000
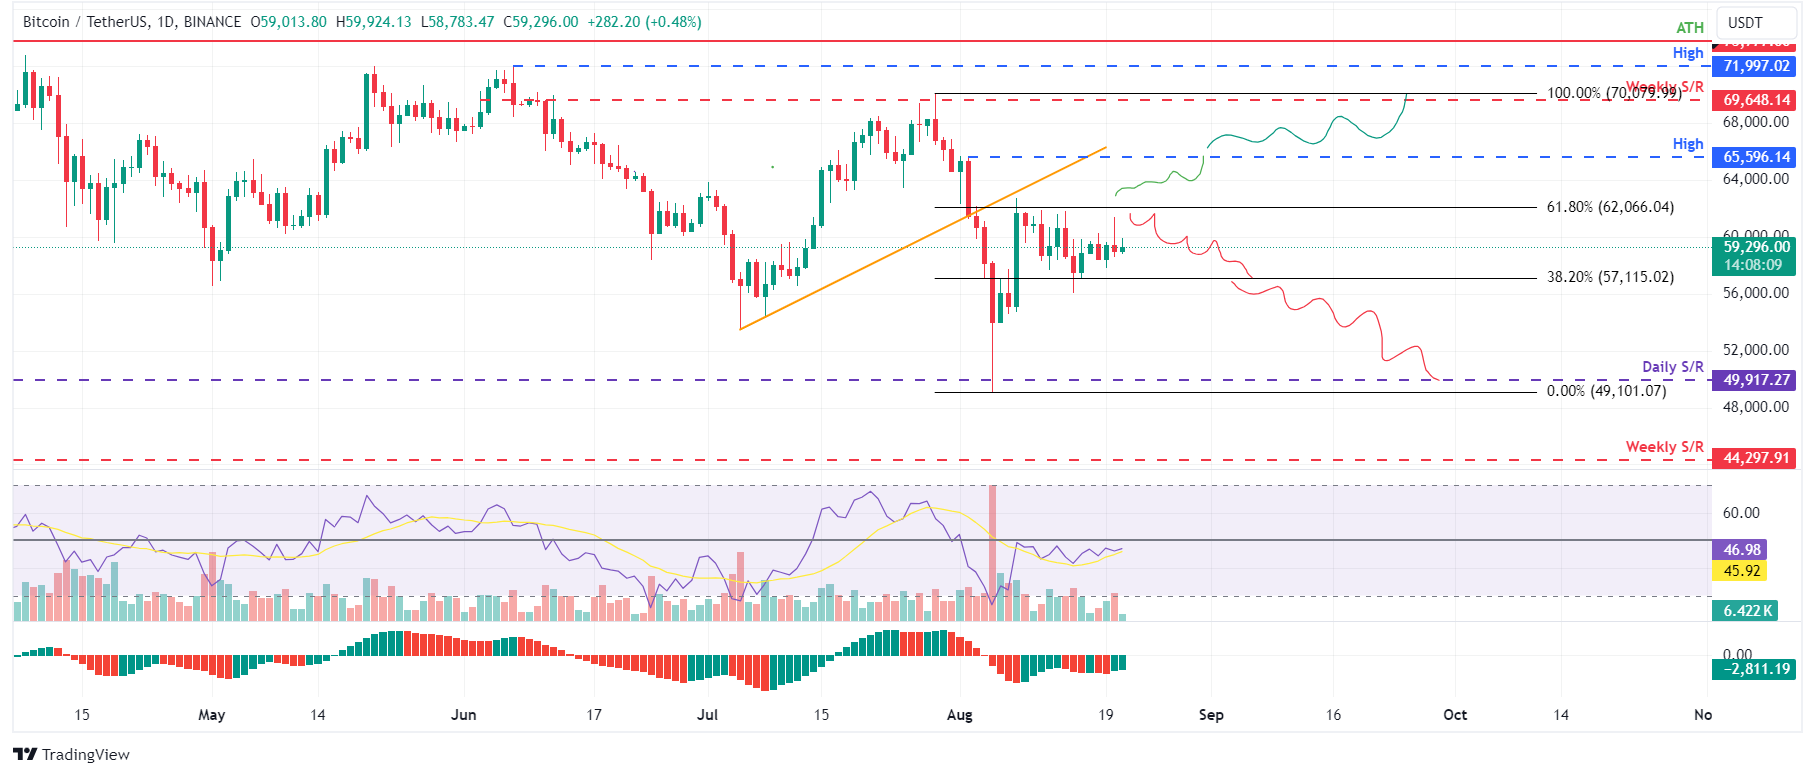
Bitcoin price continues to consolidate between $57,115 and $62,066, the Fibonacci retracement levels of 38.2% and 61.8%, respectively, drawn from the high on July 29 to the low on August 5. On Wednesday, it trades slightly higher by 0.52% to $59,296 at the time of writing.
Suppose BTC rises back to the 61.8% Fibonacci retracement at $62,066. In that case, it may find some resistance at this level, as it aligns with the previously breached trendline and the 100-day Exponential Moving Average of around $62,217, making it a key resistance zone.
If it does not surpass $62,066, it could drop to $57,115 before potentially declining by 19% to revisit the $49,917 daily support level.
On the daily chart, the Relative Strength Index (RSI) and the Awesome Oscillator (AO) still trade below their neutral levels of 50 and zero, respectively, suggesting an impending bearish bias.

BTC/USDT daily chart
However, if Bitcoin’s price can close above $62,066, a rise towards the August 2 high of $65,596 would be on the cards as it would set a higher high on the daily chart. This could lead to a further 6% price increase to test the weekly resistance at $69,648.
Bitcoin, altcoins, stablecoins FAQs
Bitcoin is the largest cryptocurrency by market capitalization, a virtual currency designed to serve as money. This form of payment cannot be controlled by any one person, group, or entity, which eliminates the need for third-party participation during financial transactions.
Altcoins are any cryptocurrency apart from Bitcoin, but some also regard Ethereum as a non-altcoin because it is from these two cryptocurrencies that forking happens. If this is true, then Litecoin is the first altcoin, forked from the Bitcoin protocol and, therefore, an “improved” version of it.
Stablecoins are cryptocurrencies designed to have a stable price, with their value backed by a reserve of the asset it represents. To achieve this, the value of any one stablecoin is pegged to a commodity or financial instrument, such as the US Dollar (USD), with its supply regulated by an algorithm or demand. The main goal of stablecoins is to provide an on/off-ramp for investors willing to trade and invest in cryptocurrencies. Stablecoins also allow investors to store value since cryptocurrencies, in general, are subject to volatility.
Bitcoin dominance is the ratio of Bitcoin’s market capitalization to the total market capitalization of all cryptocurrencies combined. It provides a clear picture of Bitcoin’s interest among investors. A high BTC dominance typically happens before and during a bull run, in which investors resort to investing in relatively stable and high market capitalization cryptocurrency like Bitcoin. A drop in BTC dominance usually means that investors are moving their capital and/or profits to altcoins in a quest for higher returns, which usually triggers an explosion of altcoin rallies.
Source link


