
Litecoin remained locked in a narrow trading band, with price action compressed between roughly $50 and $59 as volatility continued to fade. The prolonged pause has kept attention on whether the token is preparing for a directional move, yet the data still points to a market defined more by caution than commitment.
At press time, $LTC traded near $55.24, holding slightly above its 50-day moving average at $54.60 and near the 23.6% Fibonacci retracement level around $54.51. That zone has started to act as short-term support after previously capping price, suggesting buyers have managed to defend the lower-middle part of the consolidation range without producing a decisive trend shift.
$LTC Remains Trapped in a Tight Multi-Month Price Box
The current structure has remained in place since early February, when $LTC fell more than 46% from its 2026 high near $84.85 to a yearly low around $45.14. After that decline, the token rebounded, but the recovery lost momentum before it could challenge a broader bearish structure.
Its strongest rebound within the range measured about 17.58%, yet that move ended in rejection and sent the price back toward the lower half of the box. Since then, the Litecoin price has continued to oscillate inside the same zone, showing repeated attempts to recover without a lasting breakout.
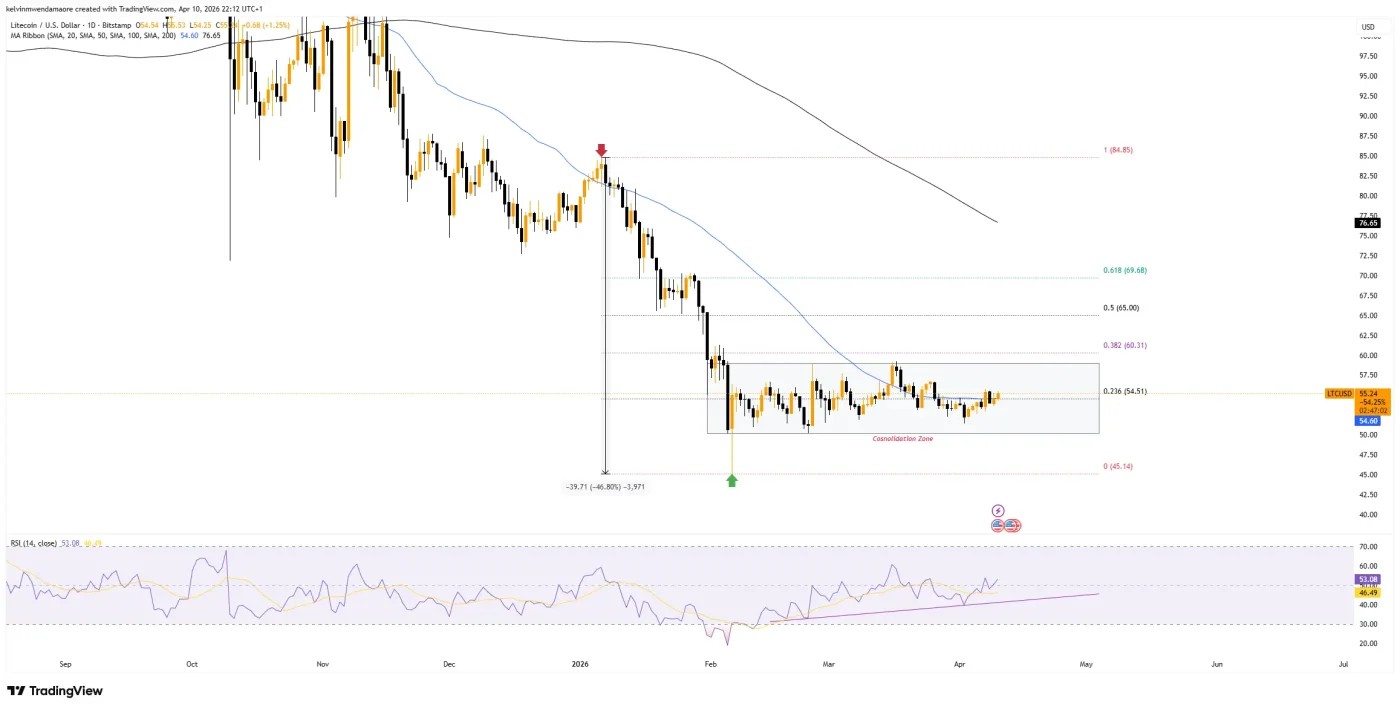
$LTC 1-Day Price Chart (Source: TradingView)
Momentum readings also reflected that balance. The RSI moved slightly above the neutral 50 level, indicating mild improvement in buying pressure, but not enough to confirm a stronger trend reversal. $LTC’s price also remained below major overhead moving averages, showing that broader resistance still hangs over the market.
The year-on-year range added more context to the stalled recovery. Litecoin remained down 24.58% over that period, a reminder that the token is still trading well below its earlier highs. In that setting, the latest stabilization looked more like a pause inside a damaged structure than a completed recovery.
Derivatives Data Shows Weak Conviction Across the Market
CoinGlass data showed open interest moving sideways since February 6, reinforcing the idea that traders have avoided strong directional bets. At press time, $LTC open interest stood around $341.92 million, a level that reflected participation without conviction.
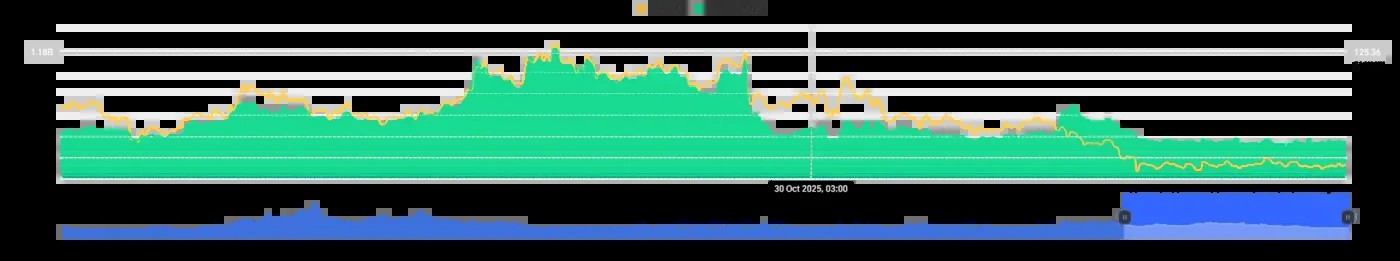
$LTC Open Interest (Source: CoinGlass)
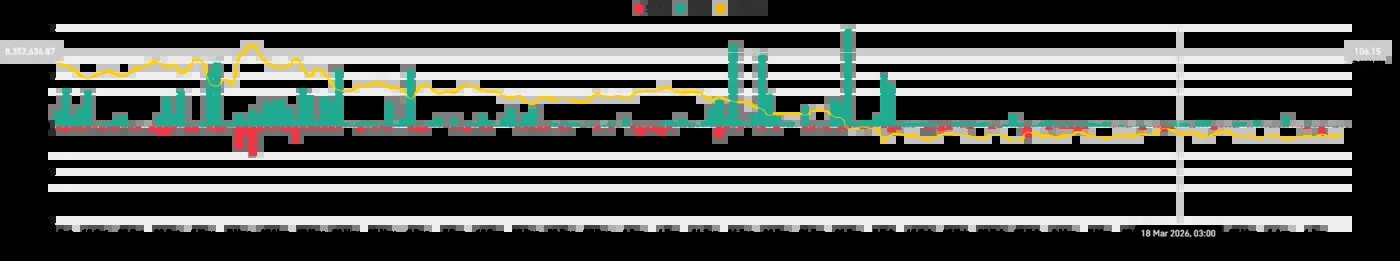
Futures volume told a similar story. Daily volume sat near $259.36 million, while April activity stayed mostly inside a band between $230 million and $350 million. That stood in sharp contrast to mid-January, when futures volume surged above $1 billion during a much more active trading phase.
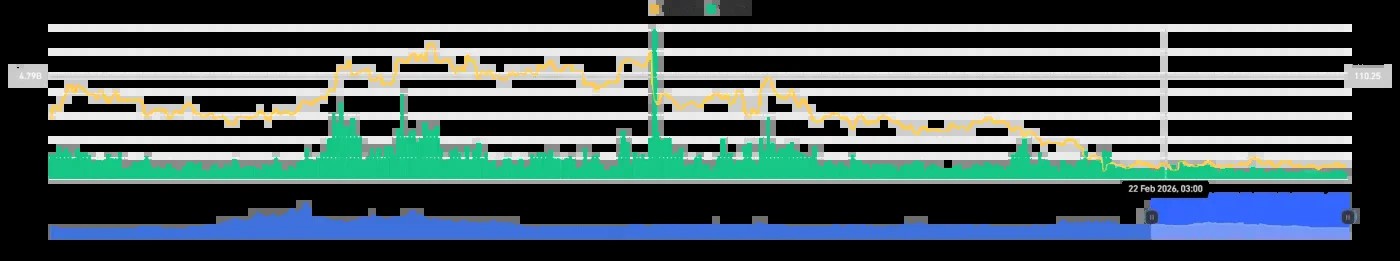
$LTC Futures Volume (Source: CoinGlass)
Liquidation data also remained subdued. In the past 24 hours, total liquidations reached only $93.41K, with longs accounting for $46.18K and shorts for $47.23K. That near-even split suggested neither side had been forced out aggressively, which often happens when the market lacks urgency.
$LTC Liquidation Data (Source: CoinGlass)
Taken together, those figures supported the consolidation narrative. Open interest was flat, volume was restrained, and liquidations were light. The combined effect showed a market waiting for a clearer direction rather than aggressively pricing in a breakout.
Breakout Hopes Rise, but $LTC Data Still Favors Consolidation
For now, the numbers do not confirm a breakout. They show a tightening range, fading volatility, and weak participation, all of which describe a market in holding mode. $LTC has held near support, but it has not produced the volume or positioning shift needed to signal a confirmed escape.
However, the main upside levels remained $60.31, $65.00, and $69.68 if Litecoin reclaims the top of its range. On the downside, a break below the floor of the current structure could reopen the path toward the $45 region.
That leaves the title’s question with a measured answer. A breakout remains possible only insofar as the range has tightened, but current data still describe consolidation, not confirmation.


Leave a comment