Dollar on edge as we look to the new week

A recap of the releases in US trading at the end of last week:
That put some pressure on the dollar but the greenback did at least managed to salvage a bit of pride in the latter hours before the weekend. So far today, USD/JPY is the notable mover as it is trading back up to near 154.00 currently. However, the move belies the underlying sentiment in the dollar across the major currencies board. Let’s take a look.
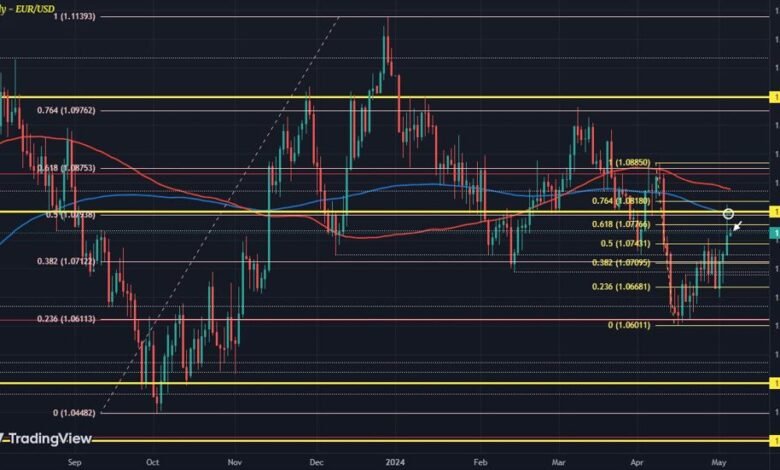
EUR/USD daily chart
To start off, we saw EUR/USD run up to test waters around 1.0800 before easing back. The jump higher also tested its 200-day moving average (blue line), seen now at 1.0795. As such, that remains the key technical resistance level to watch out for coming into this week. Buyers will have to break above that and the 1.0800 region to establish a further upside leg.
GBP/USD daily chart
Then, there is GBP/USD which saw a brief push to 1.2630 levels before falling back on Friday. Of note, sellers are still staying somewhat in the game by keeping price just under the 200-day moving average (blue line). The key level is now seen at 1.2547 currently, so the wrestle for control is very much on to start the week.
The 50.0 Fib retracement level of the swing lower in March and April at 1.2596 is also one to watch before getting to the 100-day moving average (red line), seen at 1.2641 currently.
USD/CHF daily chart
Meanwhile, USD/CHF also moved close to test the 0.9000 mark again after falling all the way down from 0.9200. The drop is still somewhat arrested by a key trendline support for the year (white line), seen at around 0.9050 currently. Sellers are in near-term control but they need to break below those key levels outlined to bring about any further downside momentum.
AUD/USD daily chart
Next, we have AUD/USD which ran up to test the resistance region around 0.6635-50 once more. That has been a key level in limiting any further upside momentum since March trading. And as buyers are now in control, that will be the key spot to watch as we also have to factor in the RBA tomorrow.
NZD/USD daily chart
Then, we have NZD/USD which moved up to test its 200-day moving average (blue line) before easing back as well. The key technical level is now seen at 0.6037. And that will be the crucial resistance point to watch for the pair on the week. That alongside the 38.2 Fib retracement level of the swing lower this year, seen at 0.6049.
TLDR: In summary, the dollar drop on Friday was met by a couple of key levels on the charts. It was a bend but don’t break moment for the dollar, even if it did weaken last week. But the greenback is very much on edge as we get into the new week, with keen eyes on the key technical levels highlighted. If there is a break of those levels across the board, that will facilitate the next leg lower in the dollar.
Source link


