Agricultural land management and rural financial development: coupling and coordinated relationship and temporal-spatial disparities in China

Measuring the coupled and coordinated relationship
Measurement of the agricultural land management index and the rural financial development index
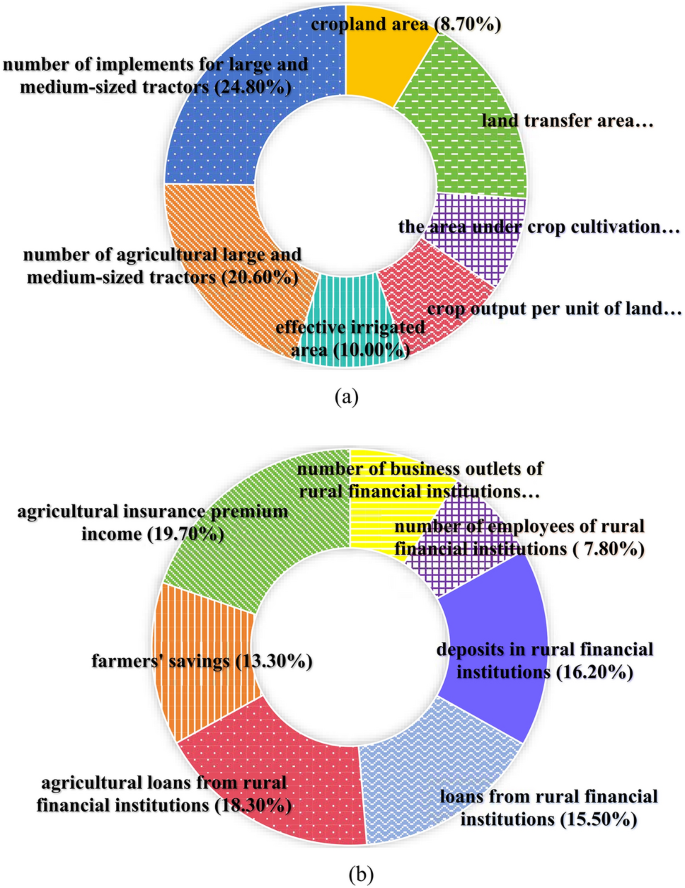
Figure 2 shows the weights of the variables calculated using the entropy method. It shows that the weights of the area of arable land, the area under crop cultivation, the number of business outlets of rural financial institutions, and the number of employees at these institutions are 0.087, 0.084, 0.091, and 0.078, respectively. Each of these weights is below 0.1, indicating that the impact of these variables on their respective systems is relatively small. Conversely, the weights of the number of large- and medium-sized tractors for agricultural use, the number of farm implements compatible with these tractors, agricultural loans from rural financial institutions, and agricultural insurance premium income are significantly higher, being 0.206, 0.248, 0.183, and 0.197, respectively. As all these values exceed 0.18, these indicate a greater impact on their corresponding systems.
-
(1)
Agricultural land management index
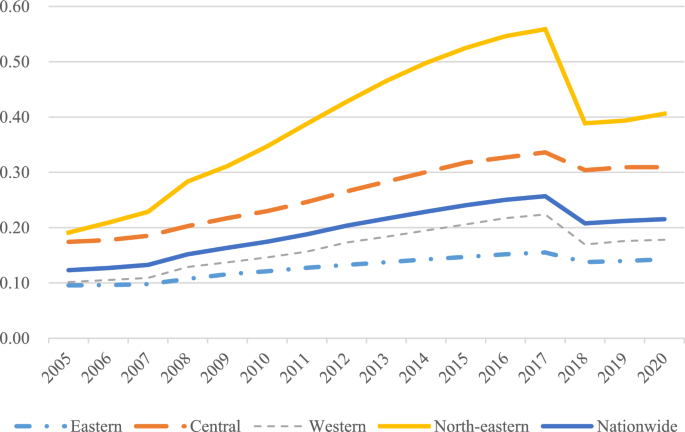
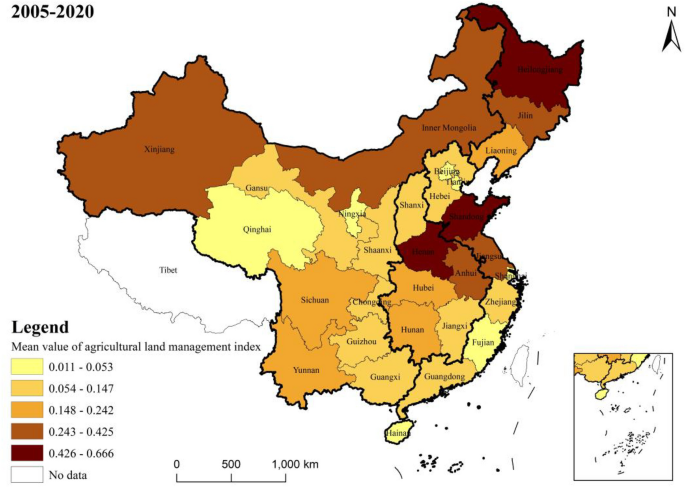
The results of measuring the agricultural land management index across various regions of the country are shown in Fig. 3, while Fig. 4 shows the mean value of this index in 30 provinces.
Nationally, from 2005 to 2017, there was an upward trend in the national average level of farmland management, the average level of farmland management demonstrated a slow downward trend from 2017 to 2020. There are significant variations in agricultural management status among the eastern, central, western, and north-eastern regions. Among these, the northeastern region exhibited the highest farmland management index, with a mean value of 0.386, followed by the central region at 0.262, and a notable difference of 0.258 between the highest and lowest values.
From the perspective of the provinces, at the provincial level, the disparities become even more pronounced. The top three provinces in terms of farmland management are Heilongjiang, Shandong, and Henan, with mean values of 0.666, 0.533, and 0.53 respectively. Conversely, Tianjin, Qinghai, and Shanghai rank as the bottom three, with mean values of 0.018, 0.013, and 0.011 respectively. The level of agricultural land management in all provinces and cities is improving comprehensively The fastest-growing provinces in this aspect are Heilongjiang, Inner Mongolia, and Qinghai, with average annual growth rates of 8.8%, 8.6%, and 8.3% respectively. However, Beijing and Shanghai experienced negative annual growth rates of −1.9% and −1.4% respectively. In terms of volatility, the eastern and central regions grew at a significantly slower rate compared to the western and northeastern regions.
-
(2)
Rural finance index
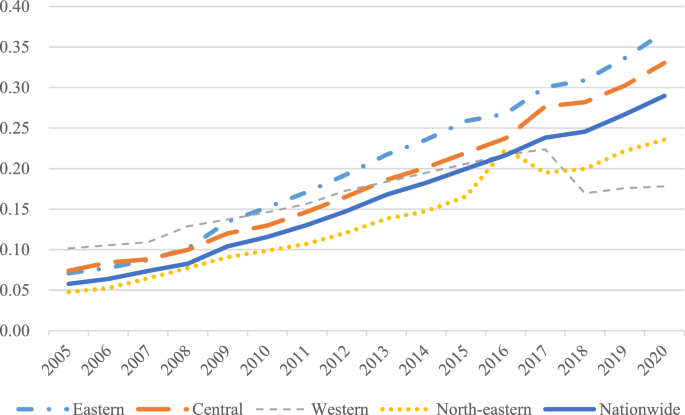
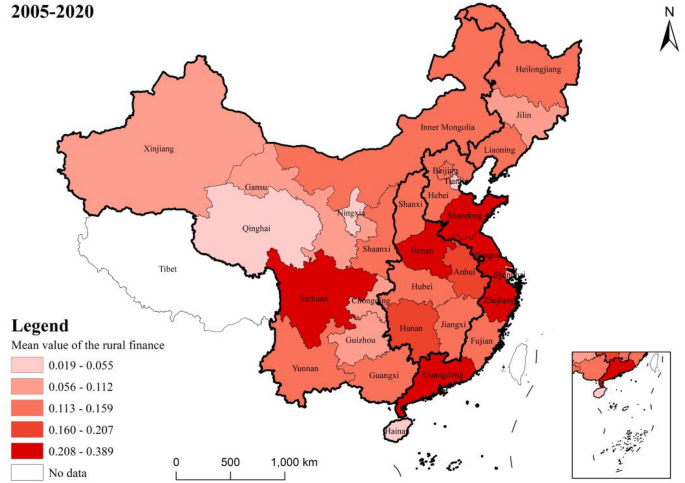
Figure 5 presents the rural finance index measurements for each region in the country, while Fig. 6 shows the mean value of the rural finance index across 30 provinces.
Nationally, the level of rural finance has seen an annual growth both at the national and regional levels, from 0.058 in 2005 to 0.29 in 2020. However, despite this growth, the overall development level of rural finance is still relatively modest in numerical terms. At the regional level, there are significant disparities in rural financial development among the eastern, central, western, and northeastern regions. This is consistent with the results of Tan et al.40. The eastern region leads in terms of rural financial development with a mean value of 0.198, followed by the central and western regions with mean values of 0.205 and 0.116, respectively.
When examining the rural financial development at the provincial level, there is a notable variation across provinces. The provinces of Guangdong, Shandong, Zhejiang, and Jiangsu are the top performers, with mean values of 0.389, 0.357, 0.355, and 0.345, respectively. These provinces are all located in the eastern coastal region. On the other side, Tianjin, Ningxia, Hainan, and Qinghai are ranked as the lowest, with mean values of 0.055, 0.024, 0.024, and 0.019, respectively. The rural finance index for each province and city demonstrates a fluctuating yet upward trend from 2005 to 2020, indicating a consistent year-on-year increase in the level of rural financial development in each province and city. The provinces having the fastest growth are Ningxia, Hainan, Qinghai, and Xinjiang, with average annual growth rates of 183.7%, 128.1%, 117.8%, and 104.4%, respectively.
Measurement and analysis of the degree of coordination of the coupling of agricultural land management and rural financial development
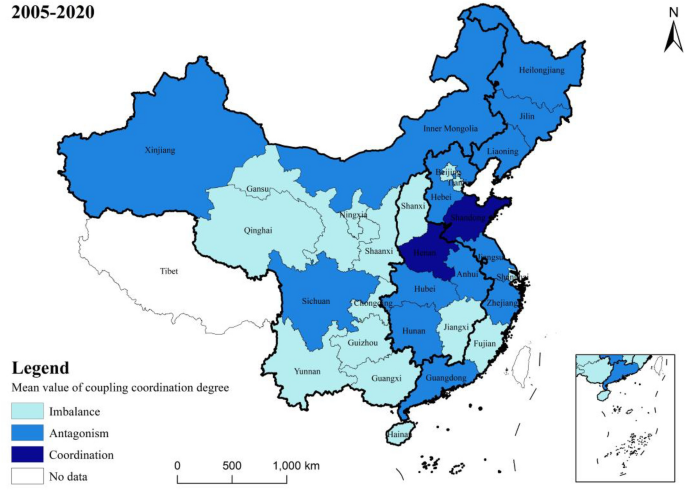
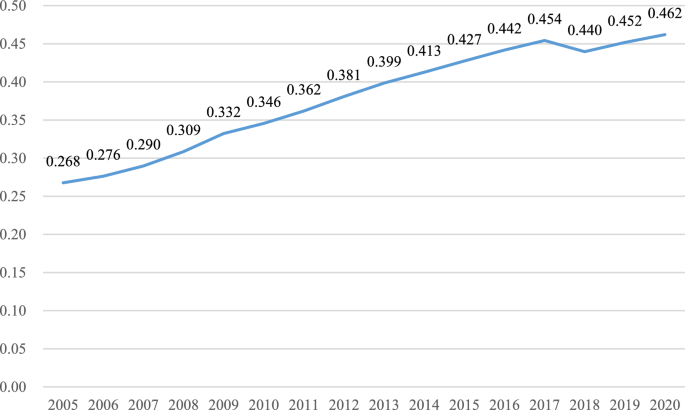
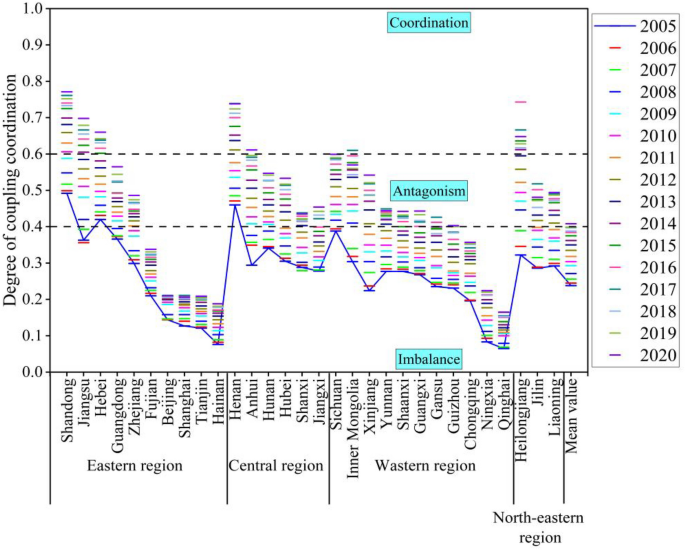
Figure 7 illustrates the mean values of the coupling coordination degree of two systems (agricultural land management and rural finance) in each province from 2005 to 2020. Figure 8 presents the annual mean value of the coupling and coordination degree of these systems in 30 provinces across the country over the same period. Detailed measurement results are provided in Fig. 9.
From an overall trend perspective, the coupling coordination degree (D) of the farmland management and rural finance systems from 2005 to 2020 mainly ranges between 0.2 and 0.8. This range encompasses areas of imbalance, antagonism, and coordination, Temporally, the coupling coordination degree of agricultural land management and rural finance has shown a consistent year-by-year increase from 2005 to 2020. This suggests that these two systems are generally having a trend of mutual cooperation and coordinated development.
In terms of regional disparities, the Northeast has the highest mean value (0.454) for coupling and coordination between agricultural management and rural finance, which is considerably greater than the national mean value. There was a rising trend from 2005 to 2016, followed by a sporadic decline. The high degree of agricultural scale and increasing coverage and utilization of financial institutions in the three northeastern provinces have contributed to continuous growth in the rural financial market and subsequent transition to high-quality development. The Western region, despite an overall rising trend, has the lowest mean value (0.338) for coupling coordination. This is partly due to the lower land transfer rates and reluctance of farmers to transfer land in some Western provinces, and partly due to the low degree of urban–rural integration in this region, making it challenging for urbanization and rural construction to progress concurrently.
From the perspective of provinces, in 2005, the coordination degree of most provinces was categorized as middle dissonance and mild dissonance. By 2020, many provinces are in a state of primarily coordination, and intermediate level coordination. Similar to the views of Wang et al.41 and Liu et al.42, many provinces have shown a trend of coordinated development, a gap remains in achieving quality coordination. Challenges such as immature methods for confirming the rights to agricultural land have not yet fully matured, and problems such as high barriers to business entry, difficulties in collateral realization, unqualified collateral assessment, and inadequate risk mechanisms create impediments to the carrying out of business-rights mortgages. Shandong and Henan exhibit strong coupling coordination degrees, with mean values of 0.65 and 0.611. These regions use digital technology innovation as a core driver to provide financial support and risk protection for green agricultural development43,44. Conversely, Hainan and Qinghai Province have lower degrees of coupling coordination, at 0.14 and 0.118, respectively. Reflecting serious imbalances and uncoordinated development. The difference between the highest and lowest degrees of coupling coordination is 0.532, highlighting significant developmental and imbalance differences among provinces.
Analysis of types of coupled coordination
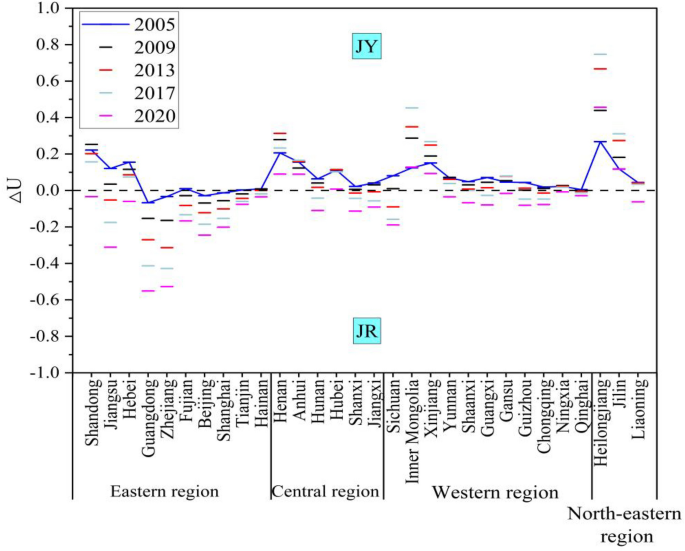
Figure 10 presents a list of the types of coupled coordination between agriculture land management and rural finance in each province over a five-years period, selected at intervals. Among them, \({{\text{U}}}_{1}\) represents the value of the composite variable of agricultural land operation, and \({{\text{U}}}_{2}\) represents the composite variable value of rural finance. The coordination types are categorized based on the difference (\(\Delta {\text{U}}={{\text{U}}}_{1}-{{\text{U}}}_{2}\)). Combining existing scholarly research on the relative developmental advantages of subsystems45,46. This paper distinguishes two coordination types: when \(\Delta {\text{U}}>0\) the corresponding year and province fall under the coordination type known as agricultural land management is the agricultural land management superiority type (JY); when \(\Delta {\text{U}}<0\), the corresponding year and province coordination year and province coordination type is rural financial superiority type (JR).
Divided agriculture land management superiority type and rural financial superiority type. By exploring the relative development speed of subsystems, it is helpful to clarify the development advantages and financial support of agriculture land management in different regions, so as to optimize resource allocation and formulate more reasonable and effective agricultural production and financial policies according to the actual situation of each region, so as to make agriculture land management and rural finance more coordinated, thus promoting agricultural modernization and rural economic development.
In terms of the time span from 2005 to 2020, provinces and municipalities across the country generally exhibit ∆U year by year. There is a tendency for the growth of rural finance to outpace the growth of agricultural land management. This is especially evident given the rapid development of rural financing, where the gap between the two systems is gradually widening. This trend indicates that the current development of rural finance is mainly focused on ‘quantity’. Consequently, there is an emerging phenomenon of inefficient use of agricultural funds. Moreover, the effectiveness of guiding farmers to operate farmland through rural financial tools is not enough, and its role in driving the large-scale operation of agriculture is insufficient. Consistent with the view of Long and Qu2, if the lack of a close link between rural financial funds and farmland management may, in the long term, affect the pace of large-scale agricultural management.
In terms of spatial span, Beijing, Shanghai, Zhejiang, and Guangdong consistently exhibit a negative ∆U, indicating they are always of the ‘rural financial superiority’ type (JR). These provinces, located in the eastern region, benefit from locational, talent, and policy advantages, and the development of rural finance here has been boosted by the overall economic operation trend. In contrast, Inner Mongolia, Jilin, Heilongjiang, Anhui, Henan, Hubei, and Xinjiang have always shown a positive ∆U, categorizing them as ‘agricultural land management superiority’ type (JY). Inner Mongolia and Xinjiang, for instance, suffer from a lack of geographic advantages and have experienced the issues like the loss of agricultural funds. Meanwhile, Jilin, Heilongjiang, Anhui, Henan, and Hubei, despite their high overall level of economic development, have large areas of farmland and significant populations, resulting in relatively low coverage and accessibility of financial institutions and services. Notably, the ∆U values of Inner Mongolia, Jilin, Heilongjiang, Anhui, Henan, Gansu, and Xinjiang demonstrate a trend of first increasing and then decreasing. This suggests that these provinces initially prioritize the development of agricultural land management before gradually accelerating the pace of rural financial development47.
Spatial and temporal differences and dynamic evolution of the coupled development of agricultural land management and rural finance in China
Spatial and temporal differences in the development of the coupling of farmland management and rural finance in China
Measuring the degree of coordination of the coupling of agricultural land management and rural finance in China is analysed from an overall perspective, but since there are significant differences between different regions, it is necessary to further analyse the situation from a regional perspective.With reference to the current division of China’s regions by most scholars31,32, we divide China into four regions: eastern, central, western, and northeastern. On the one hand, this will help to make comparisons between regions, discover the strengths and potentials of each region, and understanding whether there is an inequitable allocation of agricultural land management and rural financial resources; on the other hand, it will help the government and relevant institutions to formulate targeted policies, thus promoting the coordinated development of farmland management and rural finance.
In order to describe the spatial differences in the coupled development of the two systems and their sources, this article uses the Dagum Gini coefficient; Table 4 displays the measurement findings.
-
(1)
Totally and intra-regional variations
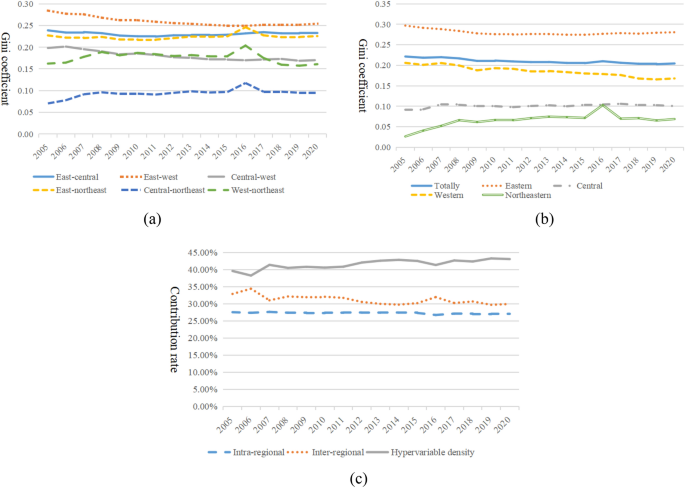
The overall and intra-regional variations in the evolution of the relationship between agricultural management and rural finance in China are depicted in Fig. 11a. In terms of the overall scope, there was a varying decreasing tendency in the total difference in the two systems’ levels of coupling over the sample study period. The overall Gini coefficient’s mean value was 0.2102, declining from 0.2215 in 2015 to 0.2102 in 2020 at an average annual rate of 0.51%. This suggests a minor narrowing of the gap in China’s growth between the coupling of overall farmland management and rural finance.
Figure 11 Regarding intra-regional differences, differences in the synergistic development of agriculture land management and rural finance are most pronounced in the eastern provinces. This may be attributed to the fact that some Eastern provinces, such as Shandong, Jiangsu, and Hebei, lead the country in the development of agricultural land finance due to the rapid development of the rural economy. These areas also have favorable natural geographic environments and have achieved a high level of large-scale operation, resulting in a relatively high level of coordinated development between farmland operation and rural finance. However, provinces like Beijing, Shanghai, Tianjin, and Hainan have minimal agricultural land and their economies do not depend heavily on agricultural operations, leading to a lower degree of coordination between rural finance and agricultural land management. Consequently, significant differences have emerged in the coordinated growth of agricultural operation and rural financing among the Eastern provinces. The largest increase in the Northeast region may be due to the long-term lack of national strategic support for rural finance in this area. Despite the 2003 strategy of ‘revitalizing the old industrial bases in the Northeast,’ the financial issues in the region have not significantly improved. The differences in industrial structure, uneven capital investment, and varying degrees of openness to the outside world among the three eastern provinces have led to an increase in the differences in the coupled development of the two systems. In contrast, in the Eastern and Western regions, the Gini coefficients for the combined development of agricultural land management and rural finance exhibit a varying decreasing tendency. From 2005 to 2020, the average annual drop rates of the Gini coefficients were 0.36% and 1.23%, respectively, showing a decline in intra-regional disparities. Initially, the traditional rural financial path heavily depended on geographic location, transportation resources, regional development level, and other factors, leading to significant disparities in rural financial growth across provinces and municipalities. However, Similar views to Wang48, with the advent of intelligent, digital high-tech solutions, rural finance has become less reliant on traditional financial outlets and infrastructure. This technological shift, breaking geographical limitations and facilitating increased fund exchanges, has led to a simultaneous increase in the level of rural financial development and a natural narrowing of regional differences.
-
(2)
Inter-regional differences
Figure 11b illustrates the evolution of inter-regional differences in the coupled development of agricultural land management and rural finance in China. Horizontally, the largest inter-regional differences are between the East and the West, with a inter-regional Gini coefficient of 0.2599. The degree of differences in the coupled development decreases in the following order: between the East and the Center (0.2308), the East and the Northeast (0.2241), the Center and the West (0.1804), the West and the Northeast (0.1764), and the Center and the Northeast (0.0938). The Eastern region, benefiting from its natural geographical advantages, talent resources, and advanced development concepts, supports the coordinated development of agricultural land and finance. In contrast, the Western region, located inland, lacks geographical advantages for the development of rural financial services, faces a relative shortage of human resources, and has less advanced development concepts. Despite the implementation of the Western development strategy, the growth of non-agricultural sectors, and digital development, which have reduced the threshold for rural financial development, these measures have not significantly bridged the gap in rural financial development between the Eastern and Western regions in a short period.
The Central and Northeastern regions show a varying rising trend in the inter-regional growth of the coupling of agricultural land management and rural finance throughout the study period, with an average annual increase of 2.38%. In contrast, the inter-regional disparities in the combined growth of rural finance and agricultural land management in the remaining areas exhibit a cyclical declining tendency. This means the coupling development level in regions with high and low development is converging towards the national average.
-
(3)
Sources and contributions of regional disparities
Figure 11c illustrates the regional contribution rates of China’s agricultural land management and rural financial coupling development. The variability in contribution sources reflects changes in the mechanisms causing disparities in the development of agricultural land management and rural financial coupling.
In terms of trends in contribution rate changes, the overall intra-regional contribution rate curve is relatively flat with minimal changes. The interregional contribution rate rose slightly from 32.88% in 2005 to 34.4% in 2006, and then fluctuated down to 29.93% in 2020. It shows an evolutionary process of “slight increase—fluctuating decline”. The hypervariable density reflects the contribution of the overlapping parts to the overall difference in the process of dividing the regions. The curve is symmetrical with that of the inter-regional contribution rate, decreasing slightly from 39.59% in 2005 to 38.25% in 2006, and then fluctuating up to 43.06% in 2020. It shows a “slight decrease—fluctuating increase” evolution.
In terms of the magnitude of the contribution, hypervariable density has the highest average contribution, with a mean value of 41.53%. This is followed by the inter-regional contribution with a mean value of 31.19%, which is slightly higher than the intra-regional contribution (27.28%). This reflects the fact that the inter-regional cross-over has a more pronounced impact on the overall disparity.
Dynamic evolution of the coupled development of agricultural land management and rural finance in China
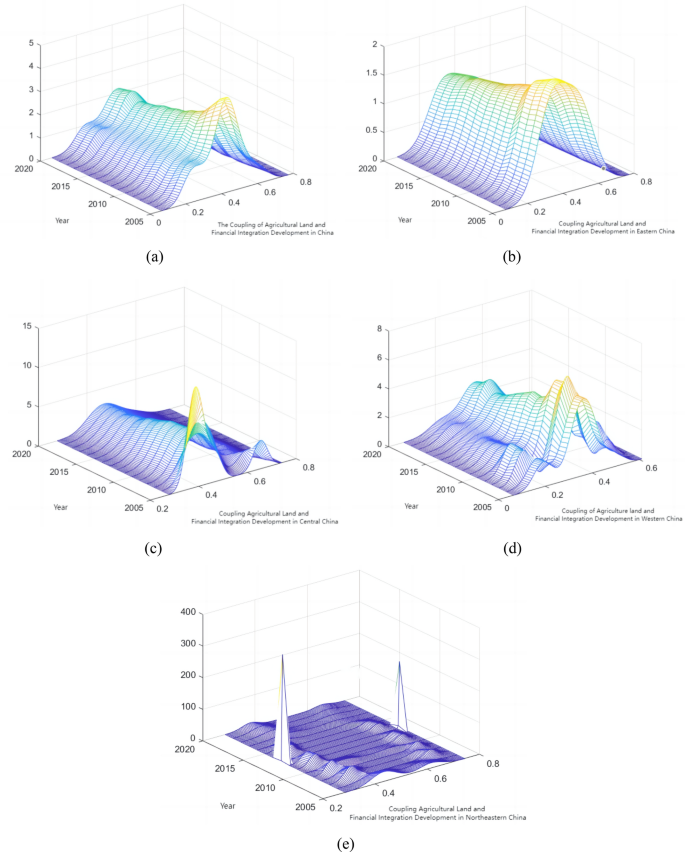
To overcome the influence of uncertainty of unknown parameters, as well as to clarify the total distribution and change trend of the coupled development of agricultural land management and rural finance in different regions and time periods in China, this paper further uses the kernel density estimation method to depicts the shape and dynamic evolution law of the absolute difference distribution of the coupled development of the two systems, as shown in Fig. 12.
The combined growth of rural finance and agricultural land management in China is depicted through a dynamic kernel density distribution. As illustrated in Fig. 12a: first, the major peak of the distribution curve shifts consistently to the right, indicating an overall increase in the nation’s level of combined agricultural land and financial development. Second, the initial decline and subsequent rise in the primary peak’s height suggest that China’s regional imbalance in the coupled growth of rural finance and agricultural land management often experiences a tendency of minor increase followed by a drop. Thirdly, it exhibits a ‘single main peak with side peaks’ trend, indicating a polarization phenomenon in the development of rural finance and agricultural land management. Over time, the two sides of the wave peaks progressively converge to the average level, suggesting a gradual improvement in the regional disparities in the development of these two fields.
The dynamic distribution of the kernel density of coupled development of agricultural land management and rural finance in the east is shown in Fig. 12b. From this figure, it can be observed that: first, the primary peak of the horizontal distribution curve consistently shifts to the right, demonstrating a progressive rise in the eastern region’s degree of linked farming and financial growth. Second, the primary peak’s height steadily declines over time, suggesting that the eastern area of China is experiencing a growing overall regional imbalance in the coupled growth of agricultural management and rural finance. Third, there is only one peak seen throughout the sample inspection time, indicating the absence of polarization.
Dynamic kernel density distribution in the combined growth of rural finance and agricultural land management in central China is illustrated in Fig. 12c: first, the primary peak of the coupling level distribution curve shifts entirely to the right, indicating a progressive rise in the center region’s degree of linked financing and agricultural land development. Second, there is a noticeable downward tendency in the height of the major peak, suggesting that the regional imbalance in coupling development is progressively increasing. Thirdly, the movement of the wave peak from a double peak to a single peak—from a “single main peak and right peak” to a “single main peak”, indicates that the polarization phenomenon is waning with time. Fourth, there are varying degrees of narrowing of the gap between the average level of coupled development of the two systems in the central region and the lagging areas, as indicated by the right trailing phenomenon of the coupled development of agricultural land management and rural finance, which gradually converges over time.
The dynamic distribution of kernel density of coupled development of agricultural land management and rural finance in the west is presented in Fig. 12d. Here, it can be seen that: first, the coupling level distribution curve’s primary peak shifts to the right overall, showing that the level of linked land and finance development in the west is continuously increasing. Second, the primary peak’s height first declines and then rises, suggesting that the western region’s regional imbalance in the coupled growth of rural finance and agricultural land management typically first declines and then slightly grows. Thirdly, the case of a ‘single main peak with side peaks’ is described; the left peak’s height is less than the main peak’s, suggesting a polarization phenomenon in the western region’s growth of rural finance and agricultural land management. The shifted double peaks to the right show an improvement in the degree of development of the two systems’ connection in the western area.
The dynamic distribution of kernel density of coupled development of farmland management and rural finance in Northeast China is shown in Fig. 12e: first, the main peak of the distribution curve of the coupling level shifts to the right as a whole, demonstrating that the level of the coupled development of farmland and finance in the Northeast has been increasing. Secondly, during the observation period, the existence of two main peaks in the Northeast region indicates a serious polarization phenomenon. Specifically, the growth rate of the coupling level of agricultural land management and rural financial development in Heilongjiang is much higher than that of Jilin and Heilongjiang, and the gap is increasing year by year.
Decomposition of spatial effects of the coupled development of farmland management and rural finance in China
Global spatial autocorrelation
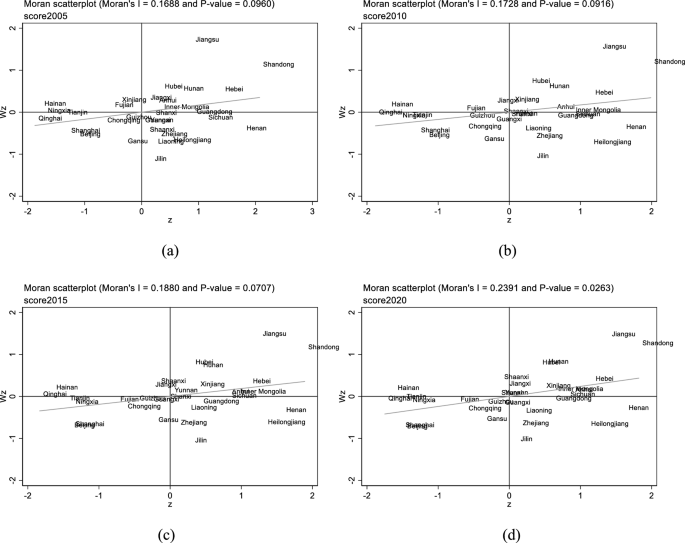
The Moran index is calculated to examine the spatial correlation between the levels of agricultural land and financial integration development each year. Table 5 shows that the global Moran indexes of the measured indexes of agricultural land and financial integration from 2005 to 2020 are all positive. The Z-value and P-value of these global Moran indexes further indicate, at the 10% level of significance, the presence of overall spatial autocorrelation in the development of agricultural land and finance integration among China’s provinces and municipalities. This suggests the existence of inter-regional agglomeration in the integration development of agricultural land and finance.
Local spatial autocorrelation
In order to further explore the spatial pattern of the level of development of agricultural land and financial integration, here it is utilized the local Moran index for measurement. The analysis focused on four selected years, spaced at intervals between 2005 and 2020. The regional distribution of the local Moran index for the integration of agricultural land and financial development is presented in Fig. 13. The four quadrants in the table represent distinct spatial autocorrelation patterns.
As can be seen from Fig. 13, spatial agglomeration and heterogeneity characterize the development level of agricultural land and financial integration in China. Most regions fall into the first and third quadrants, signifying a dominance of high-high and low-low agglomeration, respectively. This pattern underscores a notable polarization. Predominantly, provinces in the first quadrant are situated in eastern and central China, while those in the third quadrant are mainly in the western region.
Provinces such as Hebei, Jiangsu, Anhui, Shandong, Henan, and Hubei exhibit higher levels of agricultural land and financial integration. Neighboring provinces also demonstrate elevated levels of coupled development, characterized by a high–high (H–H) agglomeration effect. This suggests a substantial influx of agricultural production factors and related funds into these areas, positioning them at the forefront of agricultural land and financial integration in neighboring provinces. This shift indicates a decline in the level of agricultural land and financial integration in Jilin, contrasting with higher levels in surrounding regions. This aligns with the earlier conclusion that the average coupled coordination value of farmland management and rural finance in Jilin is lower than the Northeast region’s average from 2005 to 2020, with the disparity expanding annually. A significant factor is Heilongjiang’s status as a leading grain-producing province with over 130 million mu of land transfers and advanced agricultural mechanization, propelling the development of large-scale farmland operations at a pace surpassing other Northeastern provinces. Fujian’s transition from Quadrant 3 in 2005 to Quadrant 2 in 2010 signifies that while the level of farmland-finance integration in neighboring areas has improved, Fujian’s own level of integration remains relatively low. This shift reflects a dynamic interplay of regional development levels within the context of agricultural land and financial integration in China.
Source link

