The impact of environmental regulation on green investment efficiency of thermal power enterprises in China-based on a three-stage exogenous variable model
Data description
This paper selects data from 30 listed thermal power companies in China from 2018 to 2022. The selection is based on thermal power listed companies that are ranked among the top 30 in market capitalization on the Flush Financial Data Platform as of the end of 2022 and have been listed for more than five years. The abbreviations of the sample companies are in “Appendix A”. Since the green investment path of listed thermal power companies is not unique, different companies illustrate differentiated transformation by combining their own advantages.
Studies vary in their division of green investments. According to the green financial products invested, they can be divided into green credit, green securities, and green insurance42. According to the use of green investment project funds, they can be divided into expenditures for environmental pollution control and expenditures for environmental infrastructure construction43. As the research object of this paper is thermal power listed enterprises, power generation projects are the key aspects of their main business and green investments. Therefore, this paper classifies the green investments of enterprises into three types according to the energy type of the project by analyzing the important ongoing projects of thermal power enterprises: the transformation of thermal power units, photovoltaic projects and wind power projects (Table 1).
A new energy project is a national key support project that can effectively reduce the carbon emissions of enterprises. From the viewpoint of power generation cost, the cost of photovoltaic power generation has been reduced to parity and even lower than the cost of thermal power. From the viewpoint of geographical adaptability, wind power projects can be built in cities, suburbs, villages, and coastal areas with strong geographical adaptability. However, the instability of a wind project determines that thermal power units need to be used as a peaking power source to ensure stable operation of the grid. A new energy project construction cycle is longer, and it is difficult to achieve results in the short term. Therefore, thermal power companies still carry out thermal power unit renovation to maintain their stable operation.
Among the enterprises in the sample of this study, there are 25, 18, and 11 carrying out thermal power unit renovation, Photovoltaic projects, and wind power projects, respectively. There are 5 enterprises carrying out all three types of projects at the same time. Finally, 13 enterprises carry out both types of projects at the same time.
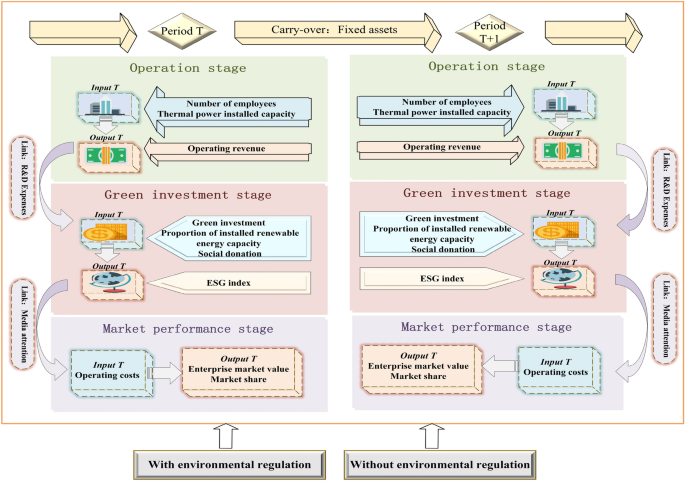
This study evaluates the number of employees, installed thermal power capacity, operating revenue, R&D expenses, green investment, proportion of installed renewable energy capacity, social donations, ESG index, media attention, operating costs, enterprise market value, market share, fixed assets, and environmental regulation of the sample companies from 2018 to 2022. Among them, Min–Max normalization is performed on the raw data of the proportion of installed renewable energy capacity and market share. The research framework based on the three-stage parallel DEA model with relevant indicators is given in Fig. 2.
The main design ideas of the three-stage DEA model in this paper are as follows. First, the process of assessing the green investment efficiency of thermal power enterprises is divided into operation stage (Stage 1), green investment stage (Stage 2), and market performance stage (Stage 3). The first stage is operation. Thermal power enterprises through the normal operation and profitability in this stage lay a good foundation for subsequent green investment. Thermal power installed capacity and the number of employees is mainly selected as inputs, and operating revenue and R&D expenses are outputs. The R&D expenses are continuously invested into the second stage as supportive funds for green investment.
Second, the second stage is green investment. Green investment, the proportion of installed renewable energy capacity, and social donations are taken as inputs. The ESG index and media attention are taken as outputs.
Finally, the third stage is market performance. Media attention is used as an input in the third stage to characterize its important role in a firm’s market performance. Operating costs are an input. Market value and market share are outputs. The T and T + 1 stages are connected through the carry-over variable of fixed assets. Table 2 below specifically explains each indicator.
Descriptive statistics
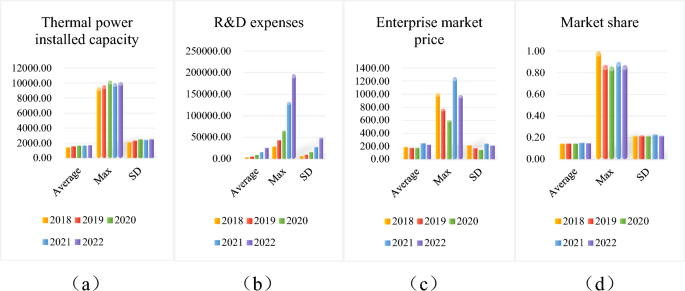
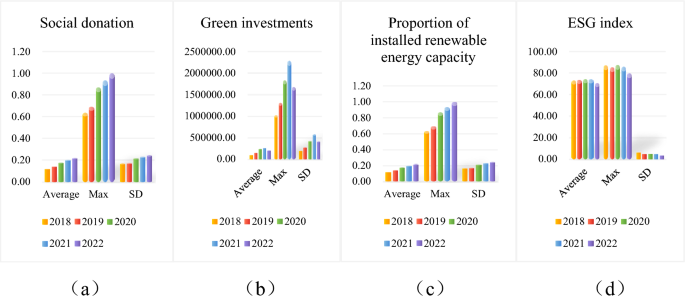
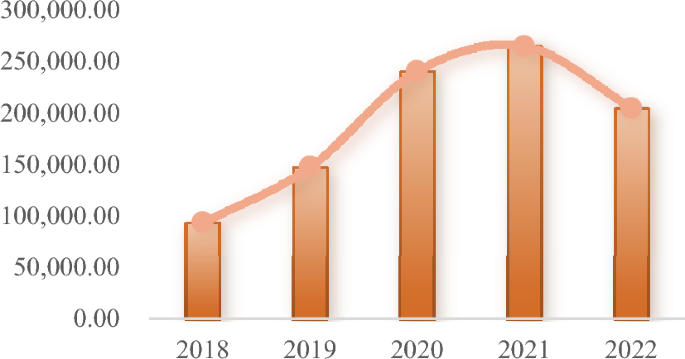
Due to space limitation, only major variables are selected for statistical description in this paper. Green investment stage is a key turning point for thermal power enterprises to achieve sustainable development and plays an important role in the steady operation of enterprises. Therefore, the selected indicators are categorized into two types for statistical description herein: operation and market indicators and sustainability indicators. Their mean, maximum, and standard deviation are calculated respectively, and the results are rounded to two decimal places. Figures 3 and 4 show the statistical description of the two categories of variables by year.
In terms of the operation and market performance of thermal power enterprises, their installed capacity (Fig. 3a) has been relatively stable in recent years. R&D expenses (Fig. 3b) have increased year by year, and the growth rate is also increasing year by year. By raising R&D expenses, thermal power enterprises can carry out technological innovation to develop new products or new energy technologies, thus improving their production and operational efficiency. In addition, although the market value of enterprises (Fig. 3c) has obvious fluctuations, the market share (Fig. 3d) is generally stable and does not show large changes.
Looking at the sustainability of thermal power firms, first, social donation (Fig. 4a) is far more volatile than the other variables, with 2019 leading the five-year period in terms of this factor. Second, green investment (Fig. 4b), which had been trending upward in the previous four years, suddenly declined in 2022, possibly due to increased environmental regulations. Finally, the steady growth trend in the proportion of installed renewable energy capacity (Fig. 4c) and the high level of the ESG index (Fig. 4d) reflect that companies are actively pursuing a green and low-carbon transition.
Empirical result analysis
Total efficiency analysis
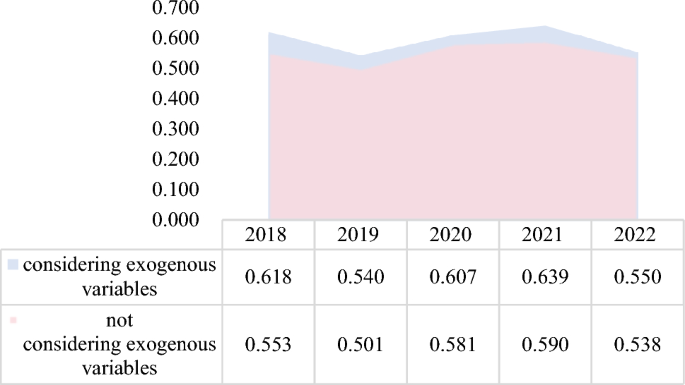
This study considers the inclusion of exogenous variables and the absence of exogenous variables separately when assessing each DMU. According to the empirical results of this paper, after adding exogenous variables, the green investment efficiencies of 24 out of 30 firms significantly improve. Without considering exogenous factors, the average value of the overall efficiency of enterprises is 0.553, and 10 enterprises have total efficiency greater than 0.6. After considering exogenous factors, the mean value of overall efficiency is 0.591, and 13 thermal power enterprises have total efficiency greater than 0.6. Obviously, environmental regulation as an exogenous variable in the model significantly improves the underestimation of enterprises’ green investment efficiency.
As can be seen from Fig. 5, the green investment efficiency of thermal power enterprises was at its lowest in 2019 at 0.501 and hit its peak in 2021 at 0.590. The overall trend is that it first declines, then improves, and finally declines again. In 2018–2019, at the beginning of the strengthening of environmental regulations, the increased cost of thermal power enterprises for pollution control had a crowding out effect on innovation investment. This also led to a decline in the green investment efficiency of thermal power enterprises, from 0.553 to 0.501. With the implementation of environmental policies, enterprises are forced to develop cleaner and more environmentally friendly production methods due to pressure from the environmental tax burden. For example, the renovation of thermal power units and the development of new energy projects spurred the green investment efficiency of enterprises to increase by 8.9% in two years. However, as the proportion of new energy connected to the grid increases, the power system is not flexible enough, and the problem of consumption gradually emerges. The green investment efficiency of enterprises thus exhibits a significant decrease.
Of the 24 thermal power companies that have improved after adhering to the environmental regulation, 18 companies are carrying out retrofitting of thermal power units and 15 are carrying out photovoltaic projects. Relatively fewer firms, less than half, are targeting the construction of wind power projects. Among the top 10 enterprises with the strongest improvement effect, 80% of them have carried out thermal power unit renovation. Obviously, enterprises prefer to realize the improvement of their green investment efficiency by retrofitting thermal power units. On the one hand, retrofitting thermal power units is flexible and has a low cost compared to new energy construction. Thermal power units can operate stably for a long period of time and adjust their output according to power demand. On the other hand, photovoltaic projects and wind power projects have strong volatility, homogeneity and require flexible resource packages to solve the consumption problem. In the case of a significant increase in electricity load, wind and solar clean resources are difficult to provide enough controllable power.
In China there are still provinces with a significant problem of abandoned wind or abandoned light. They include Inner Mongolia, Qinghai, Gansu, and other wind power provinces. Some areas of wind power or photovoltaic power only have a utilization rate of 90%. Therefore, compared with Photovoltaic projects and wind power projects, companies can more feasibly improve their total efficiency through the renovation of thermal power units.
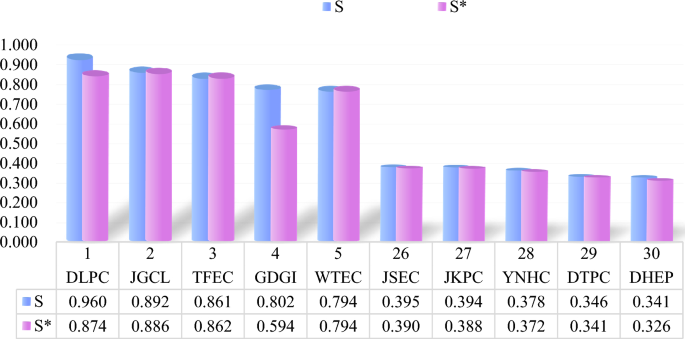
By comparing the green investment efficiency of the top 5 and bottom 5 thermal power enterprises, this paper finds that efficiency significantly improves after considering exogenous variables. As seen from Fig. 6, the green investment efficiency value of each thermal power enterprise varies greatly. Among them, DHEP has the lowest green investment efficiency value of 0.341, which is only 1% higher than the case without considering environmental regulation. DLPC has the highest efficiency value of 0.960, which is an increase of nearly 10% over the case without taking into account exogenous factors. The improvement is significant. Therefore, the impact of environmental regulations on DLPC is much greater than that on DHEP. This may be due to the fact that DHEP is higher than DLPC in terms of enterprise size, capital cost, and technical feasibility. Its investment in green innovation has already reached a high level, and so the improvement rate is not as high as DLPC. In addition, DHEP’s fuel costs increased by U$$2.953 billion year-over-year in 2021 due to the increase in the unit price of standard coal used for power generation. The significant increase in operating costs leads to a company’s lower gross margin and continued losses. In turn, the focus on green investments continues to diminish, and the efficiency of green investments is bound to decrease.
In terms of the magnitude of improvement, the impact of environmental regulation on GDGI ranks first among the sample firms, with a 20.8% improvement in green investment efficiency. On the one hand, GDGI’s earnings continue to be high, and there is enough capital to build on green investments. On the other hand, environmental regulations have been strengthened, and significant results have been achieved in green investments. Therefore, a company can decide to continue to invest in green investments in the future and continue to invest in research and development. From thermal power generation to multiple energy sources, GDGI has always adhered to the direction of clean energy development. The improvement of its green investment efficiency is also an inevitable trend.
In conclusion, environmental regulations have a more significant impact on the green investment efficiency of Chinese thermal power companies. During the period from 2018 to 2022, the average value of the environmental tax burden paid by enterprises is generally increasing. Environmental regulations force thermal power enterprises to improve their production and operation methods by increasing their environmental management costs. Moreover, thermal power enterprises combine their own advantages to carry out green transformation of industrial structure. While realizing green and high-quality development, they also promote the improvement of green investment efficiency.
Stage efficiency analysis
Efficiency analysis of operation stage (Stage 1)
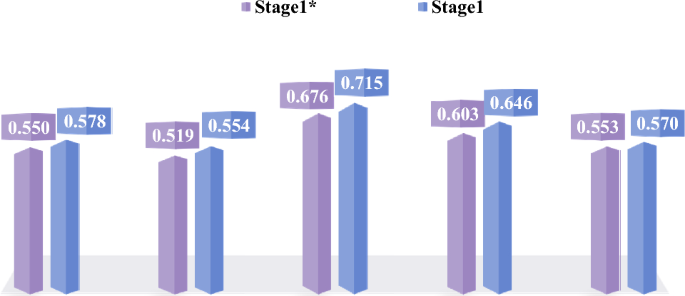
In the operation stage, this study includes the number of employees, installed thermal power capacity, and operating revenue in the input–output index system of this stage. According to the empirical results of this paper, during the period from 2018 to 2022 the efficiency of thermal power enterprises in the operation stage performs well with an overall mean value of 0.613. However, there are still some enterprises with low efficiency in this stage, such as DTPC, whose efficiency value fluctuates around 0.2 or less than one-third of the average value.
As seen from Fig. 7, the inclusion of environmental regulation can significantly increase the efficiency of thermal power enterprises in the operation stage. The collection of environmental taxes raises the production costs of highly polluting enterprises, thus promoting the optimal allocation of resources and industrial restructuring. For thermal power enterprises, the collection of environmental taxes pushes them to pay more attention to the development of clean energy and to increase investment in renewable energy. By optimizing the industrial structure, the energy efficiency of thermal power enterprises will improve. In response to the role of exogenous variables in this stage, BNEC is most strongly affected, mainly because BNEC is driven by environmental regulations and focuses on the level of cost optimization and energy savings. It is a commitment to operational efficiency improvement whose improvement effect is as high as 0.462 in 2019.
After 2020 in the late period of strengthening environmental regulations, the operational efficiency of thermal power enterprises has significantly weakened. The average efficiency fell by 14.5% in two years, perhaps due to the need for thermal power companies to invest more resources and funds in technology upgrades in order to meet more stringent environmental requirements. Therefore, for improving energy efficiency and reducing pollutant emissions, there will be some technical or economic restrictions that result in the decline of efficiency at this stage. In summary, environmental regulations can, to some extent, lead to higher efficiency values by inducing improvements in energy use efficiency and reductions in pollutant emissions during the operational stage of an enterprise. However, with increased pressure on profitability, thermal power companies may encounter some constraints in this regard, leading to a slowdown or decline in the rate of improvement of efficiency values.
Efficiency analysis of green investment stage (Stage 2)
The green investment stage is an indispensable part of thermal power enterprises to realize sustainable development. This study includes green investment, the proportion of installed renewable energy capacity, social donations, and the ESG index into the input–output index system of this stage. Table 3 shows the efficiency value of green investment stage of thermal power enterprises selected by this paper with more typical performance in this stage.
The inclusion of environmental regulations has somewhat increased the efficiency value of the green investment stage of thermal power companies during the period from 2018 to 2022. This may be due to the fact that environmental regulation incentivizes firms to approach the green investment business in a more prudent and proactive manner, which in turn promotes green investment efficiency. However, nearly one-third of the thermal power firms, such as HDEC and TFEC (Table 3), have reached the optimal efficiency value before the addition of the exogenous variables, and thus there is no significant improvement.
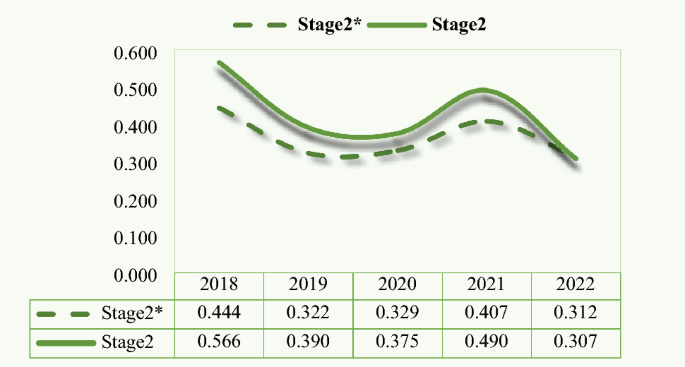
With the increase of environmental regulation pressure, the efficiency value of thermal power companies in the green investment stage shows a large decline. It falls from 0.566 in 2018 to 0.307 in 2022 or a drop of 25.9% (Fig. 8). Even though there is a slight rebound during the period, it again shows a more substantial fall in the following year. This is mainly due to the thermal power enterprises in the process of accelerating the development and utilization of clean energy illustrating that new energy generation will have difficulties in sending out and consuming. The wind turbines and photovoltaic equipment in many areas have been left idle for a long time.
The phenomenon of abandoning light and wind is serious. Moreover, supply chain issues and downward economic pressure due to COVID-19 could have also hindered green investments by thermal power companies between 2021 and 2022. However, some companies have bucked the trend. For example, GEPC’s green investment stage efficiency grew from 0.047 to 0.112, or an improvement of nearly three times.
Compared with the other two stages, the green investment stage has the lowest average efficiency value, between 0.3 and 0.6, and the largest difference in efficiency between enterprises. This is reflected in the serious bifurcation of the efficiency values of the sample enterprises in this stage. The difference between high-efficiency and low-efficiency enterprises is even close to 100%, which is also directly linked to the green investment focus of thermal power companies. Retrofitting thermal power units not only has greater potential and lower investment costs, but also smoothes out the impact of new energy power on the grid.
Thermal power units have a stronger role in improving the efficiency of the green investment stage. For example, JGCL’s green investment projects during this five-year period were dominated by the renovation of thermal power units and supplemented by the construction of new energy projects (Table 3). Thus, JGCL has always maintained a high level of efficiency in the green investment stage. By contrast, HDPC focuses on the construction of new energy projects, such as photovoltaic projects and wind power projects. Therefore, its efficiency in this stage is lower (Table 3).
Efficiency analysis of market performance stage (Stage 3)
Thermal power firms have the highest efficiency values in the market performance stage compared to the efficiency values in the other two stages. There is also not much difference in the efficiency values among the firms. Except for a few firms such as JNPC, NMHD, and SNPC, most of the other firms have efficiency values fluctuating around 0.7 in this stage. At this stage, the inclusion of environmental regulations had a relatively small effect on improving efficiency, with most firms improving by less than 5%. Overall, the market performance stage efficiency increased year-on-year with the strengthening of environmental regulations and rose much higher than the operational stage (Fig. 9). The unusual performance in 2018 was due to the multiple adjustments in the domestic refined petroleum product market along with the increase in coal prices during the year. They had a dampening effect on the efficiency of most thermal power companies, especially JGCL, in the market performance stage.
The collection of environmental taxes will prompt thermal power enterprises to increase their investment in and development of clean energy. Thus, it will guide enterprises toward restructuring, transformation, and upgrading. For example, GDGI has not only raised its R&D investment year by year, but also continued to increase mergers and acquisitions of high-quality assets and clean energy to optimize its industrial layout.
There are some firms that are not sensitive to environmental regulation. For example, DTPC and HNPC, whose efficiency values in the market performance stage did not improve more significantly from the environmental tax burden (Table 4). The pressure of environmental regulations burden increases the cost of highly polluting and inefficient thermal power firms. For firms adopting clean energy and high efficiency technologies, their costs will be relatively lower. This leads to the exit of inefficient thermal power firms from the market. In turn, high-efficiency firms have the opportunity to expand their market share and increase their efficiency value in the market performance stage.
Sub-index efficiency analysis
Due to space limitations, only the main indicators are selected for sub-indicator efficiency analysis in this paper. Table 5 reflects the average values of the efficiency of the main indicators of Chinese thermal power enterprises from 2018 to 2022 with and without considering exogenous variables.
First, the efficiency of installed thermal power capacity directly affects the power generation capacity and capacity level of the enterprise. Hence, it is an important factor for thermal power enterprises to maintain normal business management. After considering the exogenous variable of environmental regulation, the average value of thermal power firms’ installed capacity efficiency increases in most years and peaks at 0.730 in 2020 (Table 5). A few firms are insensitive to the role of environmental regulation, such as JKPC and JNPC. Most companies show a very clustered thermal power installed capacity efficiency of 0.5 or more from 2018 to 2022. For highly polluting and inefficient thermal power units, environmental regulation will increase the operating costs of thermal power enterprises. Therefore, companies will actively adopt energy saving and emission reduction measures and emphasize technological innovation, such as vigorously renovating thermal power units and developing clean energy projects. For example, SNCL has invested in a number of hydrogen energy projects, driven by environmental regulation.
Second, enterprises’ market value efficiency stays at a high level from 2018 to 2021, yet declines substantially in 2022, as in the case of AHWC and GEPC. The inclusion of environmental regulations improves the average market value efficiency of thermal power firms in all years except 2022. In particular, in 2018 the average market value efficiency improves by as much as 15.9%. Environmental regulations can incentivize firms to adopt more environmental protection measures to reduce pollutant emissions, such as ultra-low emissions and desulfurization and denitrification technologies. However, in the late stage of environmental regulation strengthening, the obstruction of new energy construction and excessive cost burden can inhibit the market value efficiency of enterprises. Their average value of efficiency decreases by two-thirds from 0.931 in 2018 to 0.619 in 2022 (Table 5). For example, in 2018 to 2021, DTPC and DLPC have reached the optimal point of their enterprises’ market value indicator efficiency in yearly increments under the pressure of the environmental regulation. In 2022, however, excessive cost burdens led to a significant decline in firm market efficiency, or far less than half of what it was in 2021.
Third, with the strengthening of environmental regulations, the average green investment efficiency value of thermal power enterprises has been declining in fluctuation over the five-year period. The average green investment efficiency value is the highest in 2018 at 0.595, while 2022 has the lowest efficiency at 0.274 or less than half of that in 2018 (Table 5). Green investment efficiency rebounds considerably in 2021, but then deteriorates sharply in the following year, going from 54.2 to 27.4%. SEPC and GDGI have seen a typical plunge in the efficiency of their green investments, with a decline of almost 100%. This is mainly due to the fact that companies pay more attention to compliance in order to avoid being fined or facing other legal risks. This ultimately results in companies not being able to fully utilize the benefits of green investment.
After adding exogenous variables, the average green investment efficiency of the 30 thermal power companies has improved in the previous four years. Especially for BNEC, the addition of environmental regulation directly doubles its efficiency value several times to reach optimal efficiency. During this period, the average social donation efficiency value has fluctuated slightly, but overall, it is still slowly decreasing. The average social donation efficiency value in 2018 ranked first among the five years at 0.520 (Table 5). It is worth noting that both green investment efficiency and social donation efficiency of thermal power enterprises are bifurcated. High-efficiency enterprises, such as DLPC and HDEC, achieve an optimal efficiency of 1 for both green investment efficiency and social donation efficiency. However, more than half of the enterprises have both efficiencies of almost 0. This phenomenon may relate more to the enterprises’ view of social responsibility and their own operation situation.
Finally, the ESG index efficiency of most thermal power companies is decreasing year by year, from 0.907 to 0.486. This is mainly due to the fact that companies will reduce the financial pressure from an environmental tax burden by lowering environmental protection investment, which leads to the inability to fully utilize the benefits of ESG index efficiency. In the first two years, the inclusion of exogenous variables can improve the average ESG index efficiency of thermal power enterprises. However, in the latter three years, environmental regulation shows an inhibitory effect on it, and the inhibitory impact increases year by year. In 2022 the inhibitory effect of environmental regulations on the ESG index efficiency of thermal power companies hit 22.8%. This causes the average ESG index efficiency of firms to fall from 0.714 to 0.486 (Table 5). However, there are also firms that show an abnormal rise. For example, CEPC’s ESG index efficiency has been positively affected by environmental regulation with a small increase in efficiency values.
Regression analysis
$$ Green\;investment_{it} = \alpha_{0} + \alpha_{1} Environmental\;regulation_{it} + \gamma_{t} + \varepsilon_{it} $$
(8)
where i denotes the individual company, t denotes the year, \({Green investment}_{it}\) denotes the amount of green investment of the thermal power enterprise, \({Environmental\; regulation}_{it}\) denotes the environmental tax burden paid by the thermal power enterprise, \({\gamma }_{t}\) denotes the time fixed effect, and \({\varepsilon }_{it}\) is the random perturbation term.
In order to further verify the impact of environmental regulation on green investment, this paper carries out a benchmark regression for formula (8). The regression results show that environmental regulation is significantly positive at the 1% level, indicating that environmental regulation can promote the green investment of thermal power enterprises. On the one hand, under the pressure of environmental regulation, thermal power enterprises will actively make green investment for tax incentives. On the other hand, environmental regulation will increase the cost pressure on thermal power enterprises, which will encourage them to make green investment to reduce their pollutant emissions. This result further confirms the accuracy of the above DEA model evaluation (Table 6).
Source link

