
As the United States faces an uncertain economic future, recyclers in Maryland are focusing on the positives.
Economic resilience was a big theme for the Maryland Recycling Network’s annual conference, held on Tuesday in Baltimore and organized in partnership with the Solid Waste Association of North America’s Mid-Atlantic chapter.
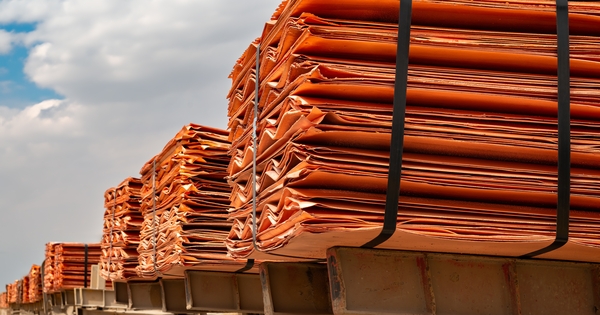
Concerns over tariffs, trade wars and rising gas prices have cast a shadow over the U.S. economy, as well as Maryland’s local economy, said Daraius Irani, vice president of business and public engagement at Towson University. Yet speakers also touted newer state laws meant to help boost recycling rates, as well as benefits from recovering commodity prices and Maryand’s geographic access to a range of end markets.
“Times are tough, so only the strong survive,” said Angela Webb, chief of recycled products and marketing for Maryland Environmental Service, an independent state agency that provides compliance services. “MRFs do have a lot of heavy lifting to do in order to succeed, especially in these markets.”
Recyclers who focus on processing higher-quality grades of commodities and strong business partnerships will be able to weather trying times, she said. Recyclers can also take advantage of certain regional trends to seek pockets of stability amid the storm, she added.
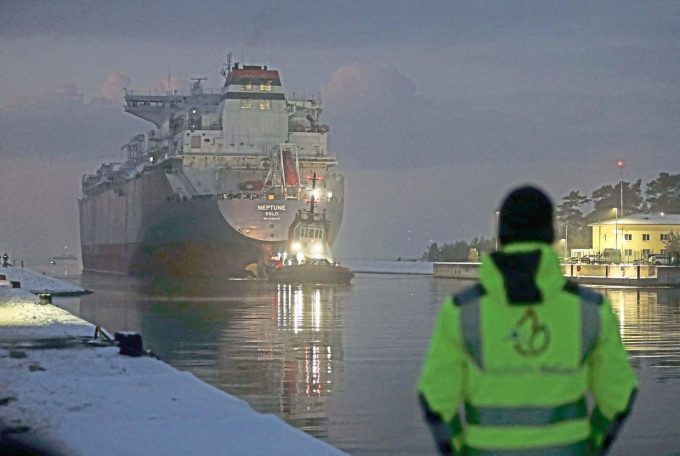
Maryland’s geographic location, for example, allows recyclers to access “multiple, diverse end markets,” including via the ports of Baltimore, New York and Norfolk, Virginia. There’s also the Virginia Inland Port in Front Royal, a container transfer facility.
“We have the ability to ship to any of these pretty easily. That makes Maryland a really good spot to be able to divert as much as we can from our landfills,” said Webb.
Maryland’s location is also “one of the reasons we can get very good prices” for commodities, said Chaz Miller, principal at Note 3 Chaz Miller and Associates, who monitors recycled commodity markets.
The majority of mixed paper and cardboard shipped domestically stays East of the Mississippi River, Webb added, “and that proximity to where we are makes it really appetizing for the mills and makes it so we can receive a $20 to $30 premium. Quality is a big driver of that,” she said.
One commodity that’s giving recyclers in Maryland and across the country grief is PET, which continues to fetch “depressingly sad” prices, Miller said. That’s spurred partly by ongoing imports of cheaper PET resins from overseas and stiff price competition from virgin resins, along with a wave of reclaimer closures.
Markets in the Southwest are seeing slightly higher prices due to demand from buyers in Mexico, Miller said, but he’s also heard that some domestic recycled PET is now making its way to Europe “because it’s cost competitive.”
PET is seeing a slight recovery in price, Webb added, with Northeast regional prices of about one cent a pound in May compared to negative one cent in April.
“I do think the domestic market will eventually recover, but I think it’s going to take some time,” Webb said, noting that recycled content mandates could help. “I also think the export demand is going to continue to grow, because it can, which hopefully will increase the markets going forward.”
One bright spot, Miller said, is that Republic Services is planning to open its third polymer center, in Allentown, Pennsylvania, by the end of the year. That’s good news for the region, Miller said, because the facility is designed to process baled plastics into PET flake. He expects demand for the material will begin to pick up in the fall as Republic tests its equipment.
That comes on the heels of the news that Niagara Bottling will purchase the California assets of rPlanet Earth, an effort to restore operations at one of the reclaimers that closed last year.
Maryland is in the midst of implementing its extended producer responsibility for packaging program, passed in 2025, and recently finalized its first set of EPR regulations. This is expected to influence recycling markets going forward.
EPR has the potential not only help raise state recycling rates, but bring more funding into the state and create more jobs, said Bradley Baker, senior program manager for Maryland Department of the Environment’s Resource Management Program. Maryland’s recycling rate has fallen in recent years from 45% in 2017 to 37.7% in 2024, he said.


Leave a comment