
Bitcoin Cash showed some promise on July 1 as buyers stepped in to keep the price above the important $200 mark. The short-term outlook is slightly more positive, but Bitcoin price struggles and ETF outflows continue to put pressure on the entire altcoin market.
Much depends on whether Bitcoin (BTC) can stay above $60,000. If it does, the rest of the market, including Bitcoin Cash, could gain the confidence to move higher. Still, even after the recent bounce, BCH is trading well below its usual trend.
On Wednesday, Bitcoin Cash traded around $202.70, with daily trading volume rising 44.1% to about $155 million and a market cap of $4.06 billion.
Meanwhile, BCH remains well below its December 2017 peak of $4,355, down about 95.3%. However, it remains well above the December 2018 low of $75.08, which means it has recovered significantly since then.
In the past 24 hours, Bitcoin Cash price traded between $194.30 and $209.34, ending up near $202. Over the past week, it gained 4.3%, but the longer-term numbers are read, down 33% in the last month, 66% for the year so far, and almost 60% over the past year. Ultimately, everything depends on what Bitcoin does next.
Bitcoin Cash Price Tests $210 Resistance While Momentum Improves
On the daily chart, Bitcoin Cash is holding at $202.70, which is still below the 21-day EMA of $209.70. The strong selloff in May and June hurt the technical outlook. Sellers are active near $210, while buyers are supporting the price around $190.
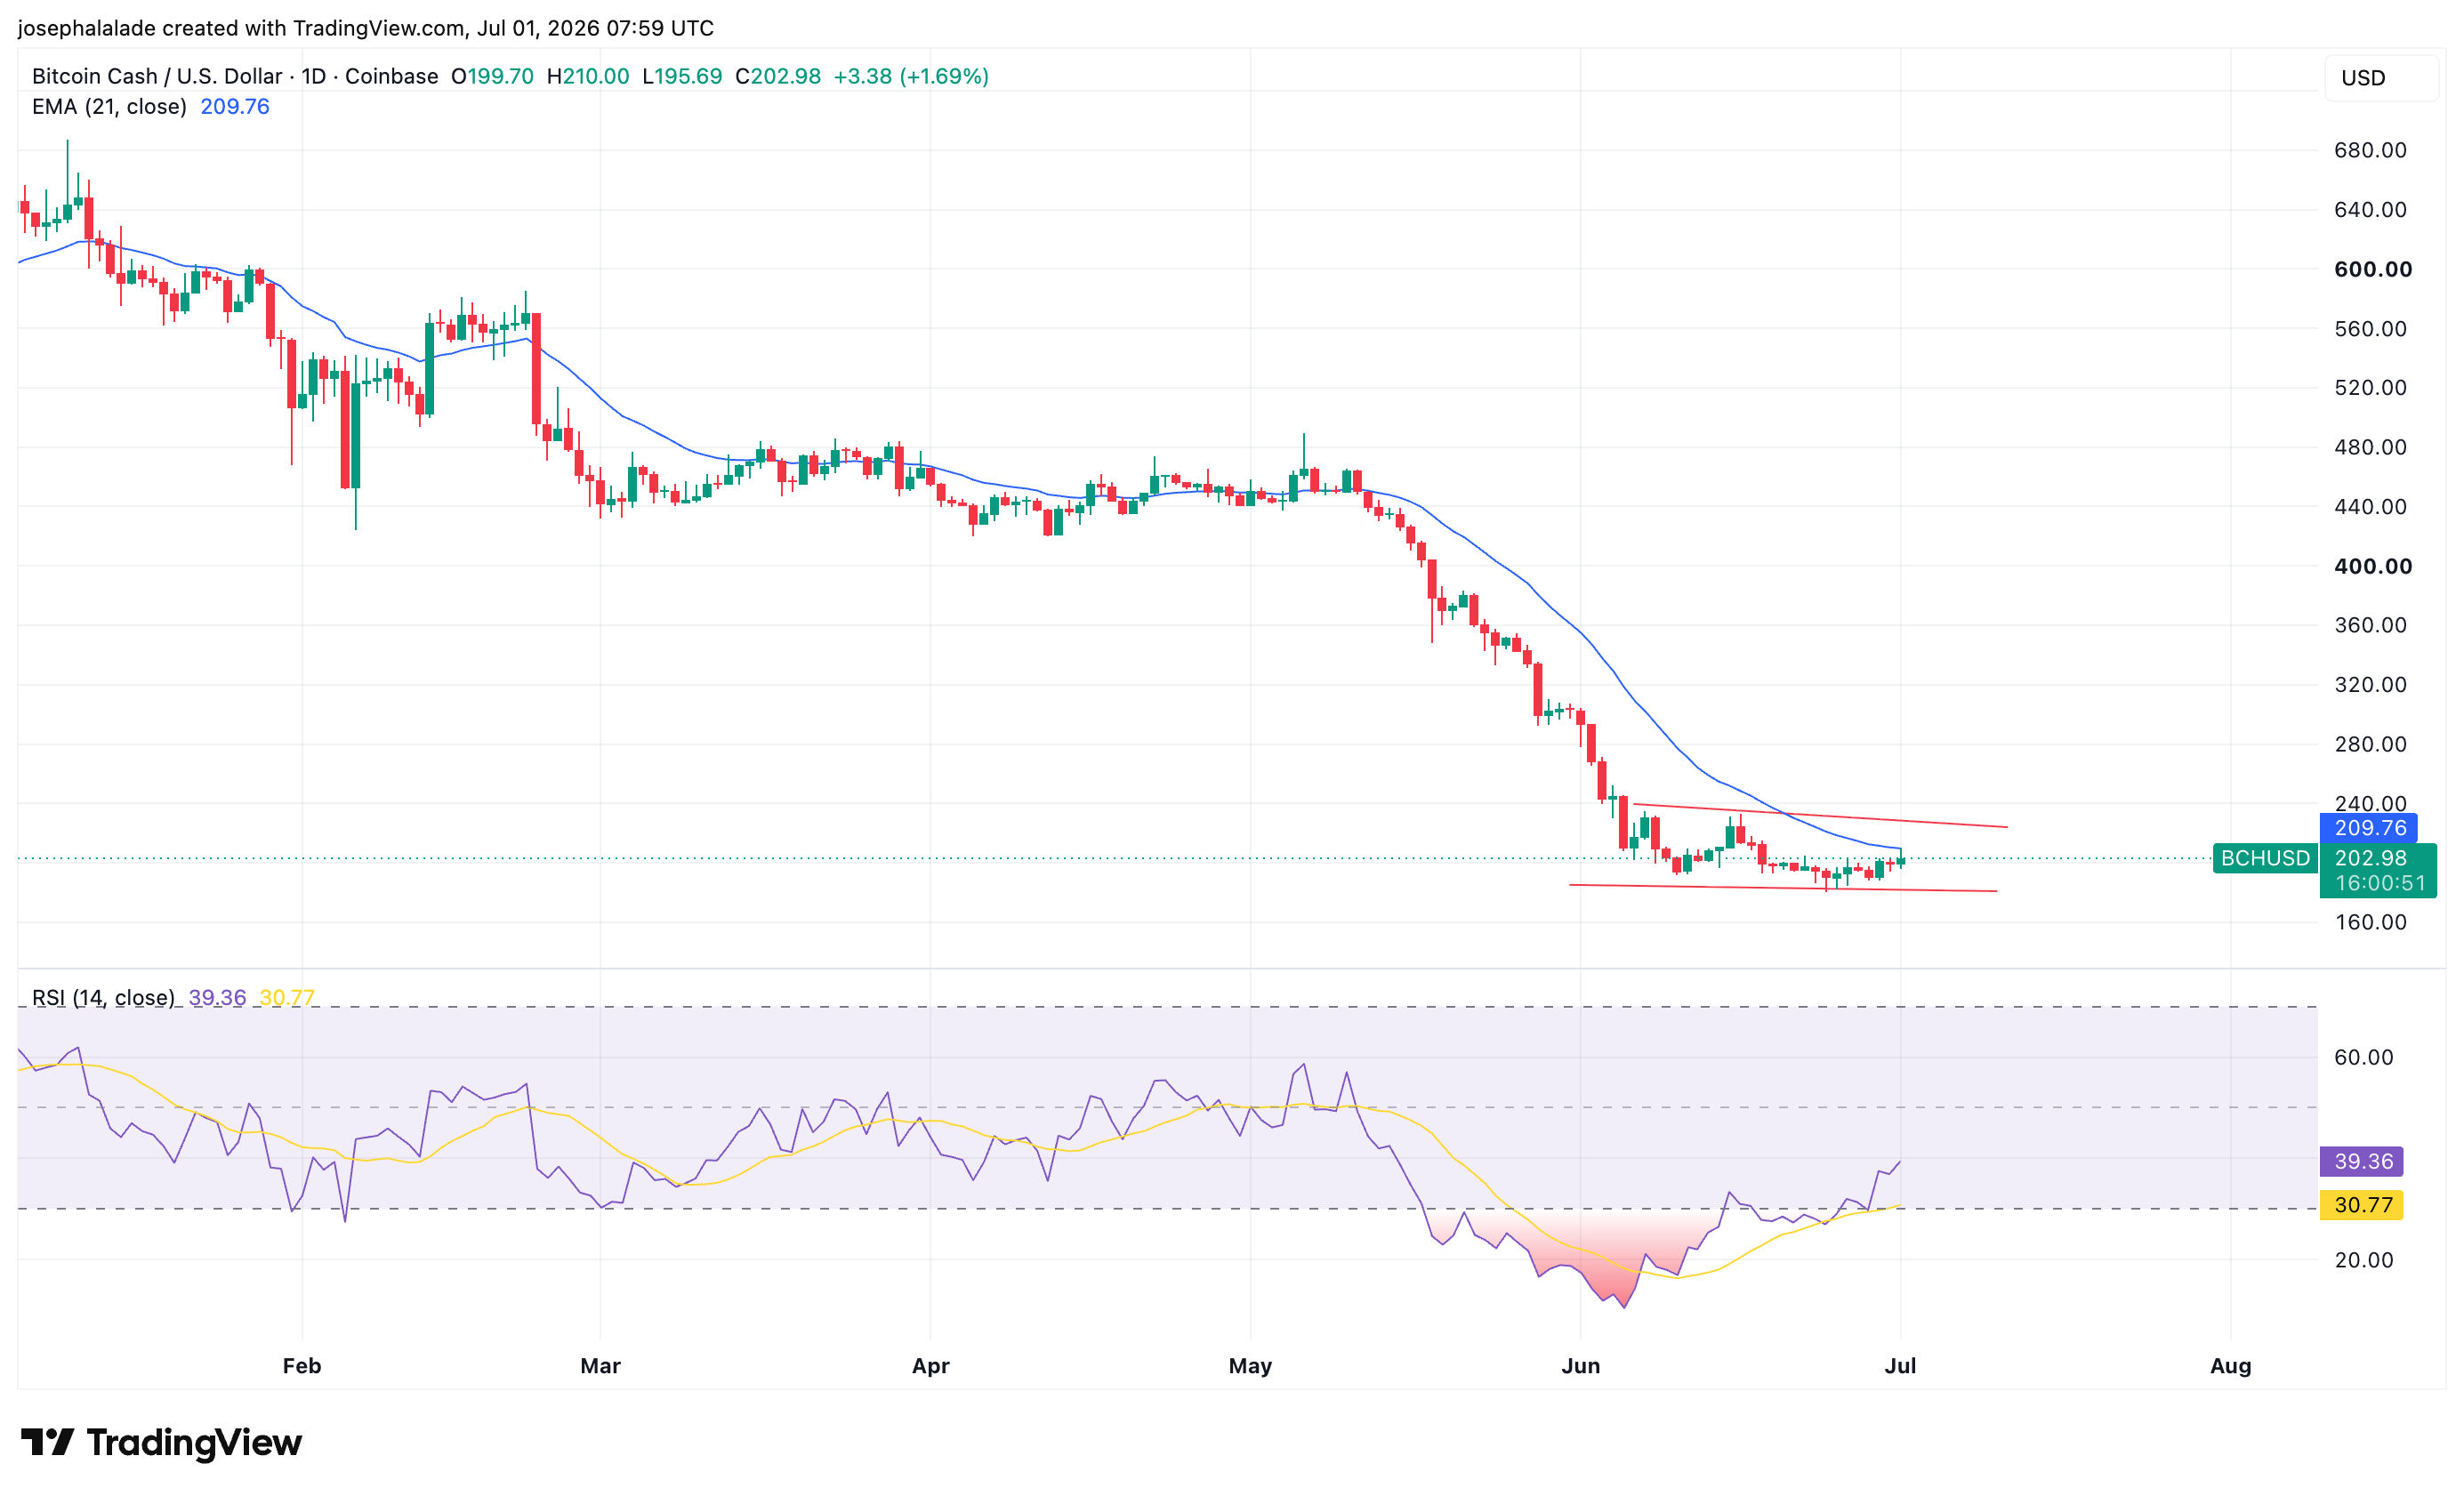
According to Token Talk’s analysis, the previous demand zone at $270-$300 now appears distant following the recent drop. Any rally attempt will likely face selling pressure until BCH moves back into that range. Overall, the outlook remains bearish.
Still, momentum is improving. The RSI jumped from an extremely oversold 11.5 in early June to 38.9, showing that new buyers are entering the market. The ADX, which tracks trend strength, is at 49.5 and starting to drop, but it remains high enough to reflect the recent downtrend.
Short-term moving averages are sending mixed signals. The 10-day EMA ($198.83) and 10-day SMA ($196.11) both suggest buying, but the 20-day EMA ($208.22) still points to selling. Longer-term averages are much higher: the 30-day EMA is $225.48, the 50-day is $262.73, the 100-day is $332.15, and the 200-day is $402.24. All of these act as resistance for now.
The key for Bitcoin Cash price in July is whether it can move above $210. If it does, the recovery could gain momentum. But if it falls below $190, the recovery may stall. Until Bitcoin’s price stabilizes, BCH will likely follow its lead.
READ MORE: Circle Stock Analysis: Is Open USD Really a Threat to USDC?


Leave a comment