
Seasonal patterns in financial markets are among the most misunderstood phenomena in investing. In precious metals specifically, the difference between recognising a genuine seasonal inflection and misidentifying a temporary consolidation as the primary trend can mean the difference between capturing a meaningful rally and entering too early. Understanding the architecture of the gold and silver summer rebound requires not just knowing that a pattern exists, but understanding precisely when within the seasonal window it typically ignites, and what technical conditions need to align beforehand.
When big ASX news breaks, our subscribers know first
The First Half of 2026: Volatility, Correction, and What It Signals
The first six months of 2026 delivered a jarring reminder that even assets in confirmed uptrends can experience sharp, disorienting corrections. Gold endured a drawdown of approximately 10% during an intense sell-off episode, while silver, with its characteristically higher beta, suffered a significantly more severe pullback of approximately 30%. For investors without historical context, these moves can feel like the beginning of a structural reversal.
History tells a different story. Secular bull markets in precious metals have routinely produced corrections of this magnitude, and sometimes far larger, without signalling an end to the primary trend. The critical distinction is between a positioning reset and a trend reversal. A positioning reset occurs when speculative excess is flushed from the market, open interest contracts, and sentiment deteriorates sharply, while the underlying fundamental and macro drivers remain intact. The evidence accumulated through mid-2026 points firmly toward the former.
Summer Doldrums vs. the Summer Rebound: A Crucial Distinction
Seasonal analysis of gold and silver reveals a consistent pattern that repeats across multiple market cycles. Gold’s seasonal low typically forms around mid-June, with silver’s following slightly later around late June. What follows is not always an immediate, sharp recovery. Instead, the sector frequently enters a period of sideways-to-lower price action, often referred to as the summer doldrums for gold and silver, before the genuine rebound gains traction.
The implication for 2026 is significant. The primary rebound phase is more likely to take shape in late July through August, not in early July. In fact, the pattern is consistent with a false new low in early-to-mid July, where prices break marginally below prior support levels before stabilising and reversing higher. Investors who interpret early July weakness as confirmation of a bear trend risk being positioned incorrectly at precisely the wrong moment.
Seasonal analysis consistently shows that precious metals undergo a period of sideways-to-lower drift before a sharp recovery. Investors who confuse the doldrums for the rebound risk premature positioning.
Positive Divergence: The Leading Signal That Miners Are Sending
One of the most reliable leading indicators in the precious metals sector is the divergence between mining equities and the underlying metals they produce. When this divergence is positive, it tends to precede multi-month recoveries with meaningful consistency. Furthermore, understanding undervalued mining stocks during these inflection points can be critical for positioning ahead of the rebound.
How Miner-Metal Divergence Works
A positive divergence in precious metals occurs when mining stocks form a higher low at the same time that gold or silver prices are registering a lower low. The logic behind this indicator relates to the forward-looking nature of equity markets. Mining stocks embed expectations about future metal prices, costs, and margins. When miners refuse to confirm a new low in metals, the market is effectively pricing in a recovery before it appears in spot prices.
Two primary forms of divergence exist in this context:
- Higher low variety: mining equities hold higher lows while gold and silver make new lows. This is the pattern currently evident in mid-2026.
- Higher high variety: mining equities break to new highs before metals confirm, signalling the next major leg of a bull market.
The current setup falls squarely into the first category. Both GDX and GDXJ have formed higher lows against gold and silver’s lower lows, and the same pattern is visible in silver mining equities relative to the silver spot price. This is a textbook configuration for a sector preparing to rebound.
| Divergence Signal | Metals Behaviour | Miner Behaviour | Historical Outcome |
|---|---|---|---|
| Higher Low (Current) | Lower low in gold and silver | Higher low in GDX and GDXJ | Multi-month rebound |
| Higher High | Metals lag new highs | Miners break out first | Sustained bull leg |
| No Divergence | Metals and miners fall together | No separation | Continued downtrend |
Historical Correction Analogs: What Past Gold Breakout Cycles Reveal
Gold has experienced three identifiable major breakouts in modern market history. Each was followed by a meaningful correction before the next impulsive leg higher began. Mapping the current 2026 correction against these prior episodes provides important context for both the expected magnitude and duration of the recovery. In addition, the gold market outlook for 2025 laid important groundwork for understanding how these cycles unfold.
The 1973 vs. 2006 Templates
The 1973 analog represents the most explosive scenario: a sharp, high-magnitude recovery following a significant correction, characterised by a short recovery period and a rapid return to new highs. While this scenario would be the most rewarding outcome for investors, the technical and macro context of 2026 makes it the less probable template.
The 2006 analog is considered the more realistic comparison. In that cycle, gold rebounded from a sharp correction in a more measured, gradual fashion, with a period of consolidation before eventually continuing higher. This template implies a summer rebound with defined upside targets, followed by potential further consolidation before a larger breakout.
Analytical Caution: With only a small number of comparable historical cases, projection precision is inherently limited. The weight of evidence, not any single analog, should guide outlook formation.
Is a Significant Low Now in Place? Reading the Technical Evidence
The False New Low as a Bottoming Mechanism
The most recent low in gold and silver exhibits characteristics consistent with what technicians call a false new low, sometimes referred to as a bear trap. This pattern unfolds in three stages:
- Price breaks below a prior support level, triggering panic selling from investors who interpret the break as confirmation of further downside.
- The breakdown fails to attract sustained follow-through selling, suggesting that genuine supply has been exhausted.
- Price stabilises and reverses, trapping late sellers who acted on the break.
This pattern is entirely consistent with the current price action in both gold and silver. The breakdown in early-to-mid 2026 had all the hallmarks of a bear trap, with price subsequently stabilising rather than accelerating lower. Consequently, gold and silver bounce-back data from comparable historical episodes reinforces the case for a genuine reversal rather than a continuation lower.
Weekly Candlestick Signals: Diminishing Selling Pressure
The weekly candlestick progression in gold tells a compelling story about the evolving balance between buyers and sellers:
- Four weeks prior to the low: an inverted hammer formed, indicating a failed rally attempt but some evidence of buying interest at lower levels.
- Three weeks prior: another inverted hammer, confirming that buyers were still struggling to gain traction.
- The final two weeks: back-to-back bullish hammer formations, a pattern that signals progressively weakening selling pressure and the emergence of genuine demand.
Silver’s weekly chart produced a bullish hammer at the low, though the ideal technical setup would have involved silver testing support near the $52 level before forming this pattern. Despite the less-than-perfect technical setup, the candlestick signal remains constructive.
Breadth Indicators: An Extreme Reading With Historical Precedent
The percentage of GDX component stocks trading above their 200-day moving average fell to approximately 10% during the correction low. This represents an extreme oversold reading with significant historical implications.
Examining comparable breadth readings from the 2002 to 2007 bull market cycle reveals the following:
| Breadth Low Event | Breadth Reading | Time to Major Rally | Interim Pattern |
|---|---|---|---|
| 2002 Cycle Low | ~10% | ~5 months | Rally, then correction |
| Mid-Cycle Correction | ~0% (extreme) | ~12 months | Extended consolidation |
| 2006 to 2007 Setup | ~15% | ~10 months | Rebound, consolidation, breakout |
A critical nuance emerges from this data. An extreme oversold breadth reading reliably portends a rebound, but it does not signal the beginning of an uninterrupted, impulsive bull leg. The historical pattern is rebound, then consolidation, then eventual larger breakout. This distinction has important implications for how investors should position themselves across different time horizons.
Upside Targets: Where Can Gold and Silver Rally?
Gold’s Resistance Architecture
Assuming the rebound thesis plays out, gold faces two meaningful resistance zones on the upside:
- Primary resistance near $4,400: a confluence of the prior rebound peak and a prior support level that has transitioned to resistance.
- Secondary resistance near $4,460: the location of the 200-day moving average, which frequently acts as both a magnet for recovering prices and a ceiling.
From current levels, this implies approximately $300 of potential upside in the summer rebound phase. It is also possible that gold could briefly exceed the primary resistance level before encountering more significant supply near the 200-day moving average.
Silver’s Key Levels and Upside Potential
Silver, trading at approximately $61 at the time of analysis, faces the following resistance structure:
- Initial resistance near $67: a prior structural level on the weekly chart.
- Major resistance at $70: a psychologically and technically significant level visible on both weekly and longer-term charts, representing very stiff resistance.
This implies a potential rally of $6 to $9 toward the high $60s, with $70 representing the upper boundary of the expected rebound range. It is worth noting that $70 silver represents a price level that materially improves the economics of silver explorers, developers, and producers, and has historically been associated with meaningful re-ratings of silver-leveraged equities.
Price Target Summary for the Summer Rebound:
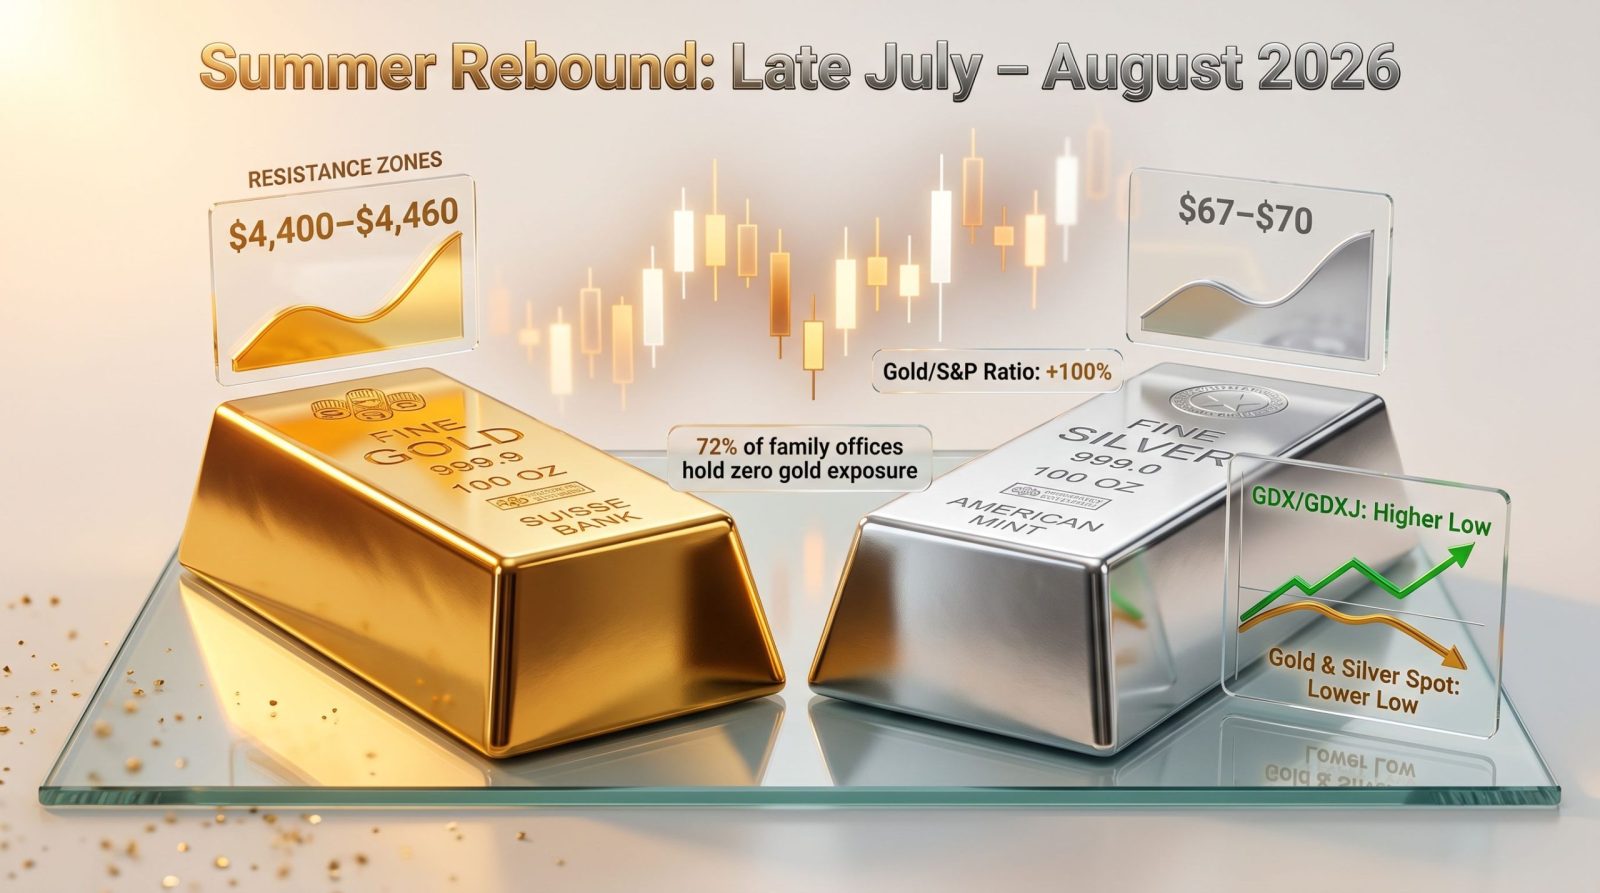
Gold: resistance near $4,400 to $4,460 (approximately $300 upside)
Silver: resistance near $67 to $70 (approximately $6 to $9 upside)
The next major ASX story will hit our subscribers first
The Big Picture: Gold vs. the Stock Market and the Secular Cycle
The Gold-to-S&P 500 Ratio as a Capital Flow Gauge
Stepping back from short-term price targets reveals a macro picture that is often overlooked in precious metals analysis. The ratio of gold to the S&P 500 functions as a measure of capital rotation between risk assets and hard assets. Understanding gold vs stock market cycles helps contextualise where we are within the broader secular pattern. Historically, the secular peaks in gold have been preceded by enormous moves in this ratio, reflecting massive capital outflows from equities and inflows to gold.
- The 1980 peak: preceded by a historic surge in the gold-to-S&P ratio.
- The 2001 to 2011 cycle: the ratio moved approximately 715%, representing one of the largest capital rotations in modern financial history.
- The current cycle: the gold-to-S&P ratio has moved approximately 100%, significant in isolation but far smaller in relative terms than prior secular peaks.
This comparison directly challenges the thesis that the current correction represents a secular peak. The scale of capital rotation required to produce prior major tops in gold simply has not occurred. The 715% move during the 2001 to 2011 cycle involved sustained, multi-year rotation of institutional capital away from equities and into gold at a scale that dwarfs the current 100% move.
Why the 1975 Comparison Does Not Hold
Some analysts have drawn parallels between the current correction and gold’s approximately 45% correction in 1975, which lasted 19 to 20 months. However, this comparison does not hold when the gold-to-S&P ratio context is applied. The ratio move preceding the 1975 correction was substantially larger than the move seen entering the current correction. The 1975 analog implies a secular peak; the ratio evidence implies a mid-cycle reset.
The Long-Term Thesis: A Multi-Year Bull Market Still in Early Stages
The conditions required for gold to reach $10,000 per ounce and silver to reach $200 per ounce involve a future scenario where equities enter a sustained bear market and capital rotates aggressively from stocks into gold at a scale not yet seen in the current cycle. This scenario is projected over a two to three year horizon at minimum, not the current summer period. The gold and silver summer rebound and the secular bull market continuation require entirely different strategic frameworks, though they can coexist.
Sentiment Data: The Structural Case for a Multi-Year Bull Market
ETF Flow Analysis and Capitulation Signals
Gold’s share of total ETF capital allocation has barely moved despite the price rally from 2024 to 2025, indicating that mainstream capital has not yet rotated meaningfully into the asset class. More tellingly, recent weeks showed net outflows from gold ETFs, a capitulation signal consistent with bottoming behaviour rather than distribution at a peak. Furthermore, gold’s safe-haven appeal remains structurally intact despite short-term sentiment weakness.
Institutional Sentiment at Multi-Year Extremes
The Merrill Lynch Global Fund Manager Survey revealed that the net percentage of fund managers describing gold as overvalued fell to approximately 1%, the lowest reading in approximately two and a half years. Historically, such low overvalued readings have coincided with major bottoms in secular bull markets. Given that this data carries approximately a one-month lag, current readings may be even more extreme.
Family Office Under-Ownership: A Structural Demand Tailwind
Perhaps the most structurally significant sentiment data point relates to family office allocation:
- Approximately 72% of family offices surveyed hold zero gold exposure.
- Among the 28% who do hold gold, the average allocation is less than 1% of total assets.
Structural Insight: When the world’s largest pools of private capital are essentially absent from an asset class that is in a confirmed secular bull market, the conditions for a prolonged re-rating are firmly in place.
Mining Equity Recovery Timeline: What GDX History Suggests
Analysis of historical GDX corrections from comparable periods in 2002, 2004, and 2006 reveals a consistent pattern. These corrections lasted approximately five months before establishing meaningful lows, after which rebounds occurred within a defined price range. The current GDX price action exhibits characteristics of a double bottom formation, adding technical support to the rebound thesis.
Importantly, historical breadth analysis suggests that the pattern following extreme oversold readings follows a predictable sequence: rebound, consolidation, then a larger eventual breakout. The timeline data from comparable setups indicates:
- 5 months from oversold breadth reading to major rally (2002 analog)
- 10 months to major rally (2006 to 2007 analog)
- 12 months to major rally (mid-cycle extreme analog)
The implication for 2026 is that the gold and silver summer rebound, expected in late July through August, is likely to be followed by a secondary consolidation period. This creates the possibility of a secondary buying opportunity in late 2026, potentially in the autumn period, before a larger breakout phase materialises.
Investor Strategy: Positioning Across Different Time Horizons
Staged Entry and the Two-Opportunity Framework
The technical and seasonal evidence supports a two-stage opportunity framework for investors in the current environment:
- Summer rebound (late July to August 2026): a tactical opportunity with defined resistance levels at $4,400 to $4,460 for gold and $67 to $70 for silver. This is a trading opportunity with bounded upside.
- Late 2026 secondary low: if breadth history repeats, a further consolidation after the summer rebound may create a more favourable risk-to-reward entry point for longer-duration positioning.
The Case for Buying Quality and Holding Through the Cycle
In secular bull markets, the largest returns historically accrue to investors who buy fundamentally sound assets at value and hold through volatility rather than attempting to trade every intermediate fluctuation. The distinction between these two approaches is meaningful:
- Trading: capturing short-term moves, trimming at resistance levels, and rotating capital actively.
- Investing: identifying quality companies with strong underlying assets, buying at value, and holding through the full duration of the bull cycle.
For junior and mid-tier miners with strong asset bases and defined upside potential, the combination of a summer rebound, potential secondary entry in late 2026, and a multi-year secular bull market thesis creates a compelling setup for patient, quality-focused investors. Companies with 3x to 5x upside potential over a two to three year horizon represent the focal point of this approach, where the bull market itself does much of the heavy lifting for investors who have correctly identified quality assets at depressed valuations. Moreover, reviewing gold-silver ratio analysis can help investors fine-tune their allocation between the two metals at different stages of the cycle.
Risk Factors That Could Alter the Timeline
No technical or seasonal thesis is without risk. Factors that could delay or modify the summer rebound include:
- A deeper-than-expected false new low in July that tests investor conviction more severely than anticipated.
- Unexpected US dollar strength, which has historically compressed gold rallies.
- Macro surprises such as unanticipated central bank policy decisions that alter the rate environment.
- Breadth data suggests the sector requires time as much as price recovery to build a genuinely durable base.
Frequently Asked Questions: Gold and Silver Summer Rebound 2026
Has the Gold and Silver Summer Rebound Already Started?
The technical evidence suggests an important low has been established, but the primary rebound phase is more likely to gain traction in late July through August 2026. Early July may still involve consolidation or a false new low before the genuine rally begins in earnest.
What Is a Positive Divergence in Precious Metals, and Why Does It Signal a Rebound?
A positive divergence occurs when mining stocks form higher lows while gold and silver prices make lower lows. Because miners are forward-looking equity instruments, their relative strength signals that the market is beginning to price in a recovery before it appears in spot metal prices.
What Are the Key Upside Targets for Gold and Silver in the Summer Rebound?
Gold faces primary resistance near $4,400 to $4,460, implying approximately $300 of potential upside. Silver’s key resistance sits at $67 to $70, representing approximately $6 to $9 of upside from current levels near $61.
How Does the Current Gold Correction Compare to Historical Post-Breakout Corrections?
The current correction is consistent in scale with prior first-significant corrections following major gold breakouts. The 2006 template, involving a gradual rebound rather than an explosive recovery, is considered the more likely outcome based on current macro and technical context.
What Does the Gold-to-S&P 500 Ratio Tell Us About Where We Are in the Secular Bull Market?
The ratio has moved approximately 100% in the current cycle, significant in isolation but far below the 715% move seen during the 2001 to 2011 bull market. This strongly suggests the secular bull market remains in its early-to-middle stages, with substantial upside remaining over a multi-year horizon.
Is There a Better Buying Opportunity Coming After the Summer Rebound?
Historical breadth analysis suggests that after an oversold reading and initial rebound, the sector often consolidates again before a larger breakout. A secondary buying opportunity may emerge in late 2026, making staged entry a prudent approach for investors with a longer time horizon.
Key Takeaways: The Summer Rebound Thesis in Summary
- Precious metals have established a technically significant low supported by positive miner-metal divergence, bullish weekly candlestick patterns, and extreme oversold breadth readings across GDX components.
- The gold and silver summer rebound is most likely to materialise in late July through August 2026, not early July. A false new low in mid-July remains a distinct possibility within the seasonal pattern.
- Gold’s primary upside target for the rebound sits near $4,400 to $4,460, implying approximately $300 of potential upside. Silver’s key resistance zone is $67 to $70, implying $6 to $9 of upside from approximately $61.
- Sentiment data including near-record-low institutional gold allocation and widespread family office under-ownership confirms the secular bull market remains in its early stages.
- The gold-to-S&P 500 ratio analysis indicates the current cycle has generated only a 100% move, far below the 715% rotation seen in the 2001 to 2011 cycle, supporting a multi-year bull market thesis with substantial further upside.
- After the summer rebound, a secondary consolidation and potential re-test may create another entry opportunity in late 2026 before a larger breakout phase develops.
Disclaimer: This article is for informational and educational purposes only and does not constitute financial advice. Precious metals markets involve significant risk, and past seasonal patterns are not guarantees of future performance. Price targets and timelines referenced are based on technical analysis and historical analogs, which carry inherent uncertainty. Investors should conduct their own due diligence and consult a qualified financial adviser before making any investment decisions.
Discovery Alert’s proprietary Discovery IQ model delivers real-time alerts on significant ASX mineral discoveries, instantly translating complex data across 30-plus commodities into a single, actionable gold-equivalent metric — giving subscribers a critical edge during high-potential windows like the current precious metals cycle. Explore how historic mineral discoveries have generated exceptional returns and begin your 14-day free trial today to position yourself ahead of the broader market.


Leave a comment