

Bitcoin and Ethereum continued higher on Wednesday, but the market is moving into a more demanding decision zone. Bitcoin remains just under a cited pivot target, Ethereum momentum is strong rather than divergent, and Ethereum dominance is already signaling that traders should protect profits instead of chasing strength. A weaker dollar supports the move for now, while warnings are becoming more visible across global equities and individual altcoins.
Bitcoin remains just below the $65,622 pivot
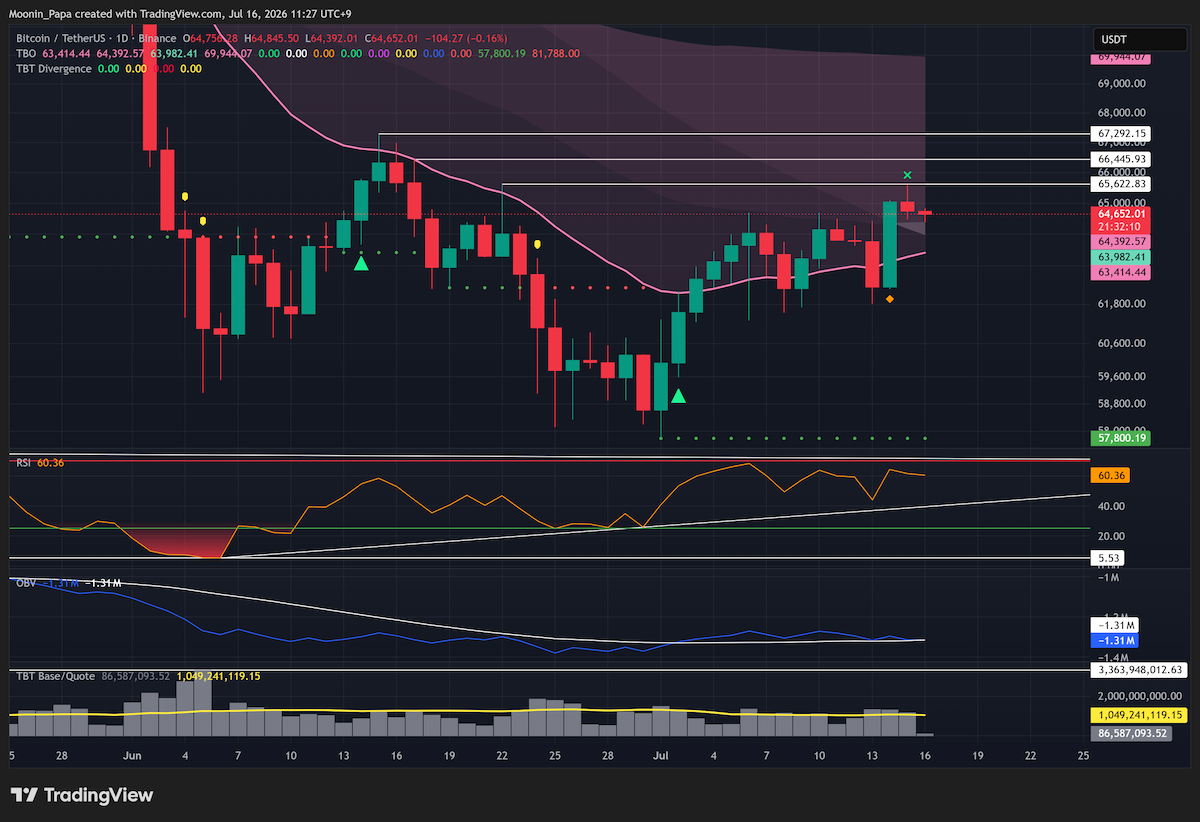
Bitcoin daily chart below the 65,622 pivot target
Bitcoin made a slightly higher local high on Wednesday but did not surpass the previous pivot high target at $65,622. Because price is already close to that level, the analysis still expects Bitcoin to clear it and move toward the top of the daily TBO Cloud. The open TBO Close Short remains a tactical warning that price could first pull back to the Fast line.
Ethereum momentum points toward $2,041
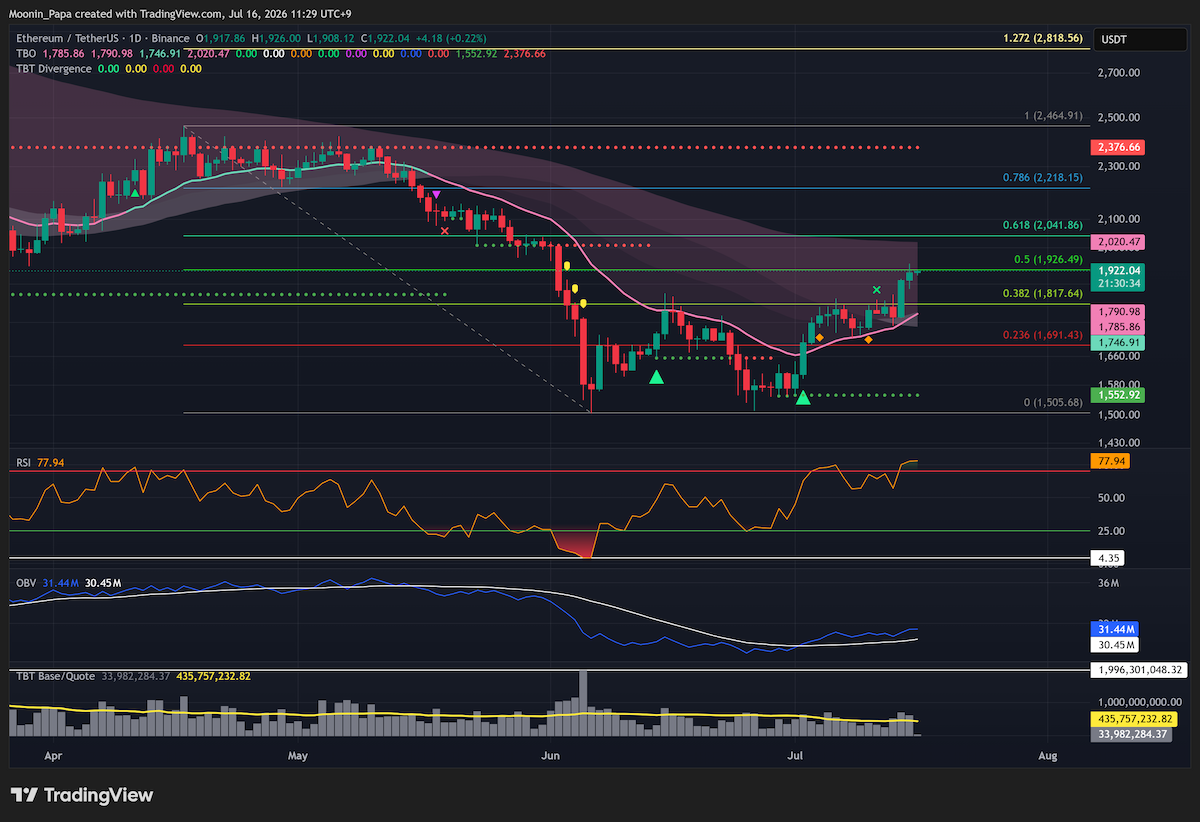
Ethereum daily chart with Fibonacci targets near 1,926 and 2,041
Ethereum set a higher local high at $1,946, while daily RSI advanced to 77.52 from the prior 74.65 high. A higher high in both price and RSI is not bearish divergence; it reflects strong bullish momentum. If ETH closes above the 0.5 Fibonacci level at $1,926, the next cited target is the 0.618 level at $2,041.
That target is near the top of the daily TBO Cloud and the weekly Fast line. The source describes this confluence as a major exit range and an opportunity to prepare for a new short rather than a reason to chase late momentum.

Ethereum dominance has entered the profit-protection zone
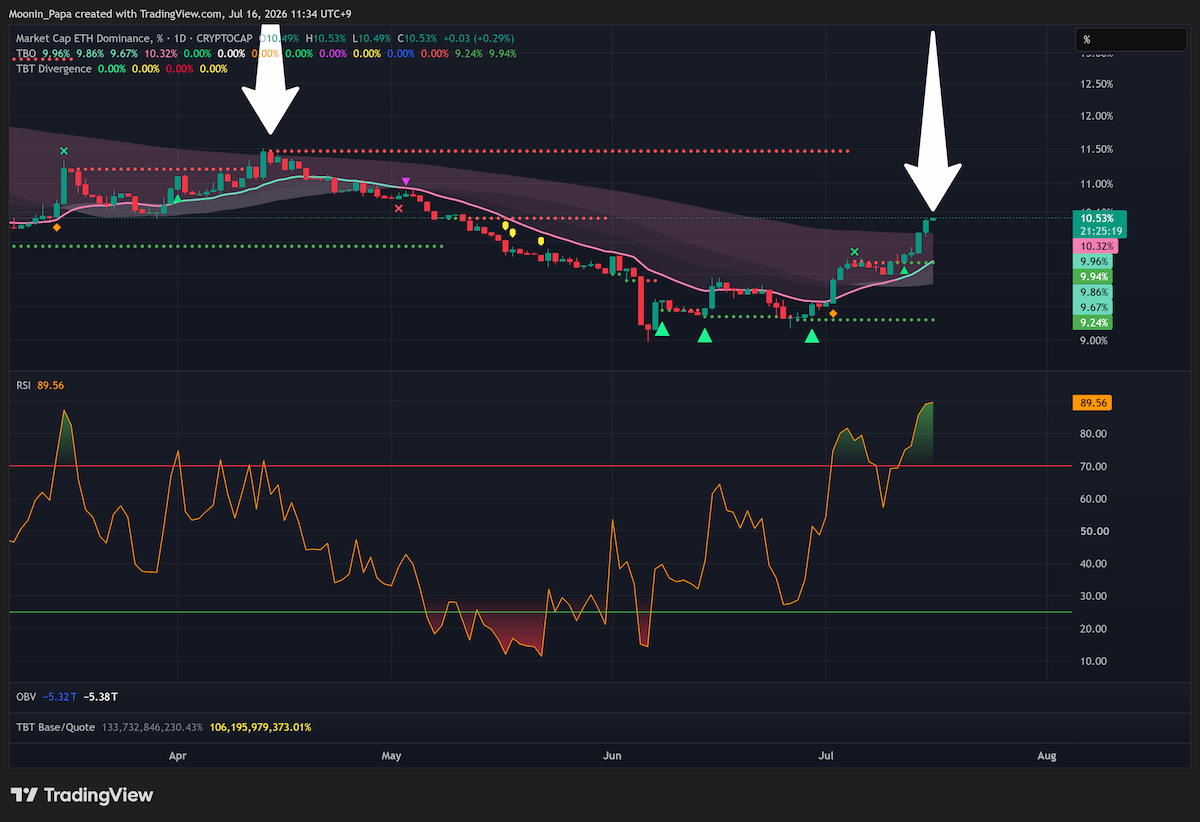
Ethereum dominance daily chart pushing above the TBO Cloud
ETH.D, the Ethereum dominance chart, pushed above its daily Cloud. This is not the ETH price chart. ETH and ETH.D can both extend as ETH approaches roughly $2,050, but the move above the Cloud is characterized as the gravy zone where scaling out protects profits. Combined stablecoin dominance remains in bearish consolidation and has not yet reached the below-25 RSI level identified as a stronger exit signal for longs and entry signal for shorts.
SOL.D also remains in bearish consolidation. SOL.D measures Solana dominance and is not a SOL spot-price reading; no SOL price move is inferred from that chart.
Dollar weakness supports stocks and crypto for now
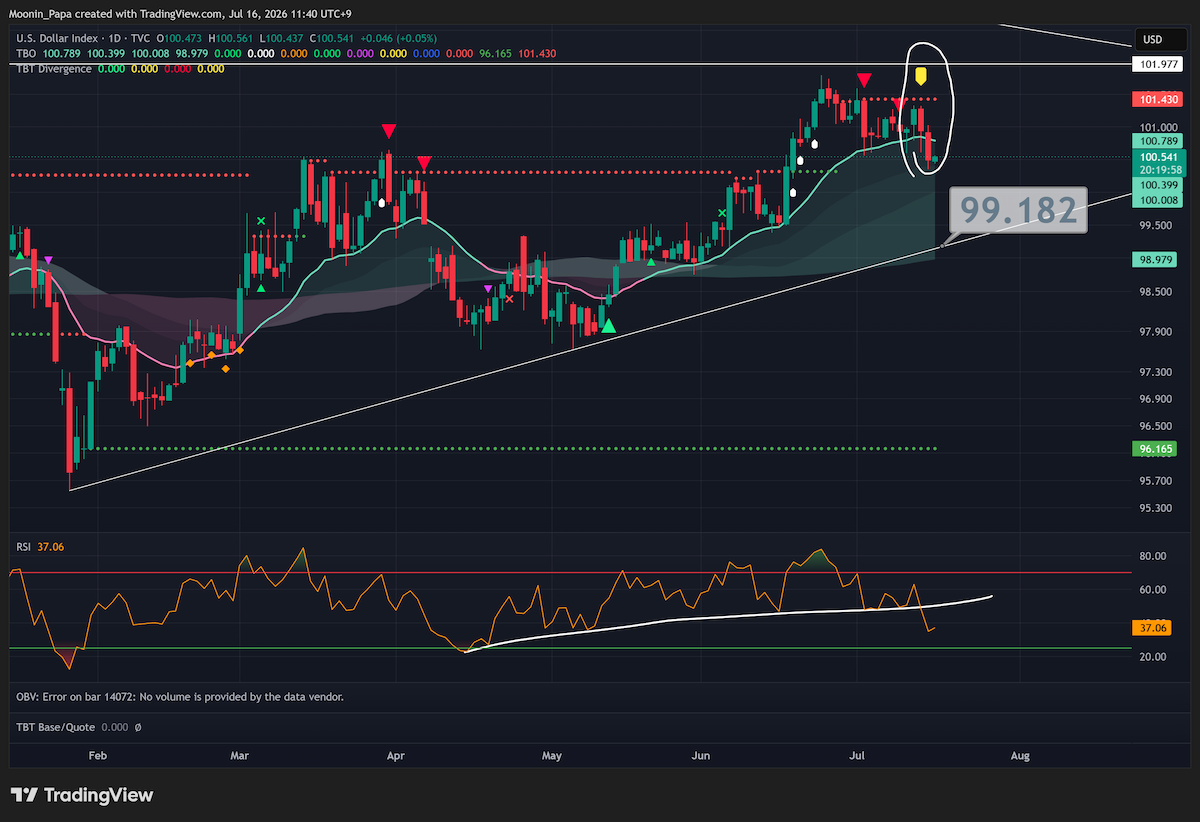
U.S. Dollar Index daily chart shifting into bearish consolidation
The DXY closed deeper inside its daily Cloud, shifting from strong bullish to bearish consolidation, while RSI lost its prior support structure. The analysis continues to target support near 99.182. That weakness should support stocks and crypto until the dollar reaches support, where a bounce could change the near-term backdrop.
Nikkei adds a second reversal warning
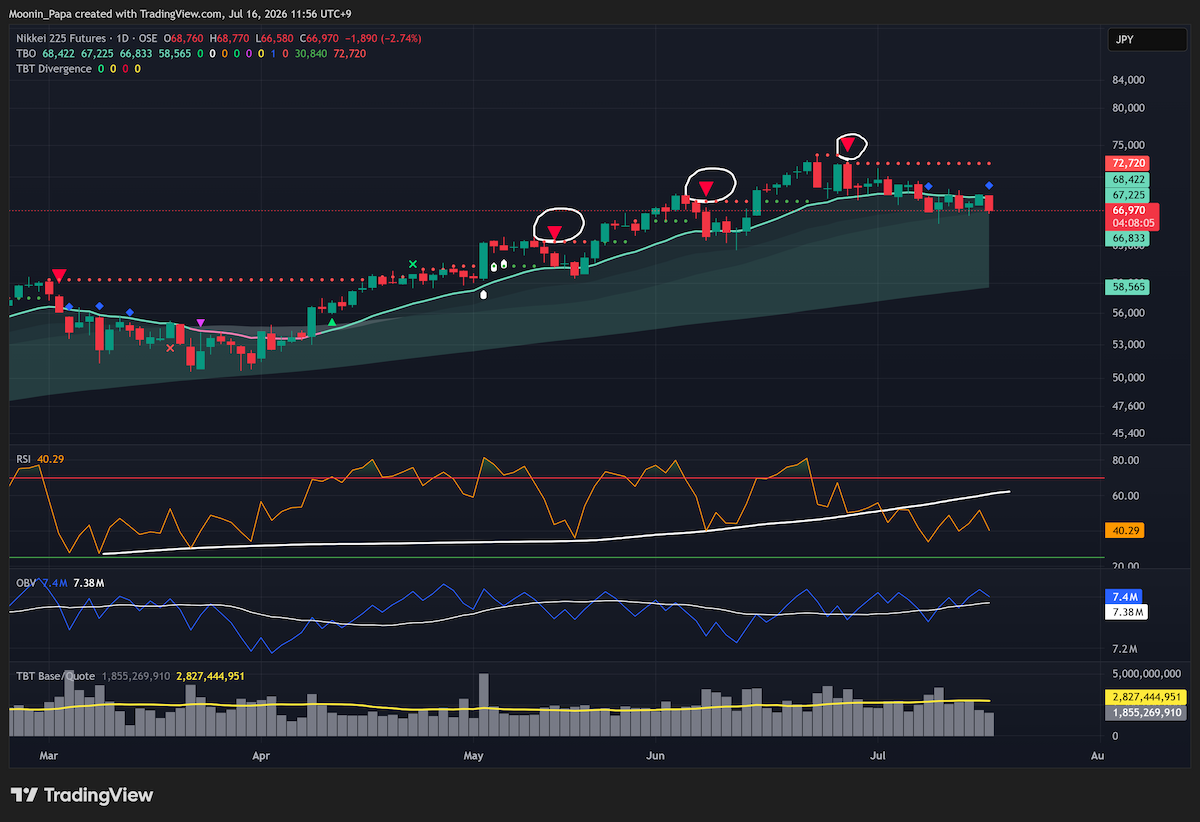
Nikkei 225 futures daily chart with repeated TBO Close Long warnings
S&P futures closed green again and the VIX declined, but international equity signals are mixed. The Nikkei is working on a second TBO Close Long after the prior warning from the previous Wednesday, reinforcing evidence that weakness is building. The Shanghai Composite remains strong bearish below its Cloud, while the Hang Seng continues higher but is not expected to break its daily Slow line.
Altcoin opportunities require chart-by-chart selection
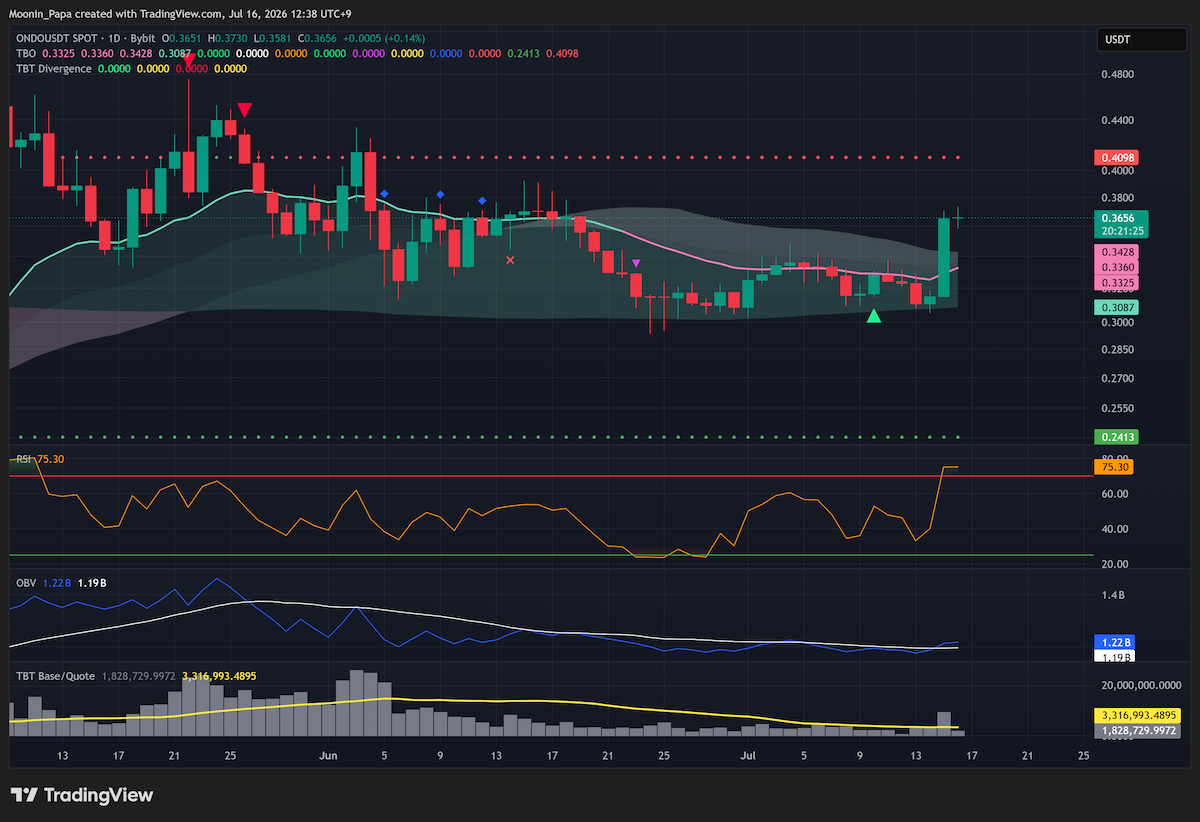
ONDO daily chart after a nearly 16 percent move
ONDO gained nearly 16% on Wednesday. If the move has follow-through, the cited termination zone is TBO Resistance near 0.40. Other signals are less uniform: LIT printed a second TBT Bearish Divergence, VELVET and JUP produced TBO Close Long reversal warnings, while STX and JASMY printed TBT Bullish Divergence Clusters. The dispersion argues for selectivity rather than a broad altcoin chase.
Learn my strategies and the tools I use every day by visiting The Complete Cryptocurrency Investor by Mastering Assets.
Disclaimer: The views expressed in this article are those of the author and may not reflect those of Kitco Metals Inc. The author has made every effort to ensure accuracy of information provided; however, neither Kitco Metals Inc. nor the author can guarantee such accuracy. This article is strictly for informational purposes only. It is not a solicitation to make any exchange in commodities, securities or other financial instruments. Kitco Metals Inc. and the author of this article do not accept culpability for losses and/ or damages arising from the use of this publication.












Leave a comment