

Shiba Inu (SHIB) extends gains, trading above $0.0000042 on Tuesday after breaking above the descending trendline the previous day. Strengthening on-chain data and improving derivatives metrics support further gains for the meme coin.
Exchange outflows signal declining selling pressure
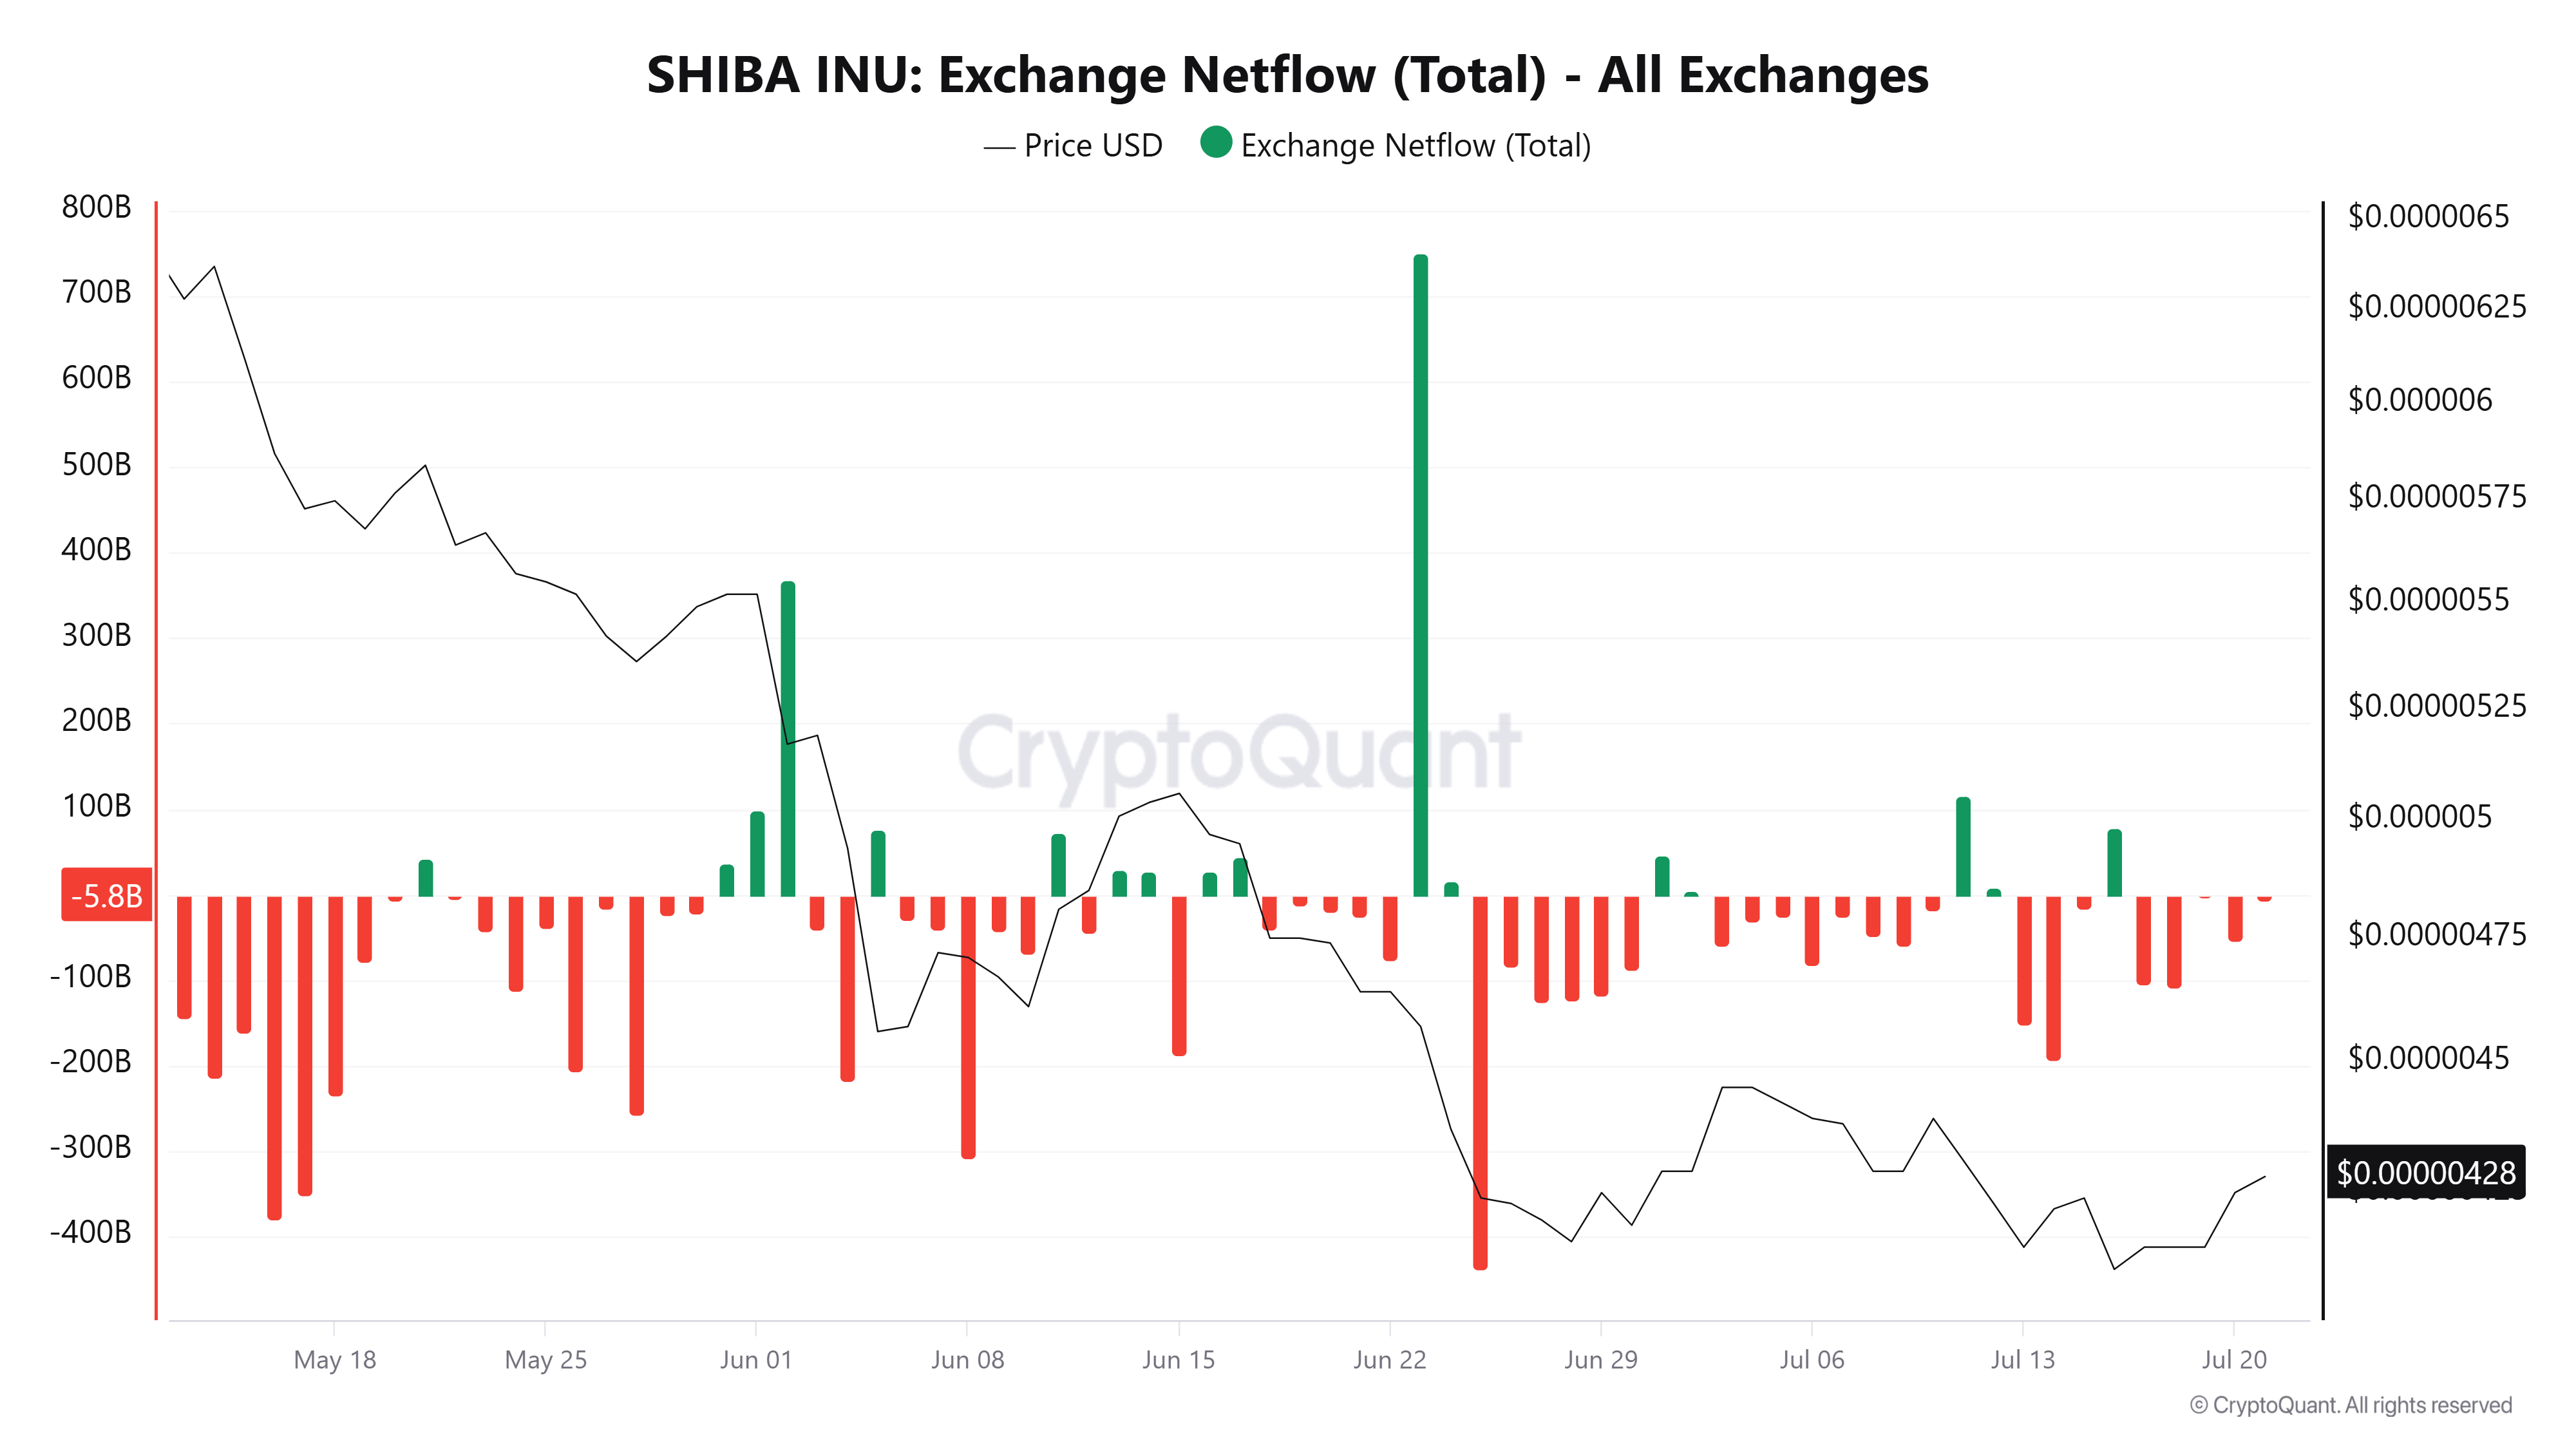
CryptoQuant’s exchange netflow chart below shows five consecutive days of net outflows (red bar) since July 17. This indicates that traders are withdrawing SHIB from exchanges to their wallets, signaling reduced selling pressure, supporting a bullish outlook.
Derivatives metrics support a bullish bias
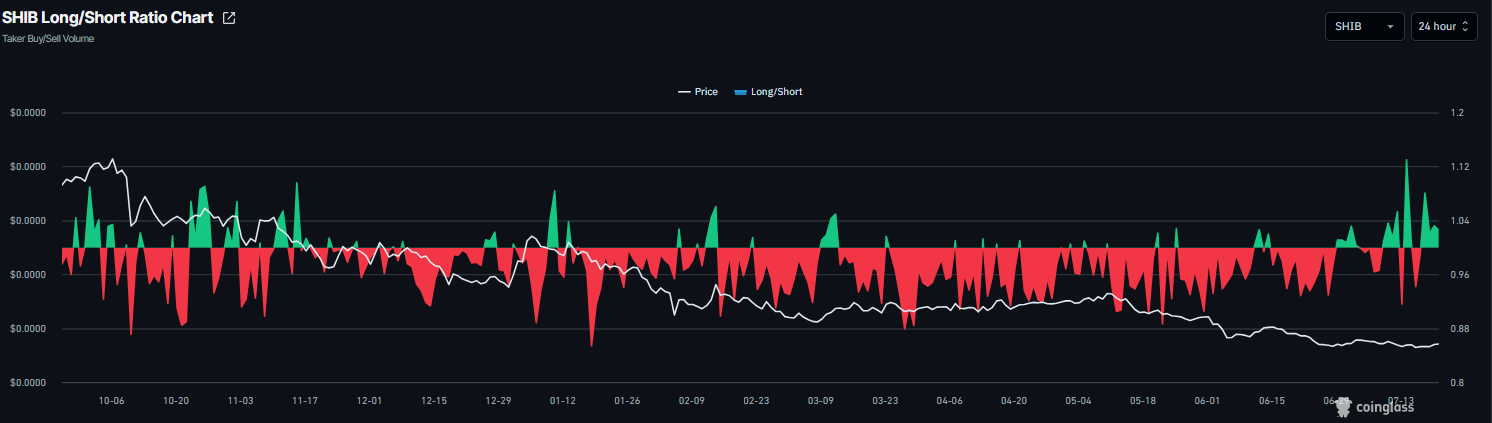
Derivatives data also supports a positive outlook for the meme coin. CoinGlass’ long-to-short ratio reads 1.02 on Tuesday. A ratio below 1 indicates bullish sentiment, as traders bet that asset prices will rise.
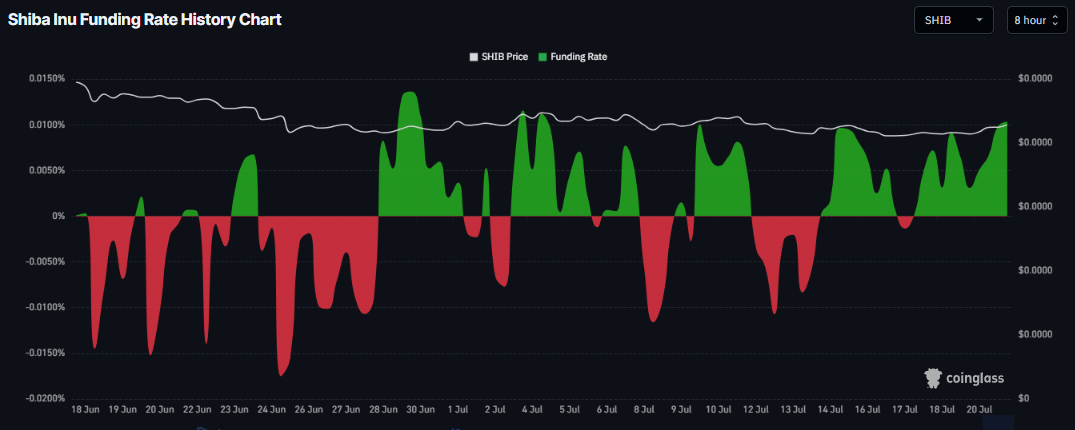
In addition, SHIB’s funding rates flipped positive on July 17 and have remained in bullish territory, with a reading of 0.0103% on Tuesday, indicating that longs are paying shorts and projecting bullish sentiment.
Shiba Inu Price Forecast: Breaks above the descending trendline
Shiba Inu price extends its gains, trading above $0.0000042 on Tuesday after breaking out of the descending trendline (drawn by connecting multiple highs since mid-May) the previous day.
If SHIB continues its recovery, it could extend the rally toward the next daily resistance at $0.0000045. A close above this could extend gains toward the 50-day Exponential Moving Average (EMA) at $0.0000045.
The Relative Strength Index (RSI) on the daily chart reads 45, trending toward the neutral 50 level and indicating fading bearish momentum. The Moving Average Convergence Divergence (MACD) indicator showed a bullish crossover, with rising green histogram bars, further supporting the positive outlook.
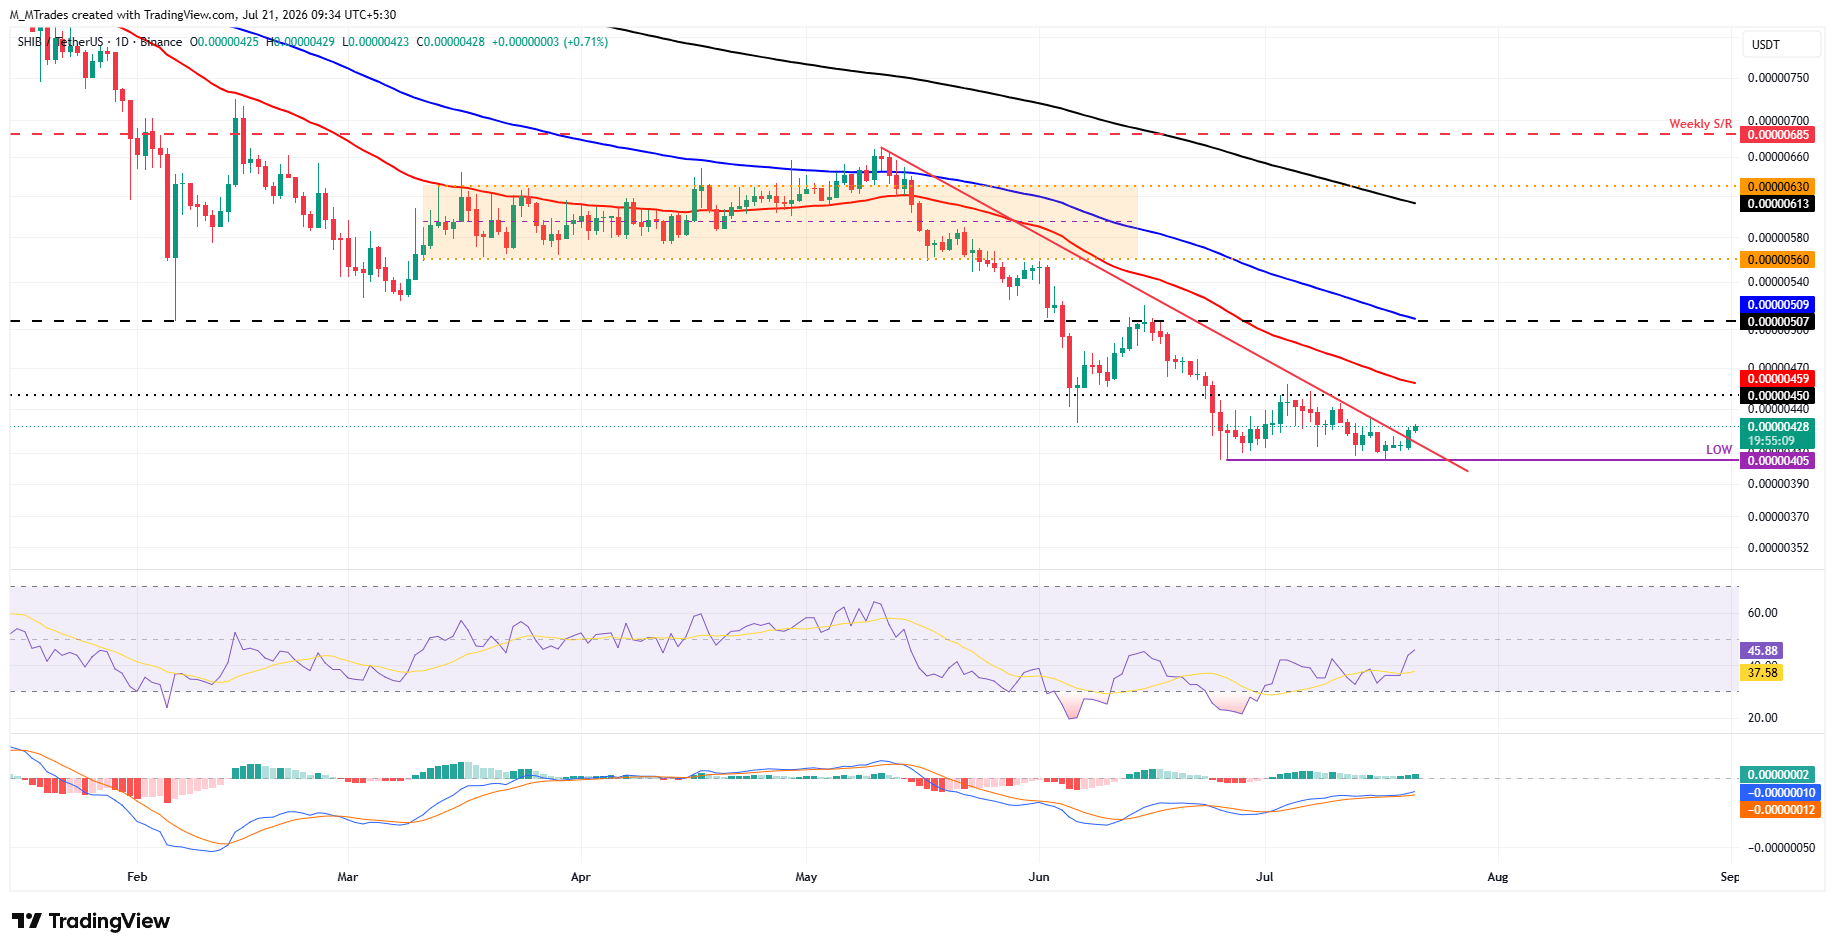
However, if SHIB continues its correction, it could extend the decline toward the yearly low at $0.0000040.








Leave a comment