Bitcoin at $70K – Reasons why BTC’s investors are still doubling down

- The number of entities having at least 1k coins shot up considerably.
- The accumulation banked on expectations of higher inflows into Bitcoin spot ETFs.
Bitcoin [BTC] was consolidating around old all-time highs (ATH) as of this writing, as market participants eagerly waited for a decisive move to the next big target of $75,000.
No drop in accumulation
The good news was that buying activity remained strong. According to AMBCrypto’s analysis of Santiment’s data, Bitcoin’s accumulation trend score was 0.78 at press time, implying that most of the larger entities were adding to their positions.
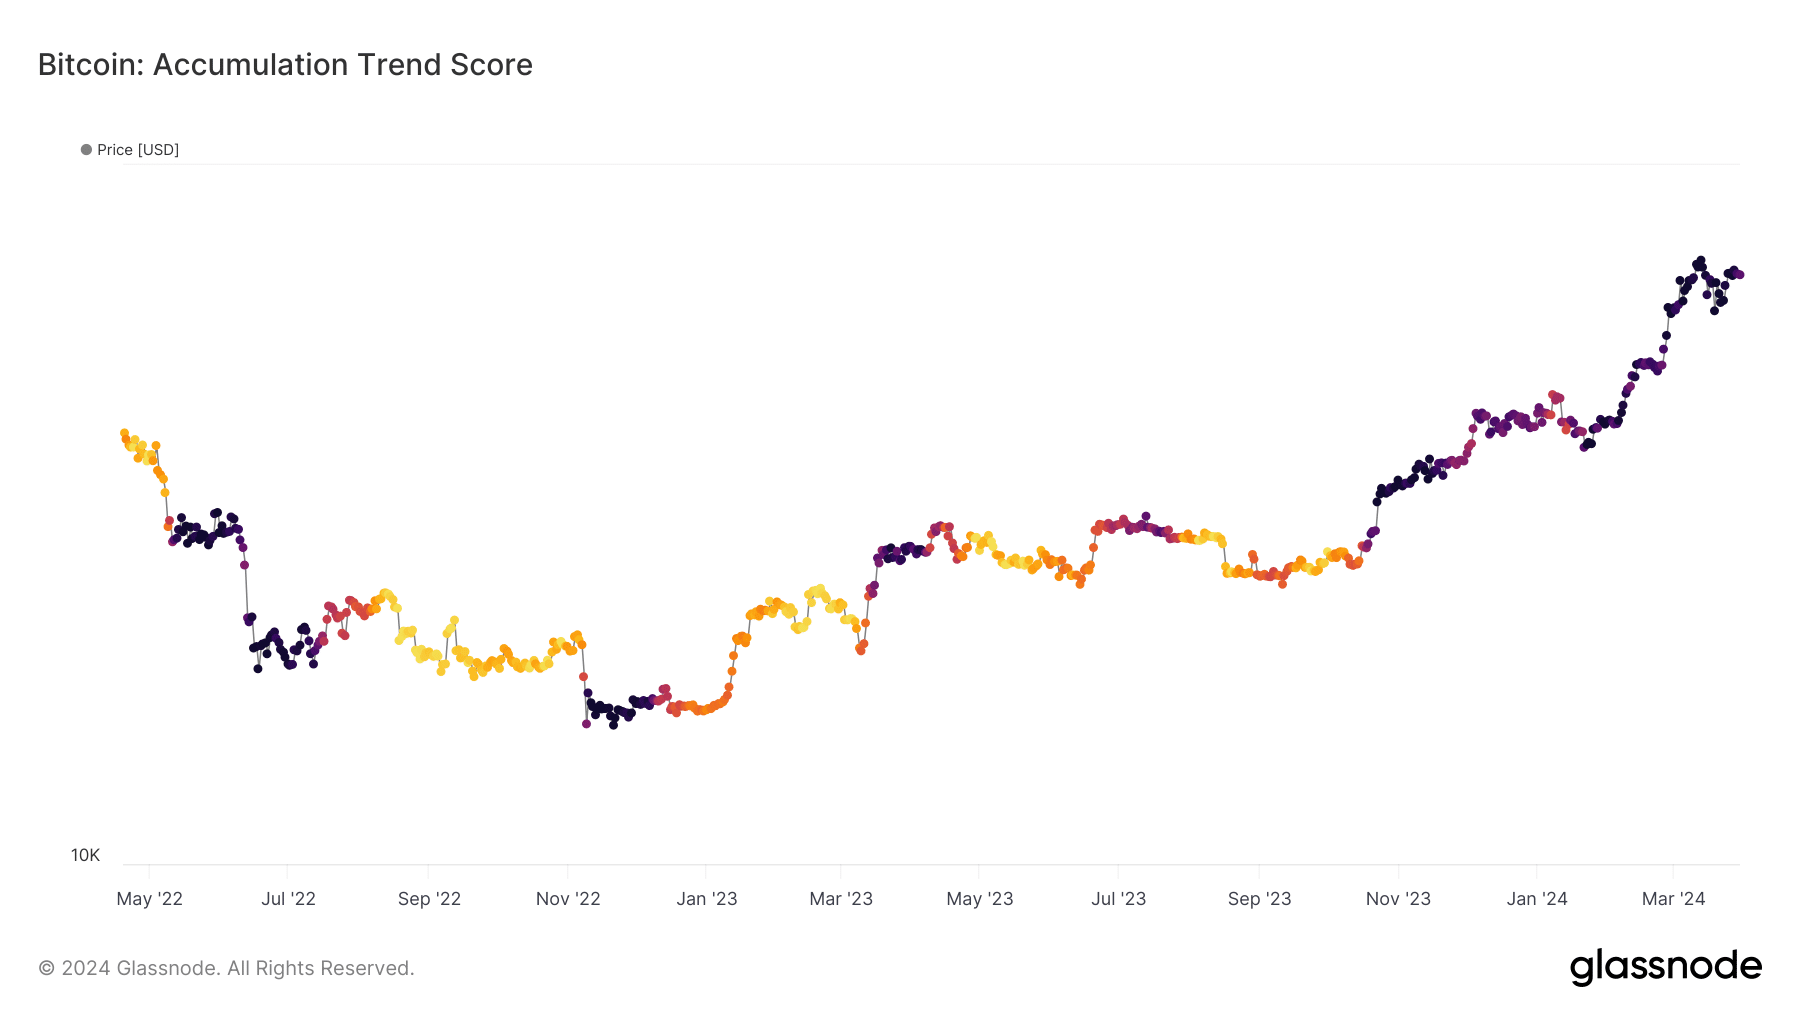
Source: Glassnode
Steady accumulation meant that investors were convinced that BTC’s market was not yet saturated and there was scope for further price gains.
The bullishness was also reflected in the rapidly increasing number of whale addresses i.e, addresses holding a minimum of 1,000 coins. As of the 30th of March, the total number of whale entities was 1,617, up from 1,565 same time last month.
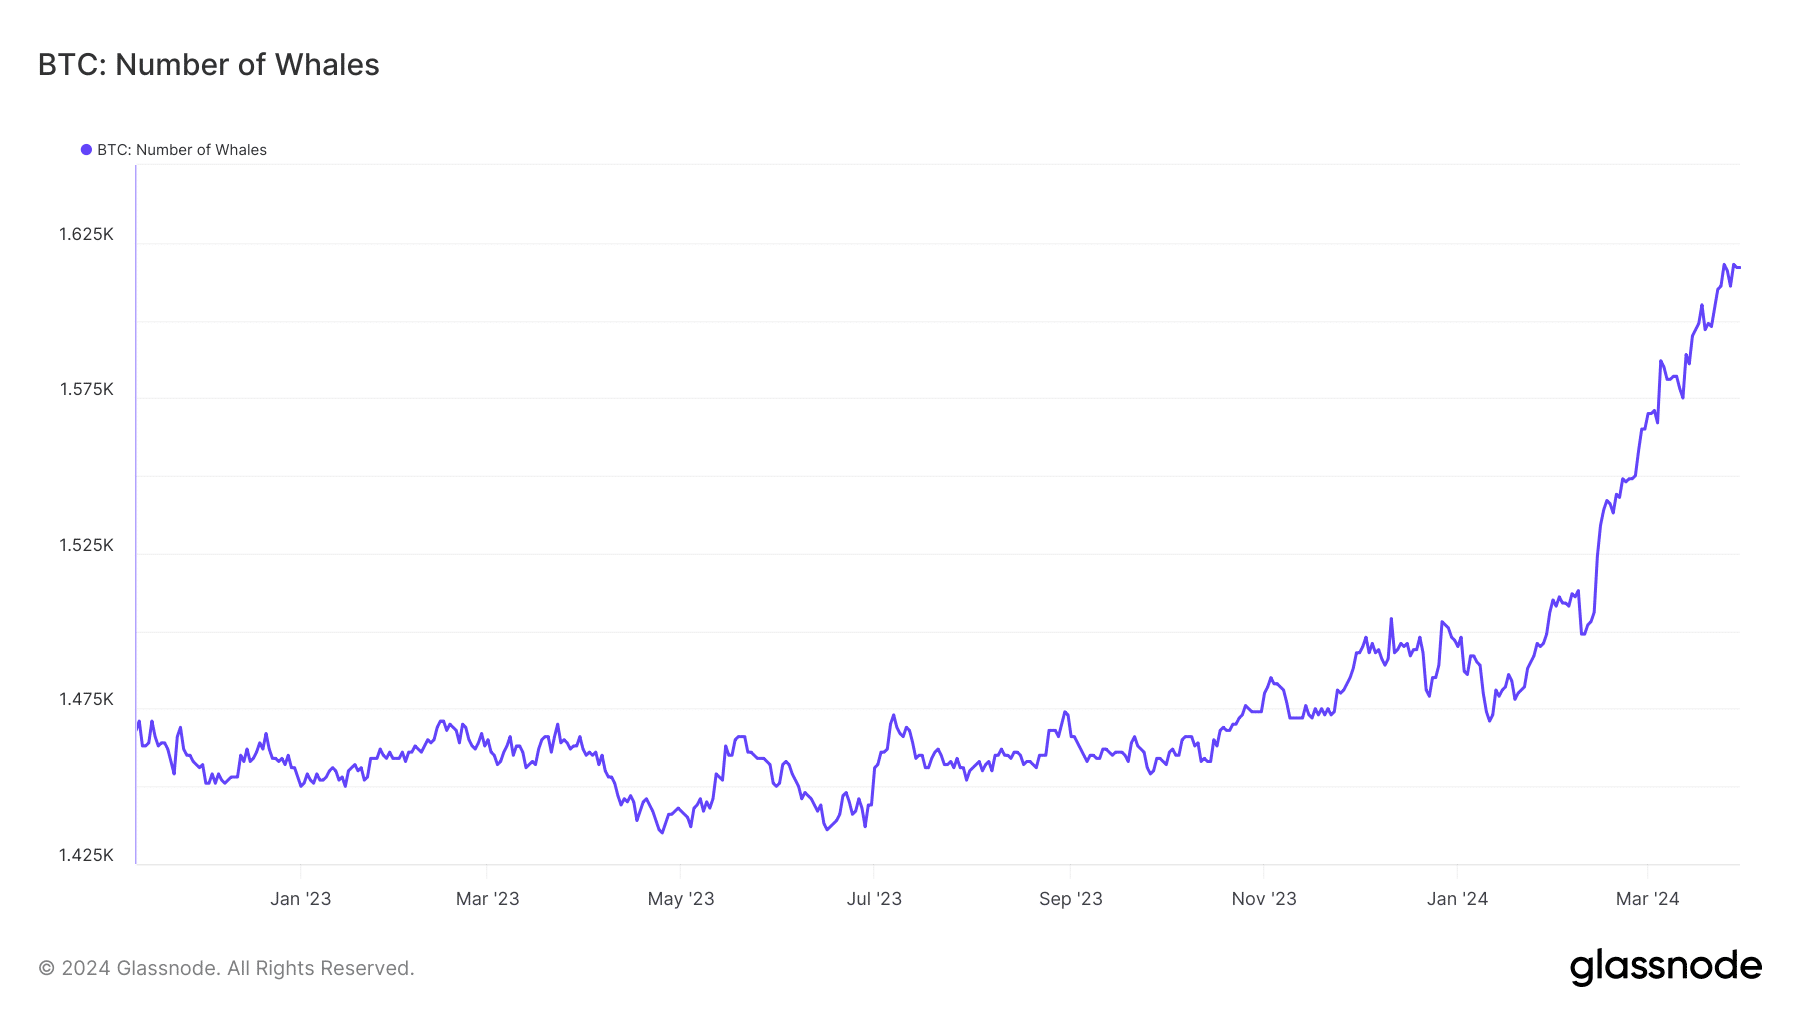
Source: Glassnode
The biggest bullish trigger
The optimism was most likely driven by expectations of higher inflows into Bitcoin spot ETFs. These investment vehicles have captured the majority of Bitcoin’s supply since they began trading early January.
The ten new spot ETFs have attracted inflows worth more than $12 billion since listing, according to SoSo Value data.
And demand was likely to get stronger. Jinze, an analyst at cryptocurrency investment firm LD Capital, predicted a strong next week as large funds could shift capital to spot ETFs due to the end-of-quarter rebalancing.
What do technical indicators tell?
AMBCrypto analyzed some of BTC’s key technical indicators to gains insights on its next directional moves.
The Relative Strength Index (RSI) moved closer to 60, a breach of which could add considerable bullish optimism.
Read BTC’s Price Prediction 2024-25
The On Balance Volume (OBV) mirrored the price action as of this writing, suggesting a balance between bullish and bearish forces.
The Moving Average Convergence Divergence (MACD) indicator looked likely to make a bullish crossover with the signal line. Such an event could increase the chances of Bitcoin’s elevation in the days ahead.
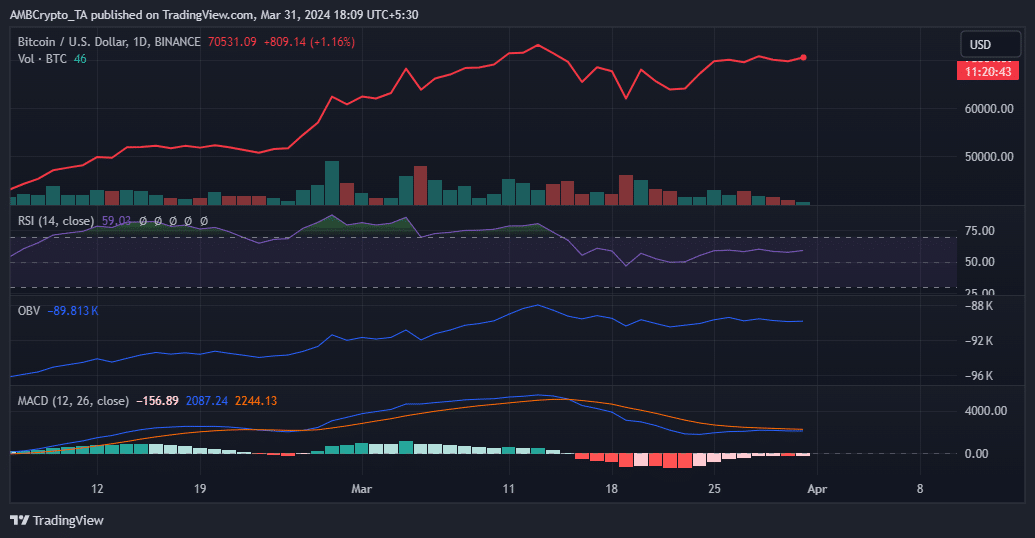
Source: Trading View
Source link