

Bitcoin Cash price is trading flat on the day, currently trading at $444.8, but a 112.6% surge in 24-hour volume to $282.8 million is the first meaningful signal to cut through weeks of compressed, directionless price action.
Bitcoin Cash (BCH) has been rangebound since early March, grinding sideways between roughly $420 and $480 with no sustained conviction from buyers or sellers. For context, year-to-date, the coin is down 25.62%, even as its trailing 12-month return holds at +22.67%.
Bitcoin Cash Capped Below 0.236 Fibonacci as Analyst Targets $1,509
The daily chart places price below the 0.236 Fibonacci retracement at $481.8, the level that has functioned as overhead resistance since the January selloff from above $650. A 9-period SMA sitting at $447.9, barely above the current price, confirms the compression.
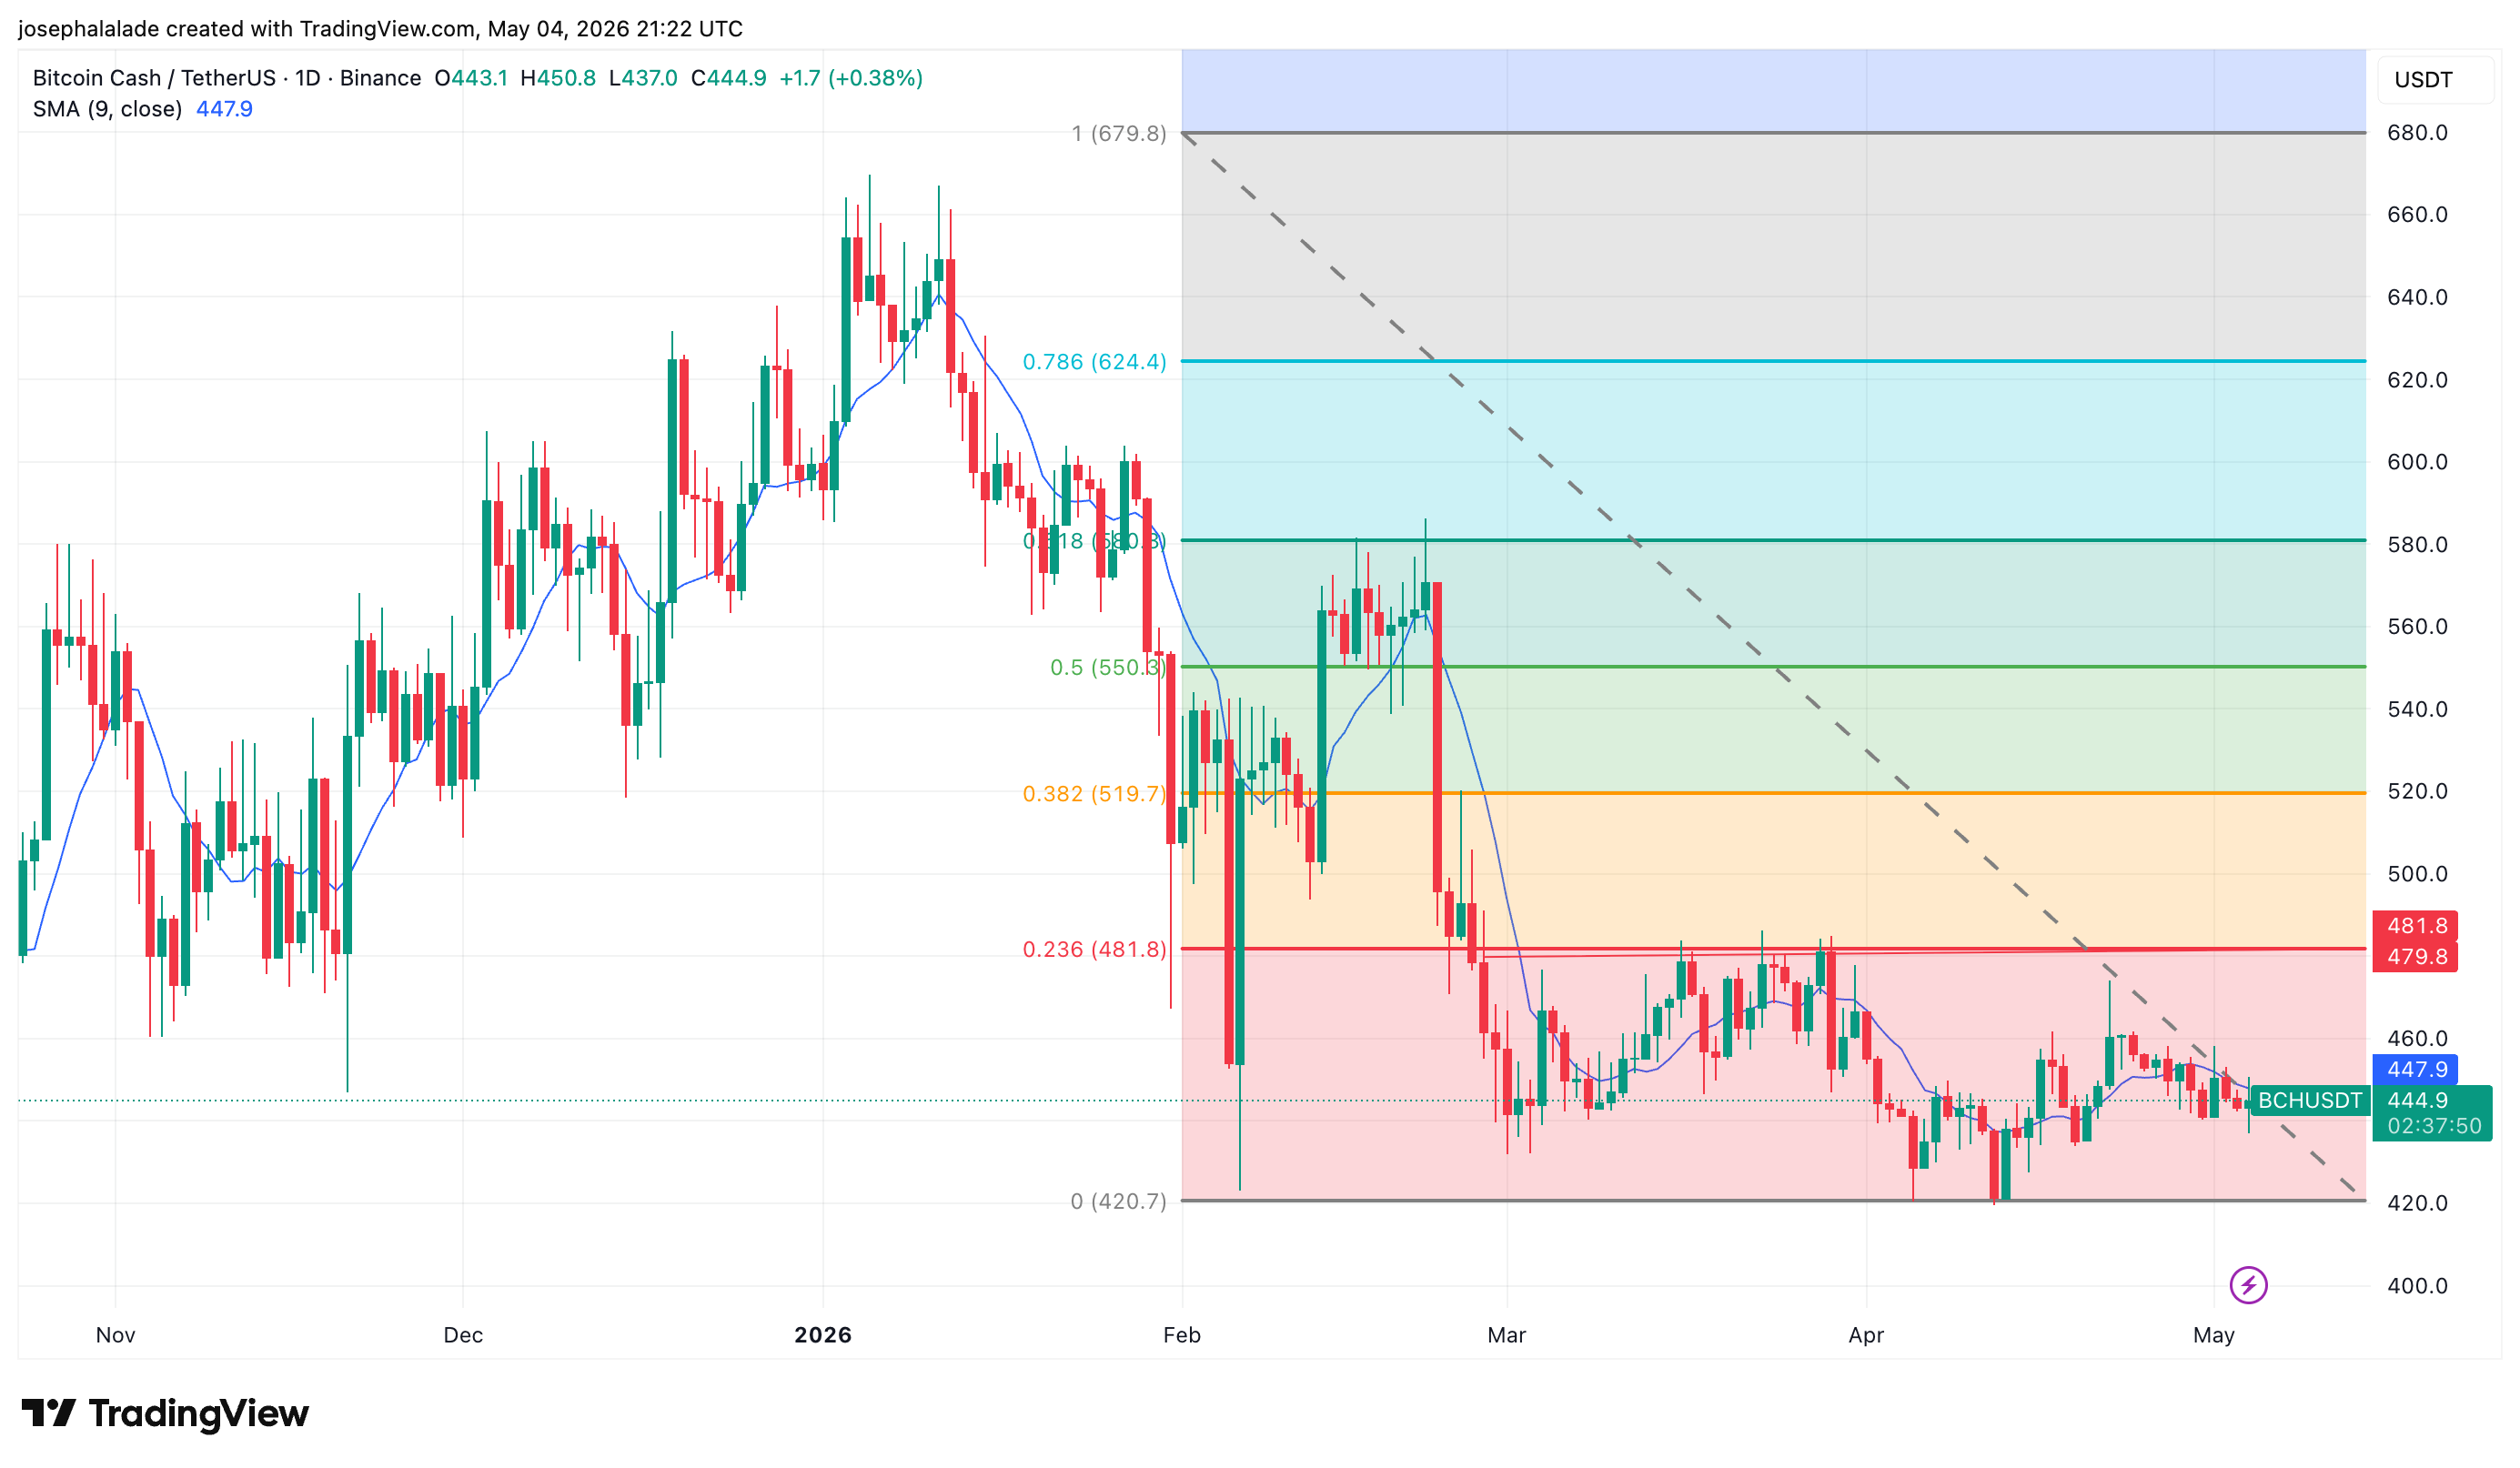
Buyers stepped in at the session low of $437.45, but selling pressure returned before the BCH price could push past $450, the daily high. The next Fibonacci levels that matter are $519.7 (0.382) and $550.8 (0.5), both well above where Bitcoin Cash has closed in recent weeks. Still below $481.8, where the last two recovery attempts faded, and the SMA is beginning to slope down again.
In the long-term frame, however, the setup reads differently. Analyst Javon Marks points to BCH maintaining a multi-year breakout structure that held from mid-2023, when price cleared a long-standing descending resistance pattern.
Since that break, Bitcoin Cash coin has preserved gains of nearly +300%, and Marks argues the current continuation of that pattern targets $1,509.89, a projected move of +233% from current levels. That call was first published on February 7 and has not been revised.
Notably, the Bitcoin Cash price is still 89.79% below its all-time high of $4,355.62, set in December 2017. From its all-time low of $75.08 in December 2018, however, BCH is up 492.21%, a figure that the long-term pattern Marks references reinforces rather than contradicts.
A six-month return of -7.26% reflects how much of the cycle gain has unwound near-term, but the one-year return anchors the Bitcoin Cash price prediction in a structural context that the weekly chart does not yet disprove.
A weekly close above $481.8 would be the first confirmation that the base is holding, while a weekly close below $420.7 would negate it. Until one of those prints, the Bitcoin Cash price prediction of $1,509.89 remains a structural target with no active trigger.
READ MORE: Binance Rolls Out Withdrawal Lock to Curb “Wrench Attacks” on Crypto Holders


Leave a comment