

Chainlink (LINK) trades above $7.90 on Friday, extending its recovery after posting modest gains in the previous day. Institutional demand shows signs of optimism, with spot Chainlink Exchange Traded Funds (ETFs) logging a second straight day of inflows so far this week. In addition, growing ecosystem adoption through Mantle Super Portal and Aave’s integration of Chainlink’s Cross-Chain Interoperability Protocol (CCIP) is supporting LINK’s bullish outlook.
Institutional demand shows early signs of strength
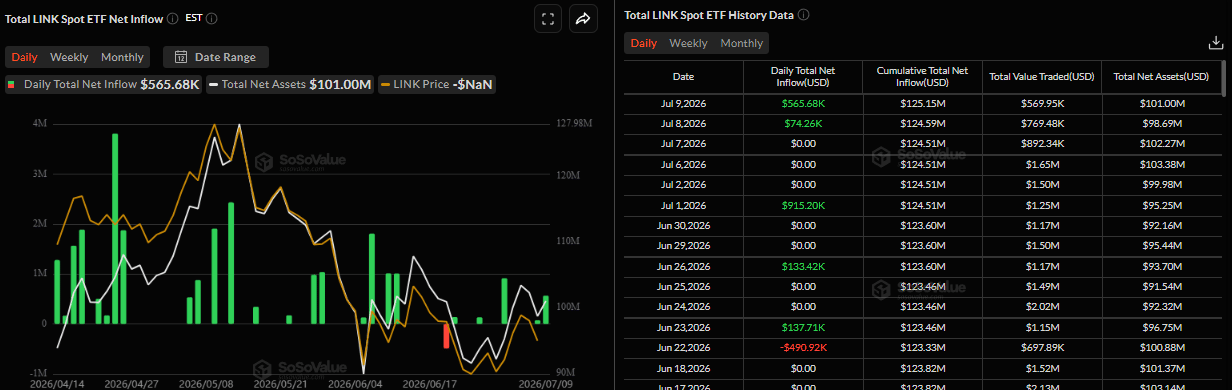
Institutional demand shows signs of optimism so far this week. SoSoValue data shows that spot ETFs recorded inflows of $565,680 on Thursday, following an inflow of $74,260 the previous day. If these inflows continue to strengthen, LINK price could extend the ongoing recovery.
Growing ecosystem adoption boosts LINK
Mantle X account announced on Thursday that its Mantle Super Portal, built with Bybit, is upgrading to Chainlink’s Cross-Chain Interoperability Protocol (CCIP) as its exclusive cross-chain infrastructure, unlocking enterprise-grade security at scale.
During the same period, Aave announced the launch of Stable Vaults, enabling businesses to embed fixed-rate stablecoin yield into any product, powered by Chainlink CCIP and Price Feeds.
These partnerships and the growing adoption of Chainlink’s CCIP signal a bullish long-term outlook for Chainlink and its native token, LINK, boosting ecosystem growth and bolstering investor confidence.
In the short term, these announcements lift prices slightly, with LINK extending its recovery and trading above $7.90 on Friday.
Chainlink Price Forecast: LINK could extend gains if it closes above 50-day EMA
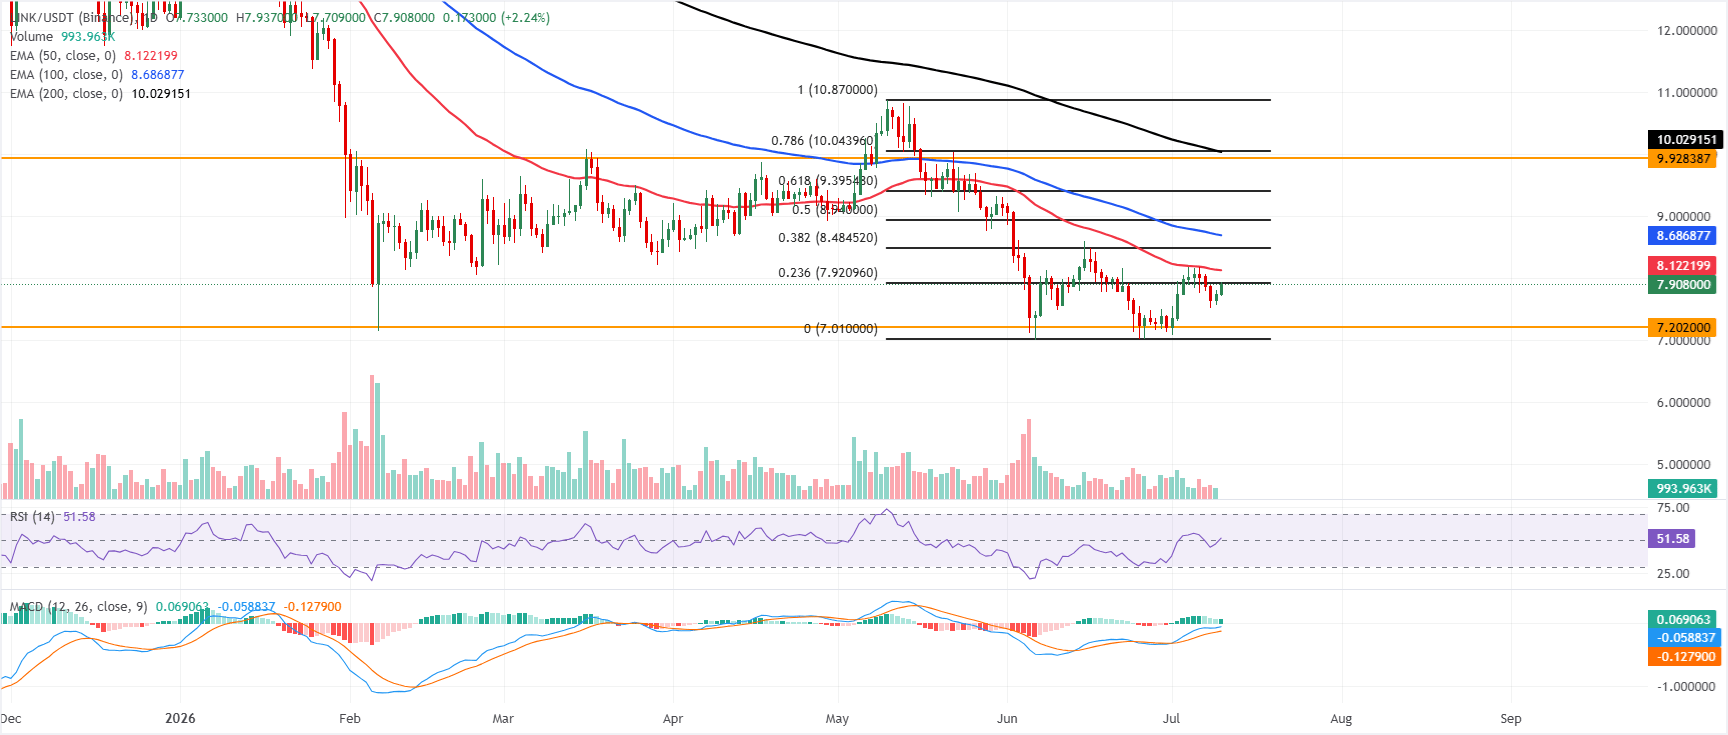
Chainlink price trades at $7.90 on Friday, extending its rebound after mild gains in the previous day. LINK maintains a capped tone as it holds below the 50-day, 100-day, and 200-day Exponential Moving Averages (EMAs), which all cluster well above price.
The immediate cap emerges at the 23.6% Fibonacci retracement at $7.92, with the 50-day EMA next near $8.12, while the Relative Strength Index (RSI) is around 51 and a positive Moving Average Convergence Divergence (MACD) reading hints at modest upside momentum that so far fails to dislodge these overhead barriers.
On the topside, initial resistance is seen at $7.92 from the 23.6% Fibonacci retracement, followed by the 50-day EMA at roughly $8.12 and the 38.2% Fibonacci retracement level near $8.48. Further up, the 100-day EMA at about $8.68 and the 50% retracement around $8.94 form a thicker supply band ahead of $9.40 and the horizontal cap near $9.93.
On the downside, support is scarce until the horizontal floor around $7.20, with the Fibonacci anchor near $7.01 acting as a deeper line of defense should sellers regain control.
(The technical analysis of this story was written with the help of an AI tool. Know more.)












Leave a comment