

Dogecoin (DOGE) trades below $0.08000 on Wednesday, maintaining a steady decline for the seventh straight week, with a 4% drop the previous day. The meme coin is losing its retail strength as DOGE futures Open Interest drops 10% in 24 hours, while institutional demand remains muted with zero inflows so far this week.
From a technical standpoint, DOGE nears a make-or-break point near its June 6 low of $0.0776 with the Relative Strength Index flashing a bullish divergence.
Dogecoin loses its grip on retail demand
Dogecoin is losing demand in the retail space as broader market risk-off sentiment intensifies, with Bitcoin (BTC) closing in on $60,000. CoinGlass data shows a 10% drop in DOGE futures Open Interest to $1.05 billion over the last 24 hours, indicating a sharp decline in positional buildup. At the same time, the funding rate has dipped to 0.0025%, suggesting that traders are willing to buy a short position for a premium, anticipating further downside in the meme coin.
Notably, $6.85 million in total liquidations in DOGE futures over 24 hours was primarily driven by $6.74 million in long liquidations, indicating a clear sell-side bias among traders.

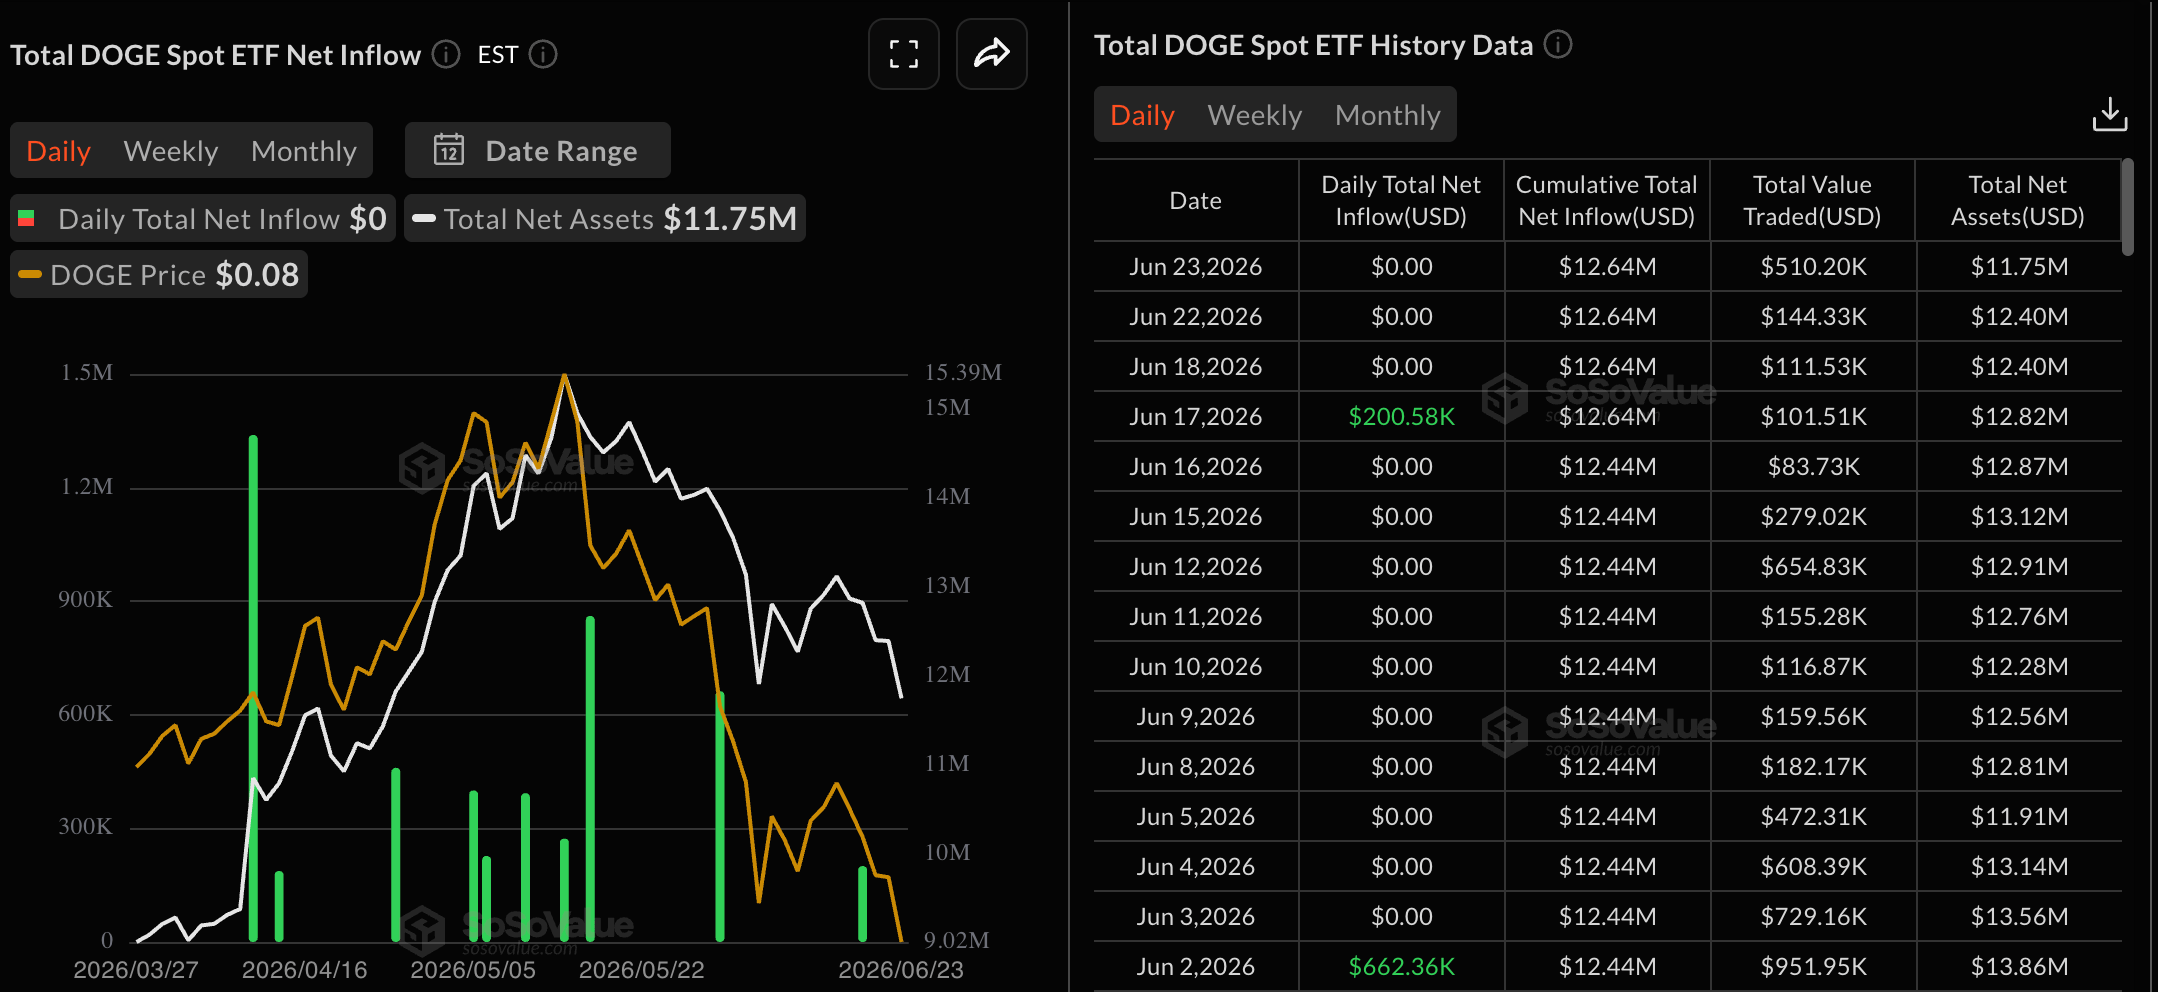
On the institutional side, the DOGE-focused Exchange Traded Funds (ETFs) recorded their third consecutive day of zero inflows on Tuesday, suggesting muted demand from large-wallet investors.
Could Dogecoin defend its line in the sand?
Dogecoin hovers below $0.0800 on Wednesday, maintaining a bearish bias below the 50-day Exponential Moving Average (EMA) at $0.0919 and the 200-day EMA at $0.1154. From a technical perspective, the meme coin remains capped below a descending trendline connecting the May 14 and June 15 highs near $0.0850, reaffirming the bearish bias.
That said, the Relative Strength Index (RSI) at around 28 still lingers in oversold territory, but points to a bullish divergence compared to its June 6 low near 20. Typically, a bullish divergence in the oversold region implies a potential rebound. Still, the Moving Average Convergence Divergence (MACD) is sinking below its signal line, reinforcing the notion of a weak, corrective tone rather than a sustained bullish reversal.
On the downside, initial support is set at $0.0776, with additional cushions at $0.0700 and $0.0641 if selling resumes.

On the topside, a recovery would first need to clear the trendline resistance around $0.0851, before challenging the 50-day EMA at $0.0919 and the horizontal barrier at $0.1000.
(The technical analysis of this story was written with the help of an AI tool.)


Leave a comment