

Ripple (XRP) and Stellar (XLM) are trading under pressure on Tuesday as bulls lose steam. XRP faces rejection near key resistance, while XLM continues its pullback so far this week. Despite the ongoing correction, mixed on-chain and derivatives metrics suggest traders remain cautiously optimistic for these altcoins.
Mixed sentiment among derivatives traders
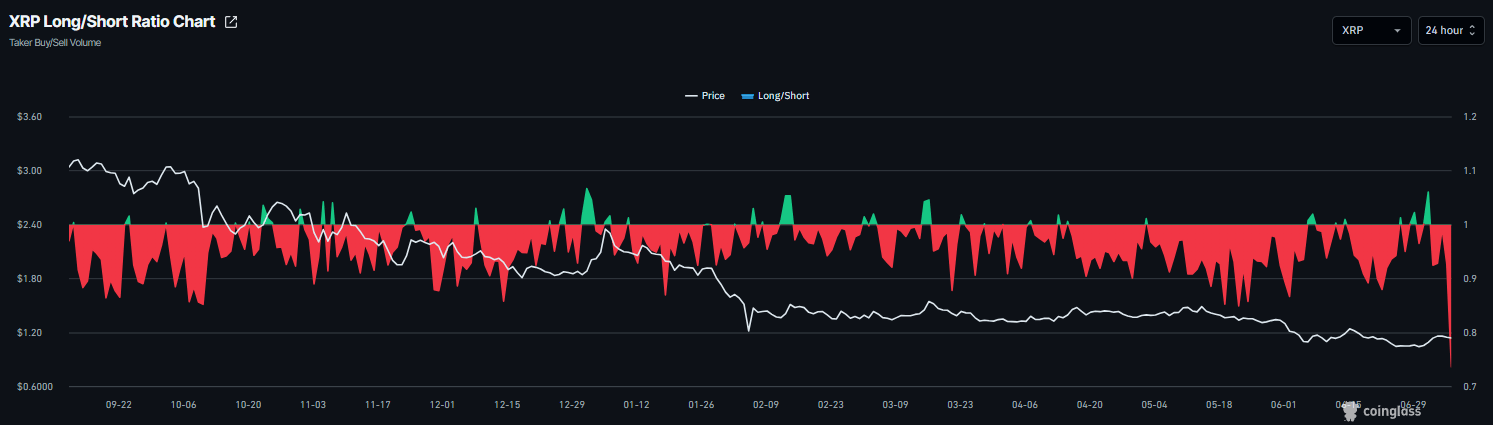
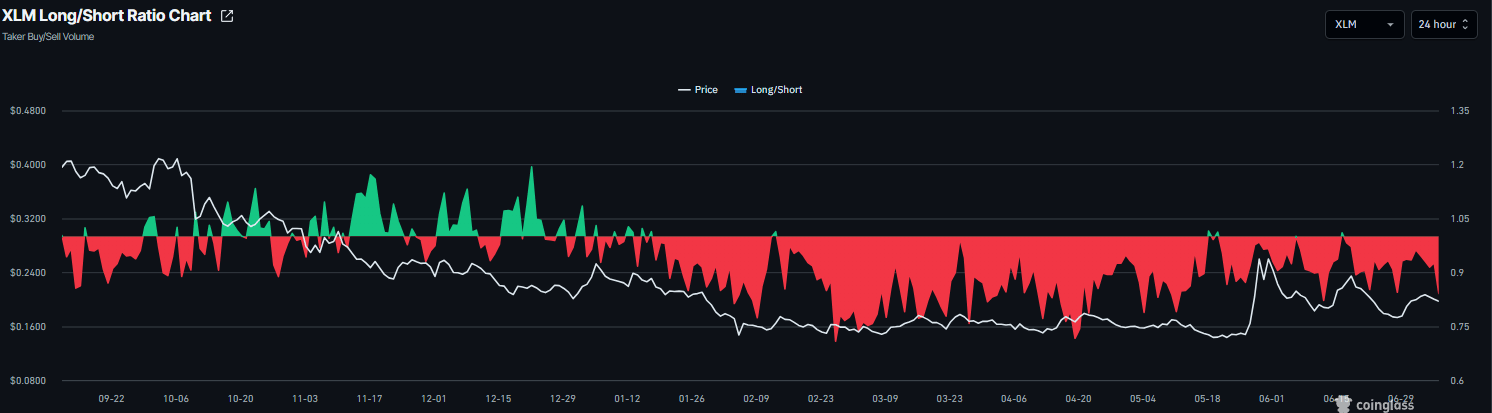
Derivatives data shows a mixed outlook. CoinGlass’ long-to-short ratio for XRP reads 0.73 on Tuesday, the lowest level over a month. During the same period, XLM’s long-to-short ratio stands at 0.84, nearing the lowest level over a month. This ratio, being below 1, reflects bearish sentiment in the market, as more traders are betting the asset’s price will fall.
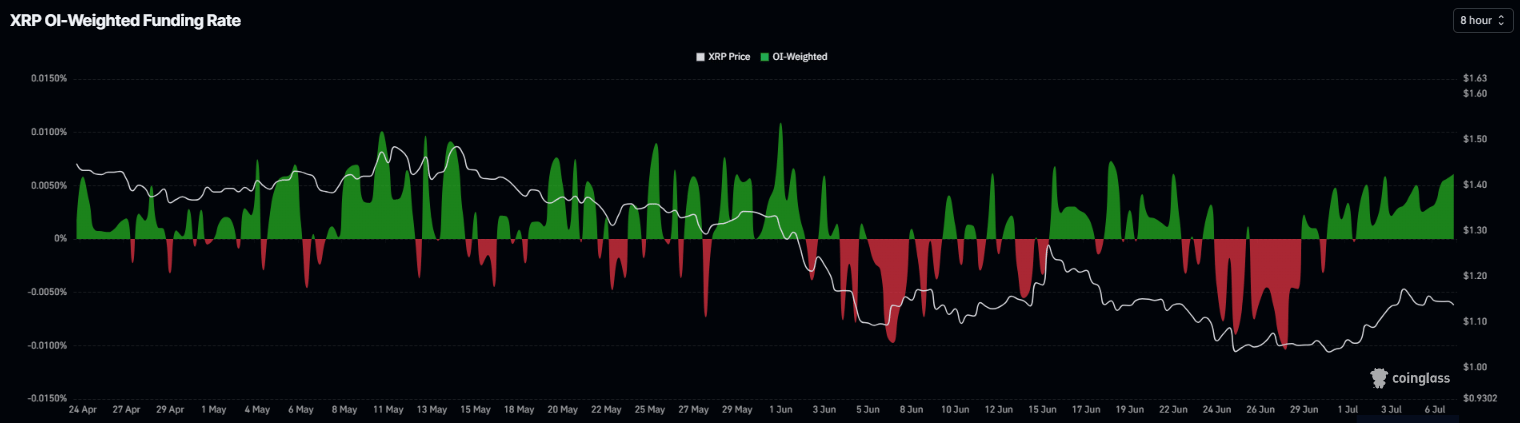
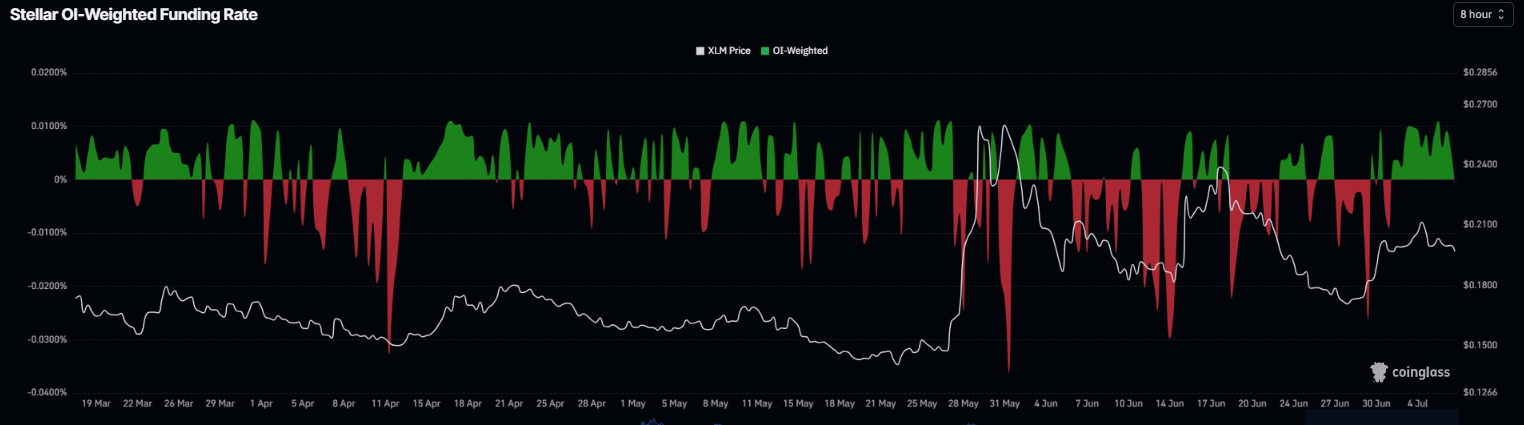
However, XRP and XLM funding rates remain positive, at 0.0061% and 0.0058%, respectively, on Tuesday. These positive rates indicate that longs are paying the shorts, suggesting bullish sentiment.
On-chain metrics show cautious optimism
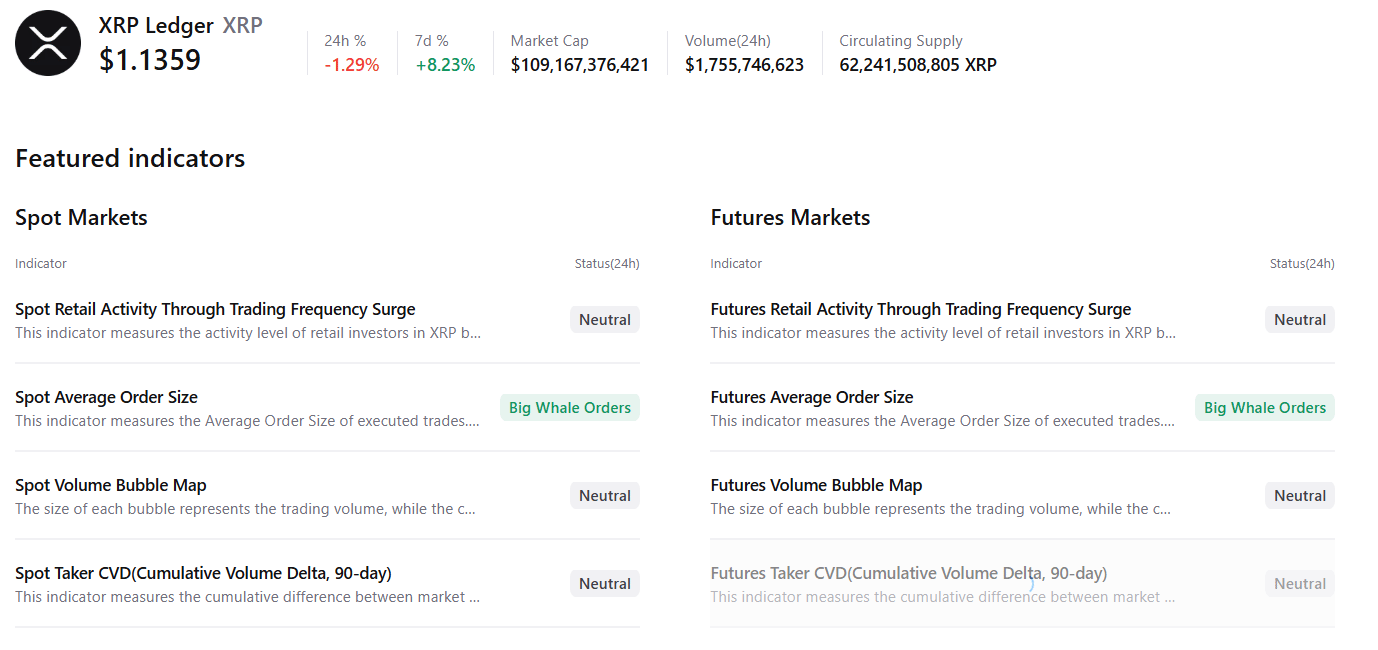
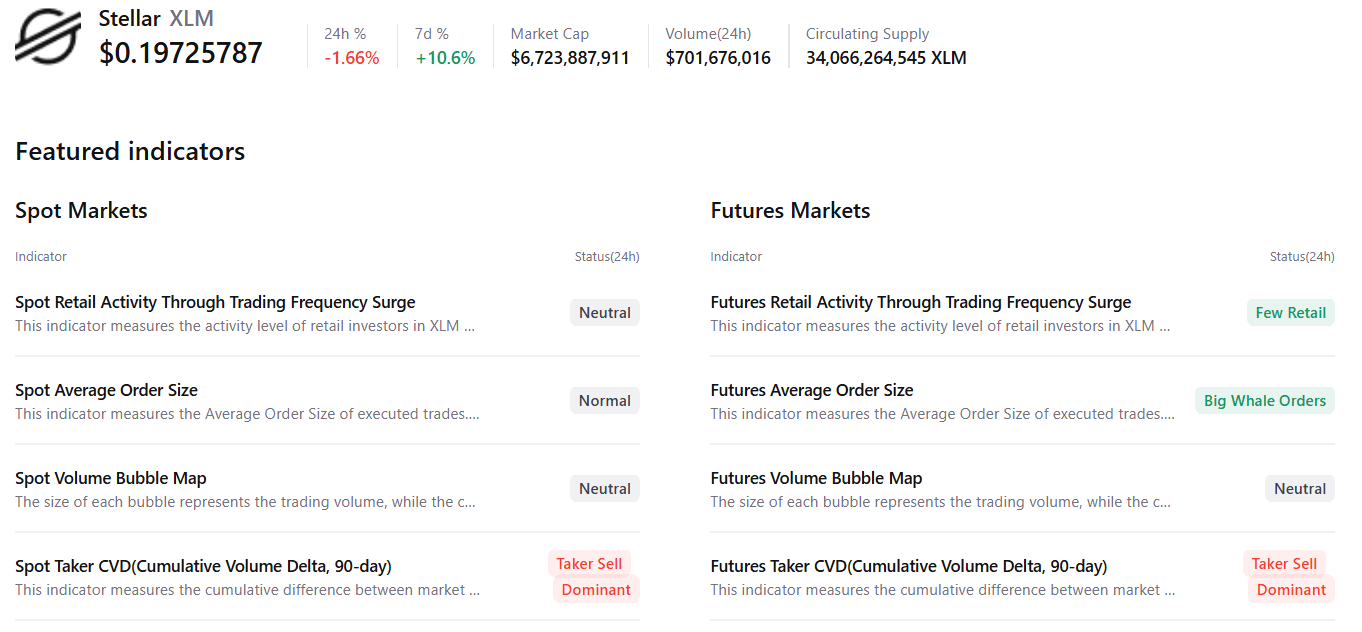
CryptoQuant’s summary data shows cautious optimism. XRP’s spot and futures markets show large-whale orders, with neutral conditions on other metrics, supporting a potential recovery. However, XLM shows selling-side dominance in both markets, with mixed retail activity and large-whale orders in the futures market, hinting at cautious sentiment among traders.
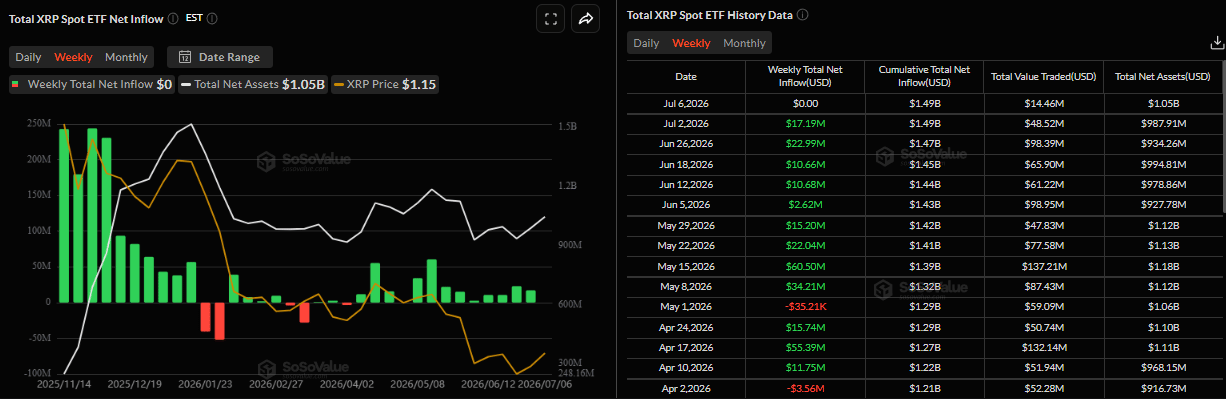
SoSoValue data shows institutional demand began the week with a neutral tone. Spot Exchange-Traded Funds (ETFs) were muted on Monday, following a net inflow of $17.19 million last week. If this inflow trend continues and intensifies this week, XRP could see a recovery ahead.
XRP technical outlook: Faces rejection from 50-day EMA
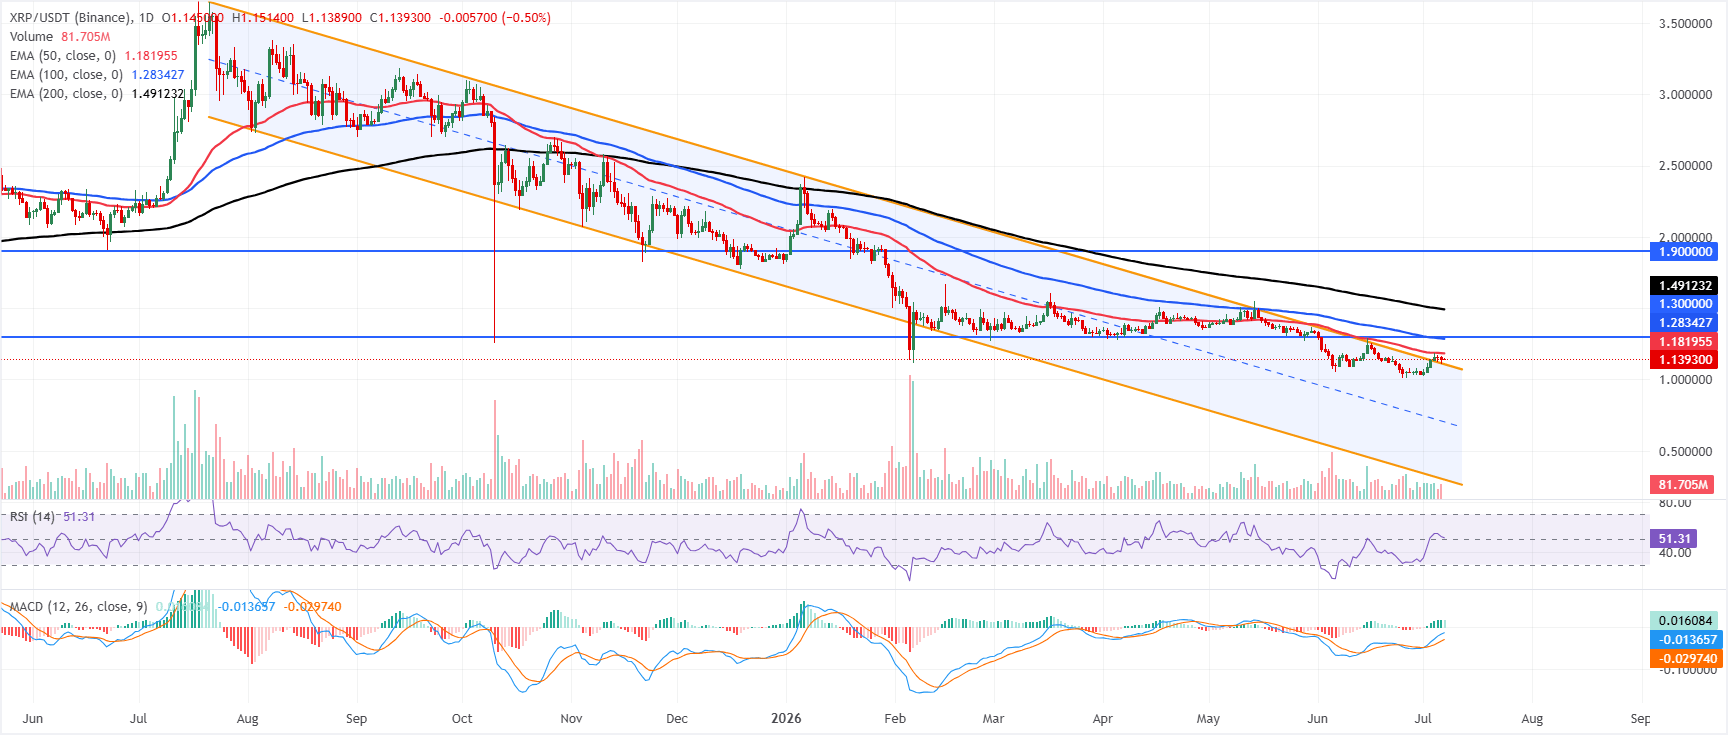
XRP price trades at $1.1393 on Tuesday, maintaining a bearish near-term tone as it remains below the 50-day Exponential Moving Average (EMA) at $1.1820, the 100-day EMA at $1.2834 and the longer-term 200-day EMA at $1.4912.
The downward parallel channel offers a modicum of structure, with price holding above its lower band around $1.1054, while the Relative Strength Index (RSI) hovers near a neutral 51, and the Moving Average Convergence Divergence (MACD) stays in positive territory but shows a slight loss of momentum, hinting at a capped recovery rather than a decisive trend reversal.
On the topside, immediate resistance emerges at the 50-day EMA at $1.1820, followed by the 100-day EMA at $1.2834 and the horizontal barrier at $1.3000, with the 200-day EMA at $1.4912 and the prior resistance line near $1.9000 marking higher hurdles for any sustained advance.
On the downside, initial support aligns with the lower boundary of the descending channel around $1.1054, and a clear break below this floor would reinforce the prevailing bearish bias and open the door to a deeper pullback in the coming sessions.
XLM technical outlook: Finds support around key levels
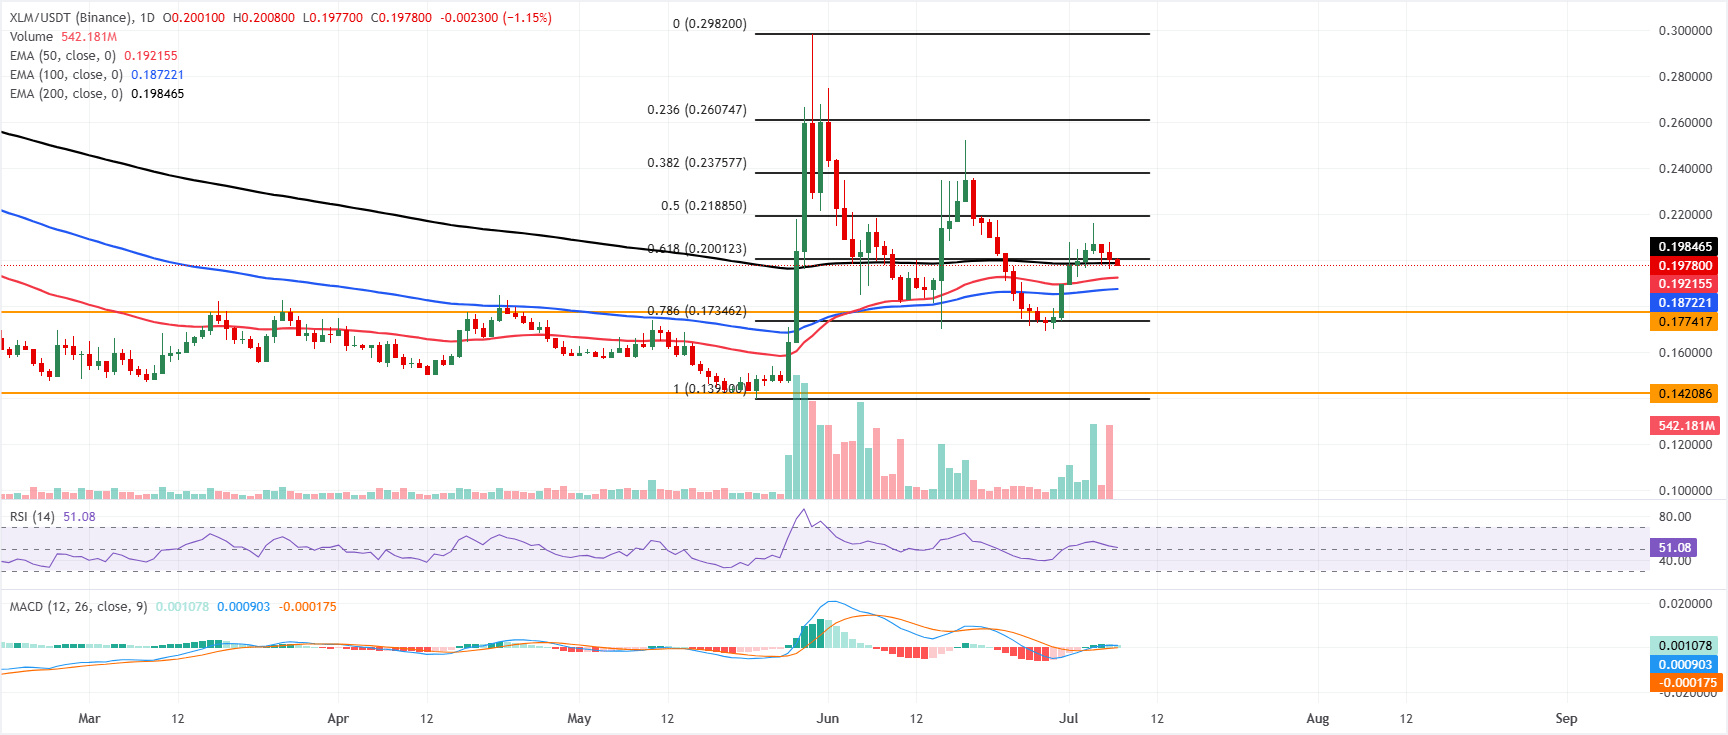
XLM price trades at $0.1978 on Tuesday, holding above the 50-day and 100-day EMAs at $0.1922 and $0.1872, reinforcing a mildly bullish near-term bias. The pair is still capped just underneath the 200-day EMA at $0.1985 and the 61.8% Fibonacci retracement at $0.2001, while the RSI around 51 and a positive MACD line above zero suggest steady but not overextended upside momentum.
On the topside, initial resistance is at the 200-day EMA at $0.1985, followed closely by the 61.8% Fibonacci retracement at $0.2001, with higher hurdles at $0.2188 and $0.2376 before the next Fibonacci barrier at $0.2607.
On the downside, immediate support is seen at the 50-day EMA at $0.1922, ahead of the 100-day EMA at $0.1872, while a horizontal level at $0.1774 and the 78.6% Fibonacci retracement at $0.1735 guard against a deeper pullback before the more distant structural floor near $0.1421.
(The technical analysis of this story was written with the help of an AI tool. Know more.)











Leave a comment