

Decentralized Finance (DeFi) tokens exhibit mixed signals on Wednesday, with Uniswap (UNI) slightly pulling back from an early-week rally to highs around $3.73, while Aster (ASTER) extends its recovery near $0.80. Bitcoin (BTC) holds above $65,000 following a rejection at June highs around $67,000.
The segment’s total market capitalization remains just under $70 billion, up 5% over the past 24 hours. Block Street (BSB), Magma Finance (MAGMA), and TRIA (TRIA) are also among the best-performing tokens, according to CoinGecko.
In the meantime, investors remain cautious ahead of the Federal Reserve’s (Fed) interest rate decision later in the day, which is widely expected to leave rates unchanged in the 3.50%-3.75% range.
Traders will be closely monitoring Fed Chair Kevin Warsh’s post-meeting press conference for forward guidance, as surging inflation, now at a three-year high, heightens sensitivity to any signals on future monetary policy.
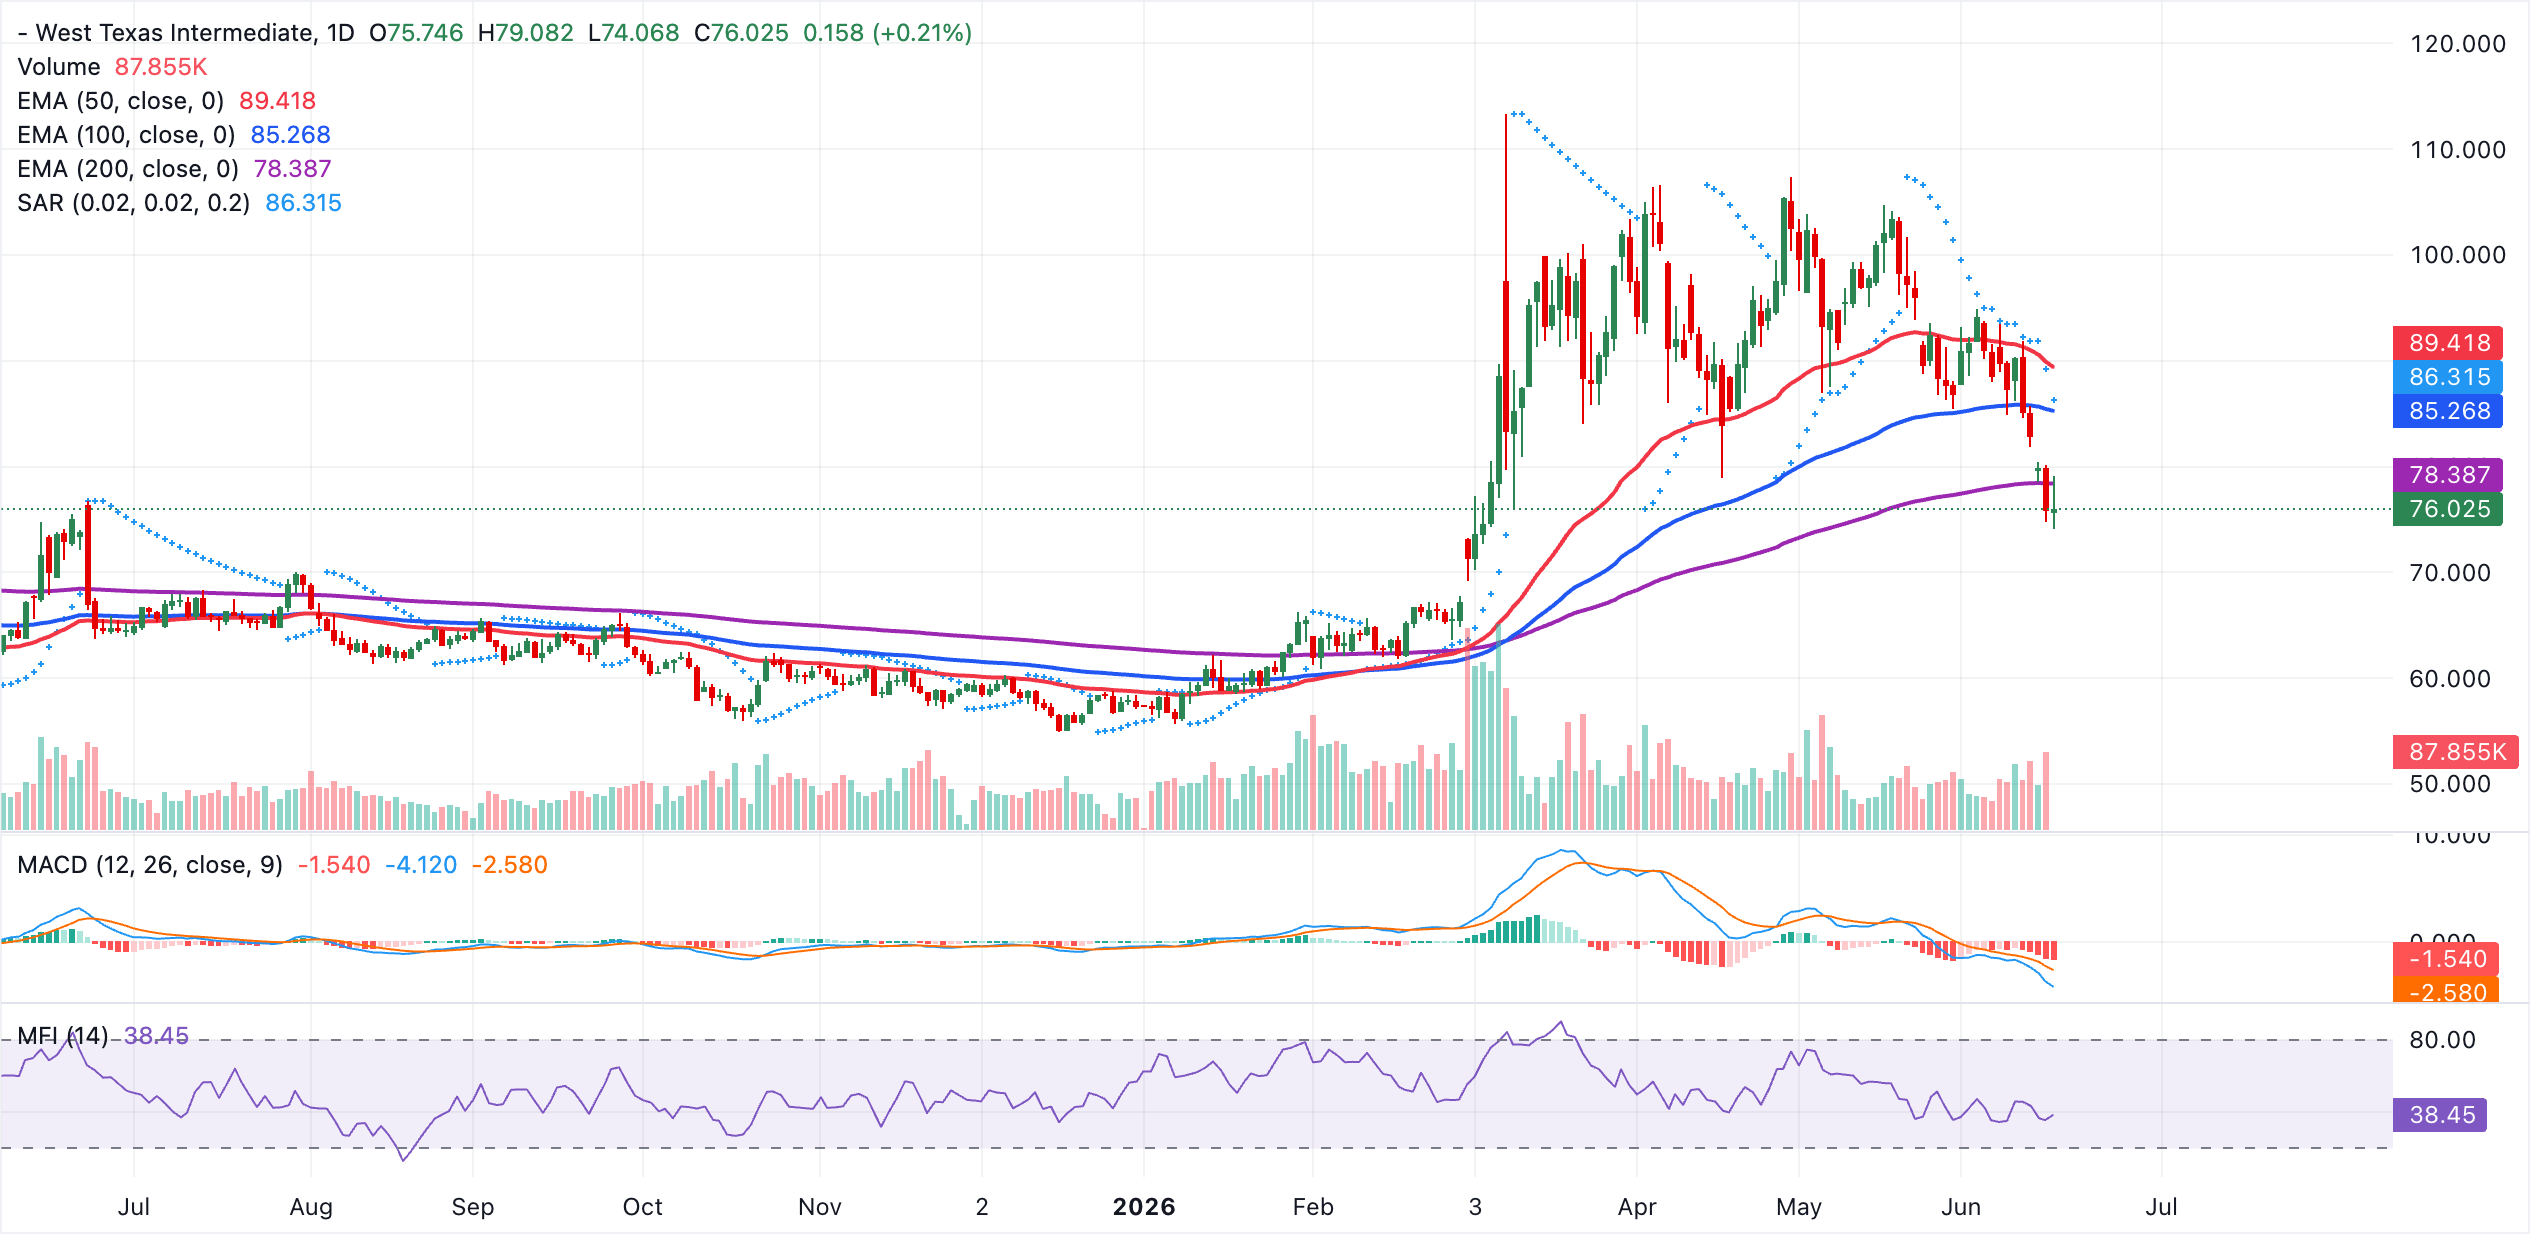
On the bright side, the United States (US) and Iran are scheduled to sign the Memorandum of Understanding (MoU) on Friday to end the war in the Middle East. The expected reopening of the Strait of Hormuz and the removal of the naval blockade on Iranian ports would ease pressure on global Oil and Gas prices, which had stayed high since the war started. West Texas Intermediate (WTI) Crude Oil is priced at $76, down from June’s high of $95 and $113 recorded in March.
1. Uniswap holds higher support as derivatives scale up
Uniswap trades above the $3.00 short-term support following a correction from highs around $3.73. The DEX token exploded following Standard Chartered’s prediction that institutional adoption of its blockchain infrastructure could push it above $6.00 by the end of this year and to $100 by 2030.
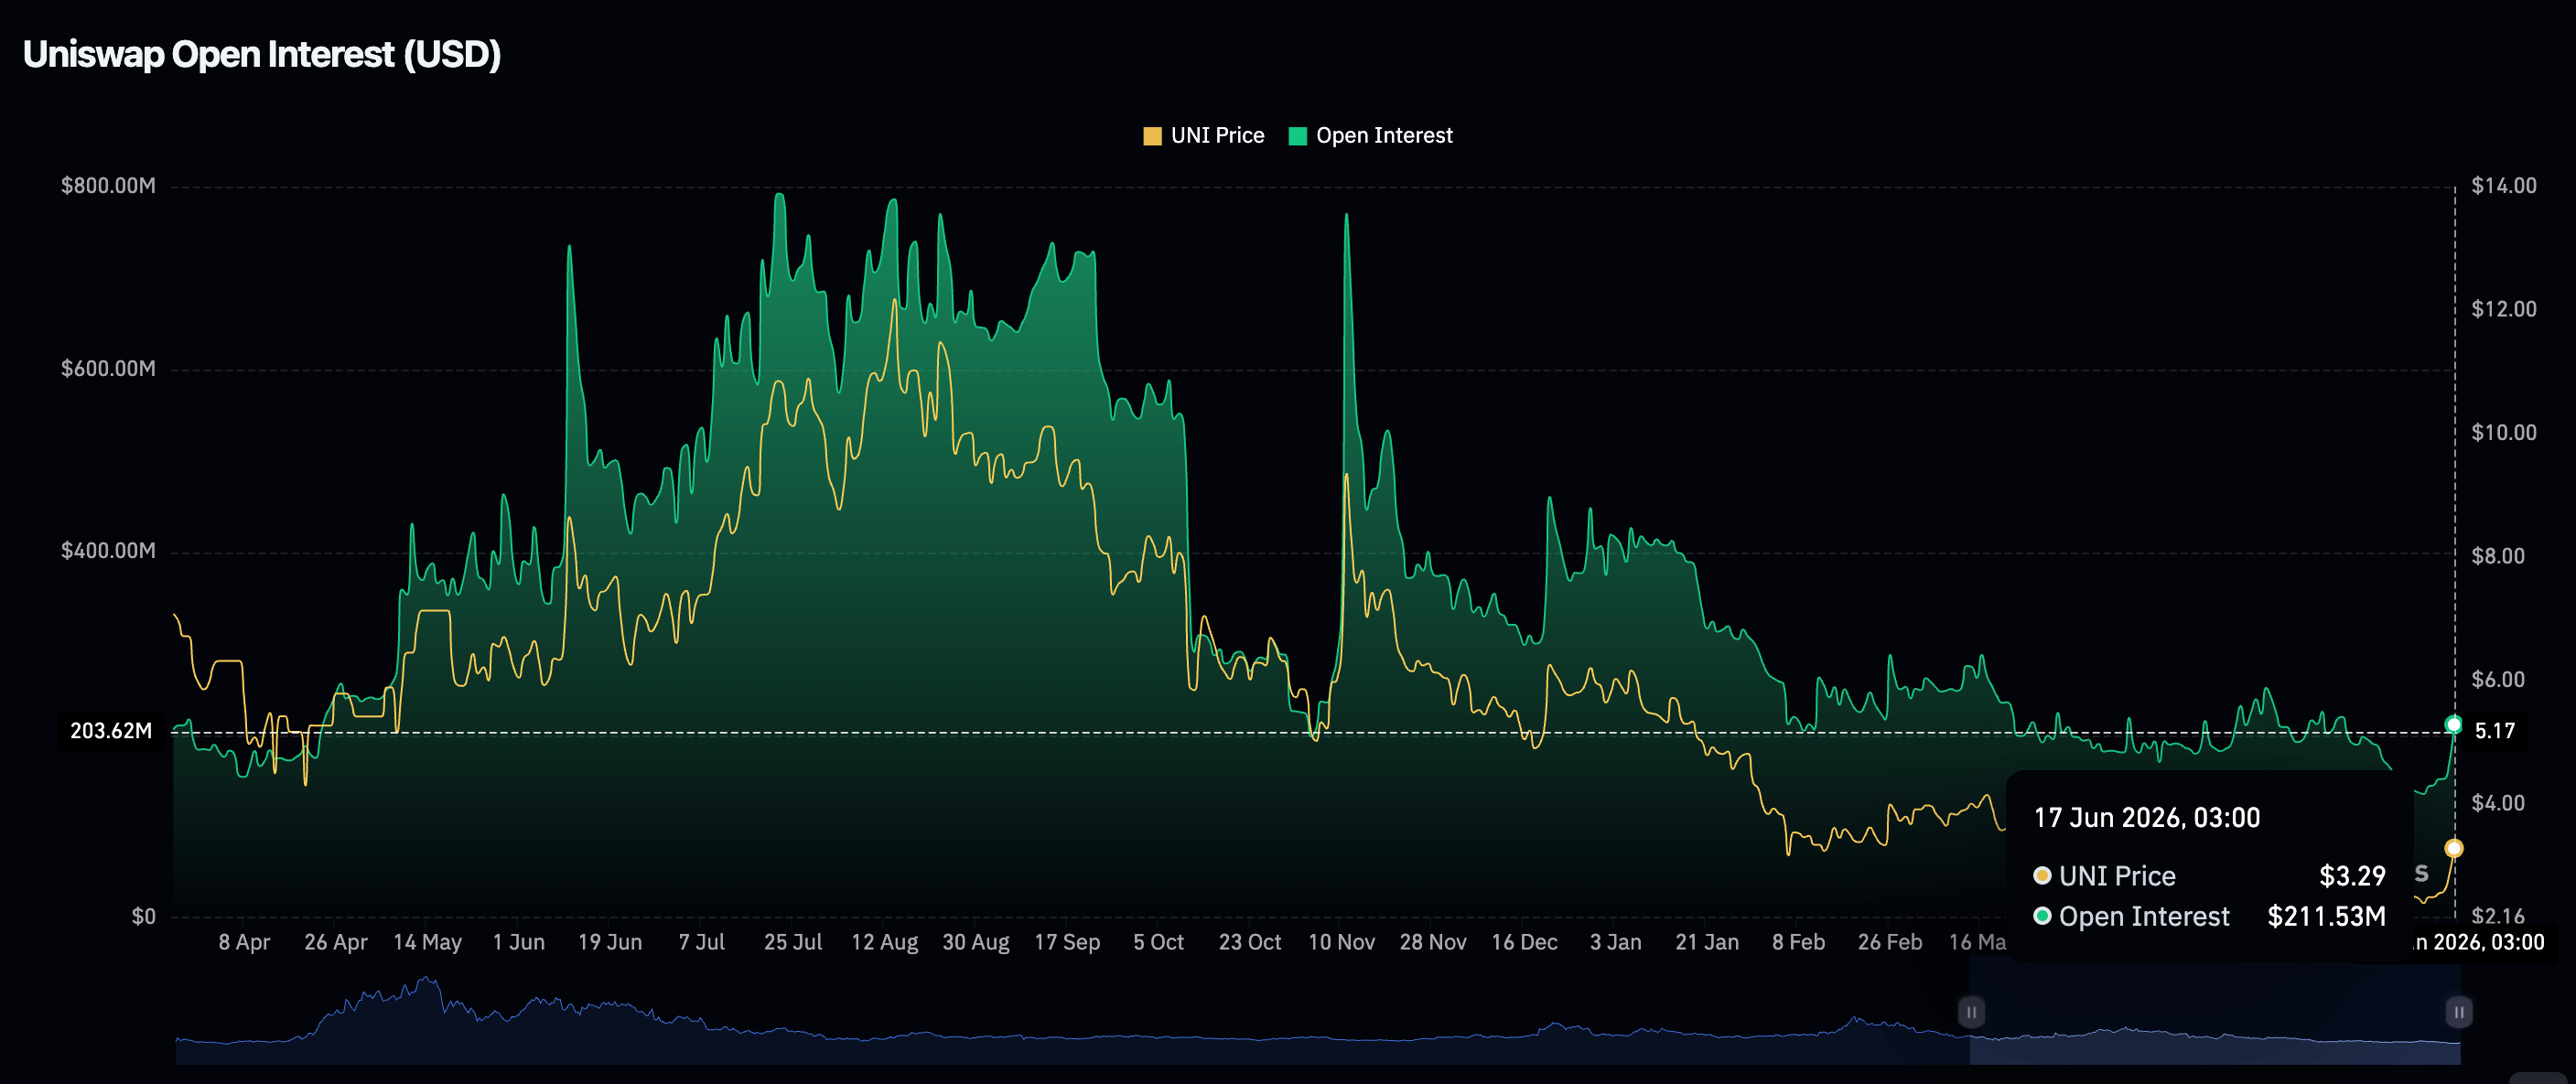
Retail appetite for UNI derivatives returned, amounting to a perpetual Open Interest (OI) of $212 million on Wednesday, up from $168 million the day before. CoinGlass data shows a narrowing to $144 million on Friday, underscoring the surge in retail demand. If investors continue to increase risk exposure by opening new positions, UNI may resume its uptrend, targeting highs above $4.00.
Uniswap remains capped in the short term, holding below the 100-day Exponential Moving Average (EMA) at $3.37 and the 200-day EMA at $4.18, keeping the broader bias tilted to the downside despite the recent rebound. The Moving Average Convergence Divergence (MACD) histogram is in positive territory on the daily chart, while a firm Money Flow Index (MFI) near 63 suggests improving upside momentum within this still constrained setup.
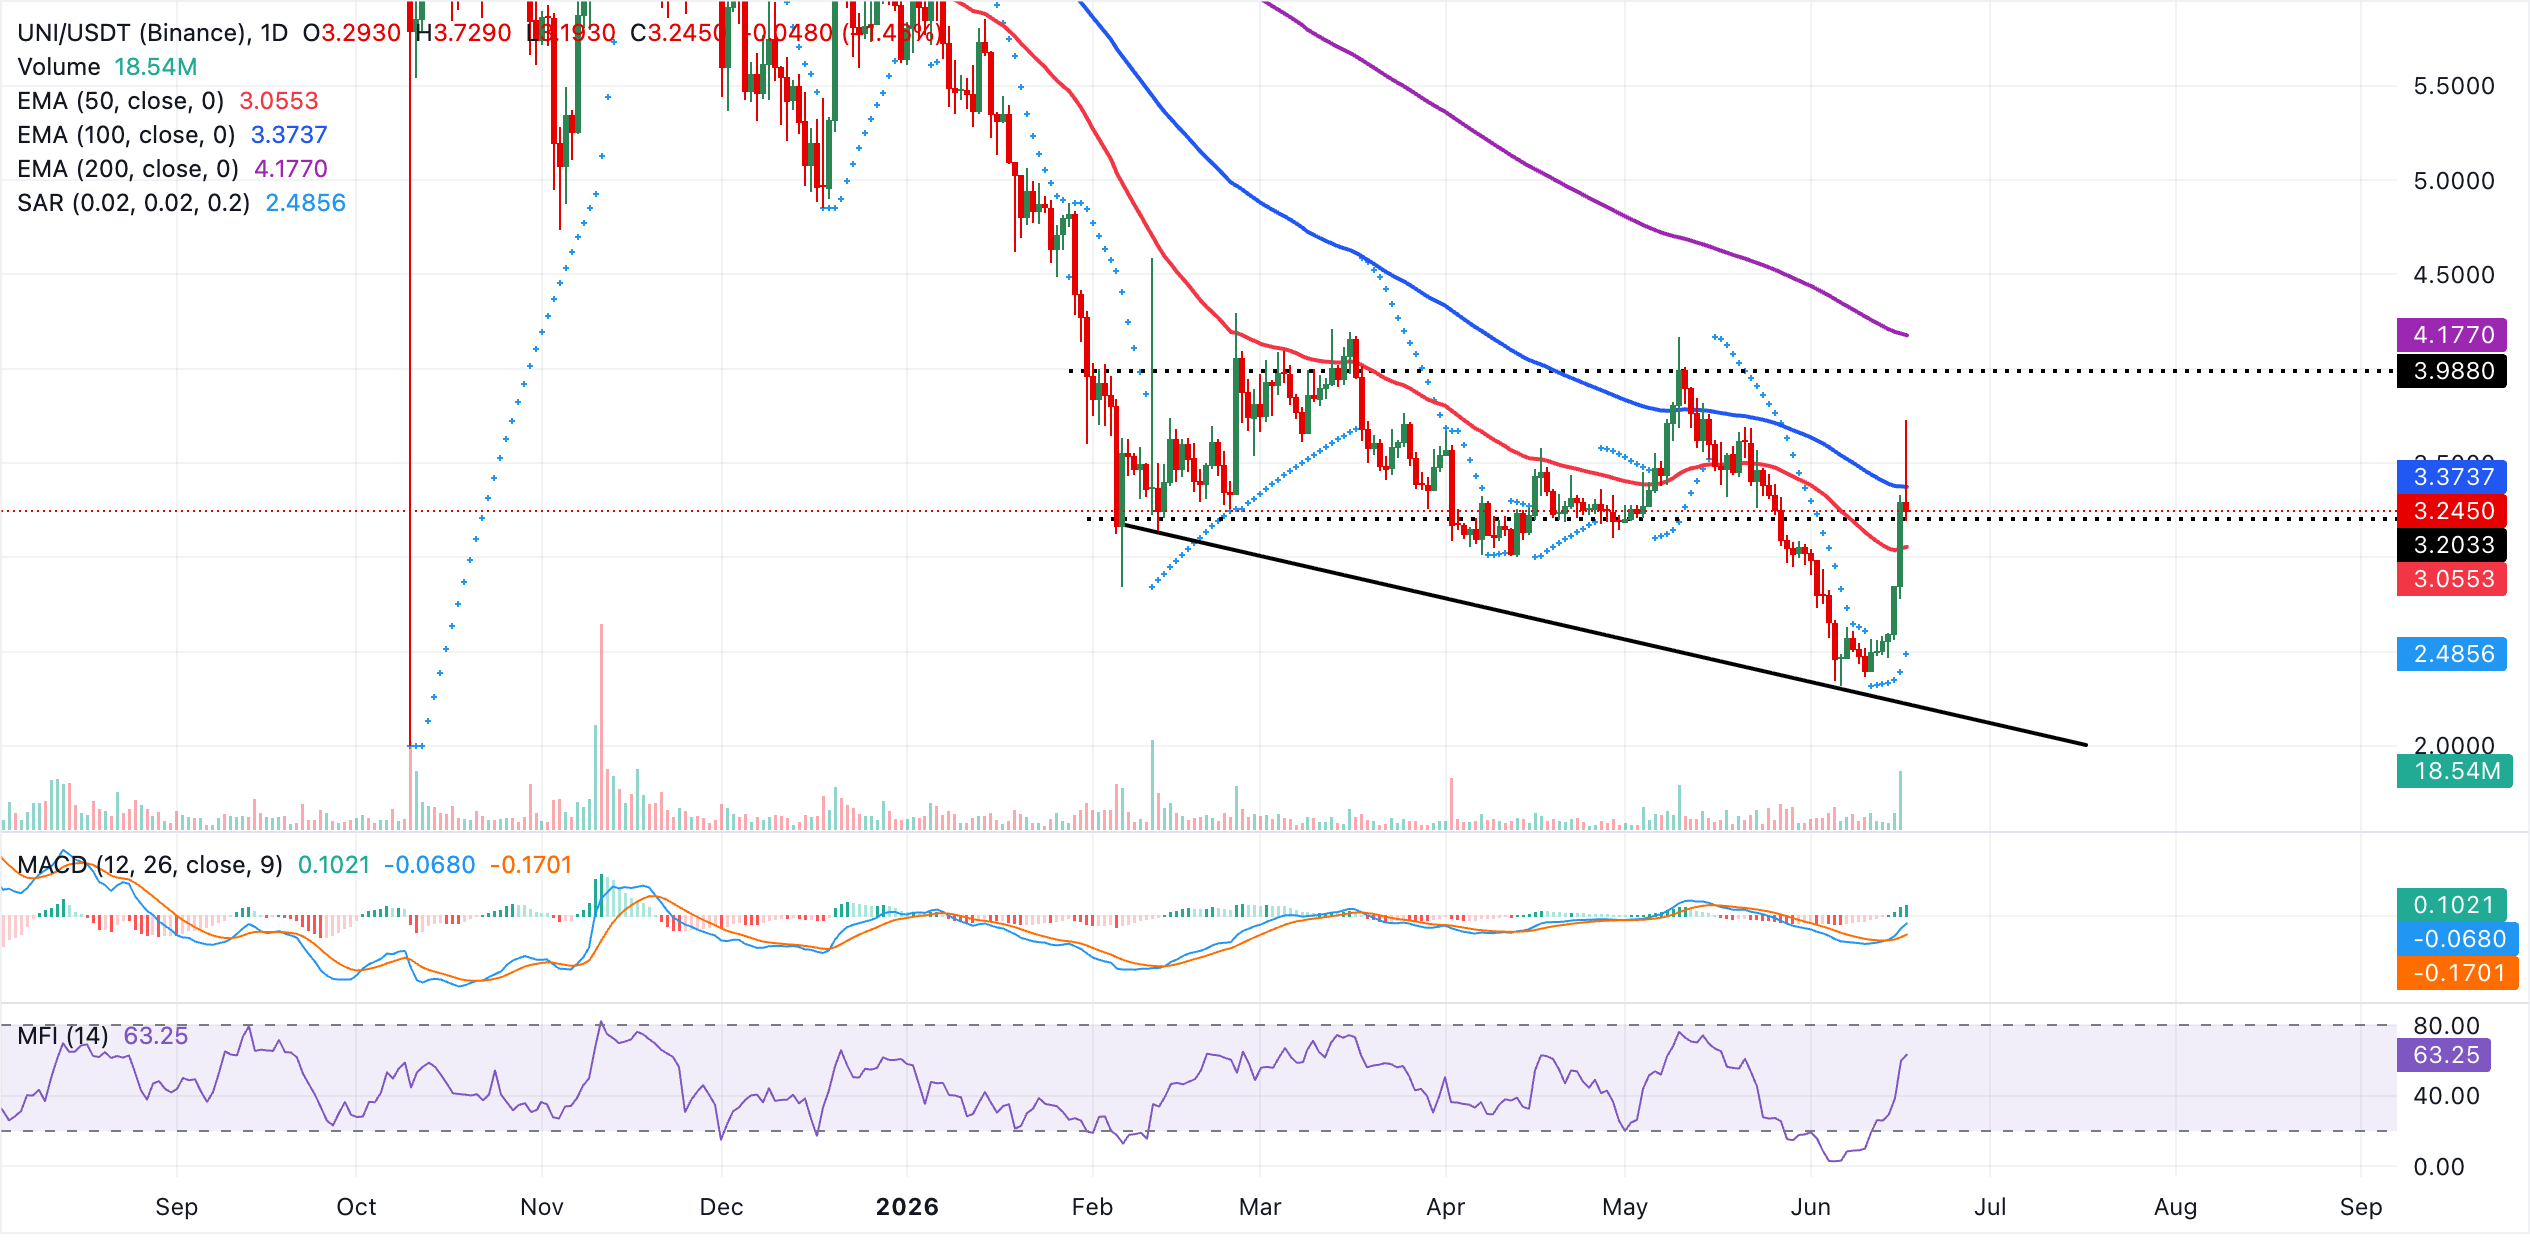
On the topside, initial resistance comes at the 100-day EMA near $3.37, and a sustained break above this barrier would expose the 200-day EMA around $4.18 as the next medium-term cap. Looking down, immediate support lies at the 50-day EMA close to $3.06, with the Parabolic SAR level near $2.49 acting as a deeper floor if selling pressure resumes.
2. Aster bulls build momentum
Aster has staged an impressive breakout, rallying over 15% on Wednesday to approach the critical $0.80 mark at the time of writing. As the native token of a leading perpetual trading platform, ASTR is holding above key technical levels, including key moving averages, indicating strong bullish momentum and increasing the probability of a continued move toward the $1.00 threshold.
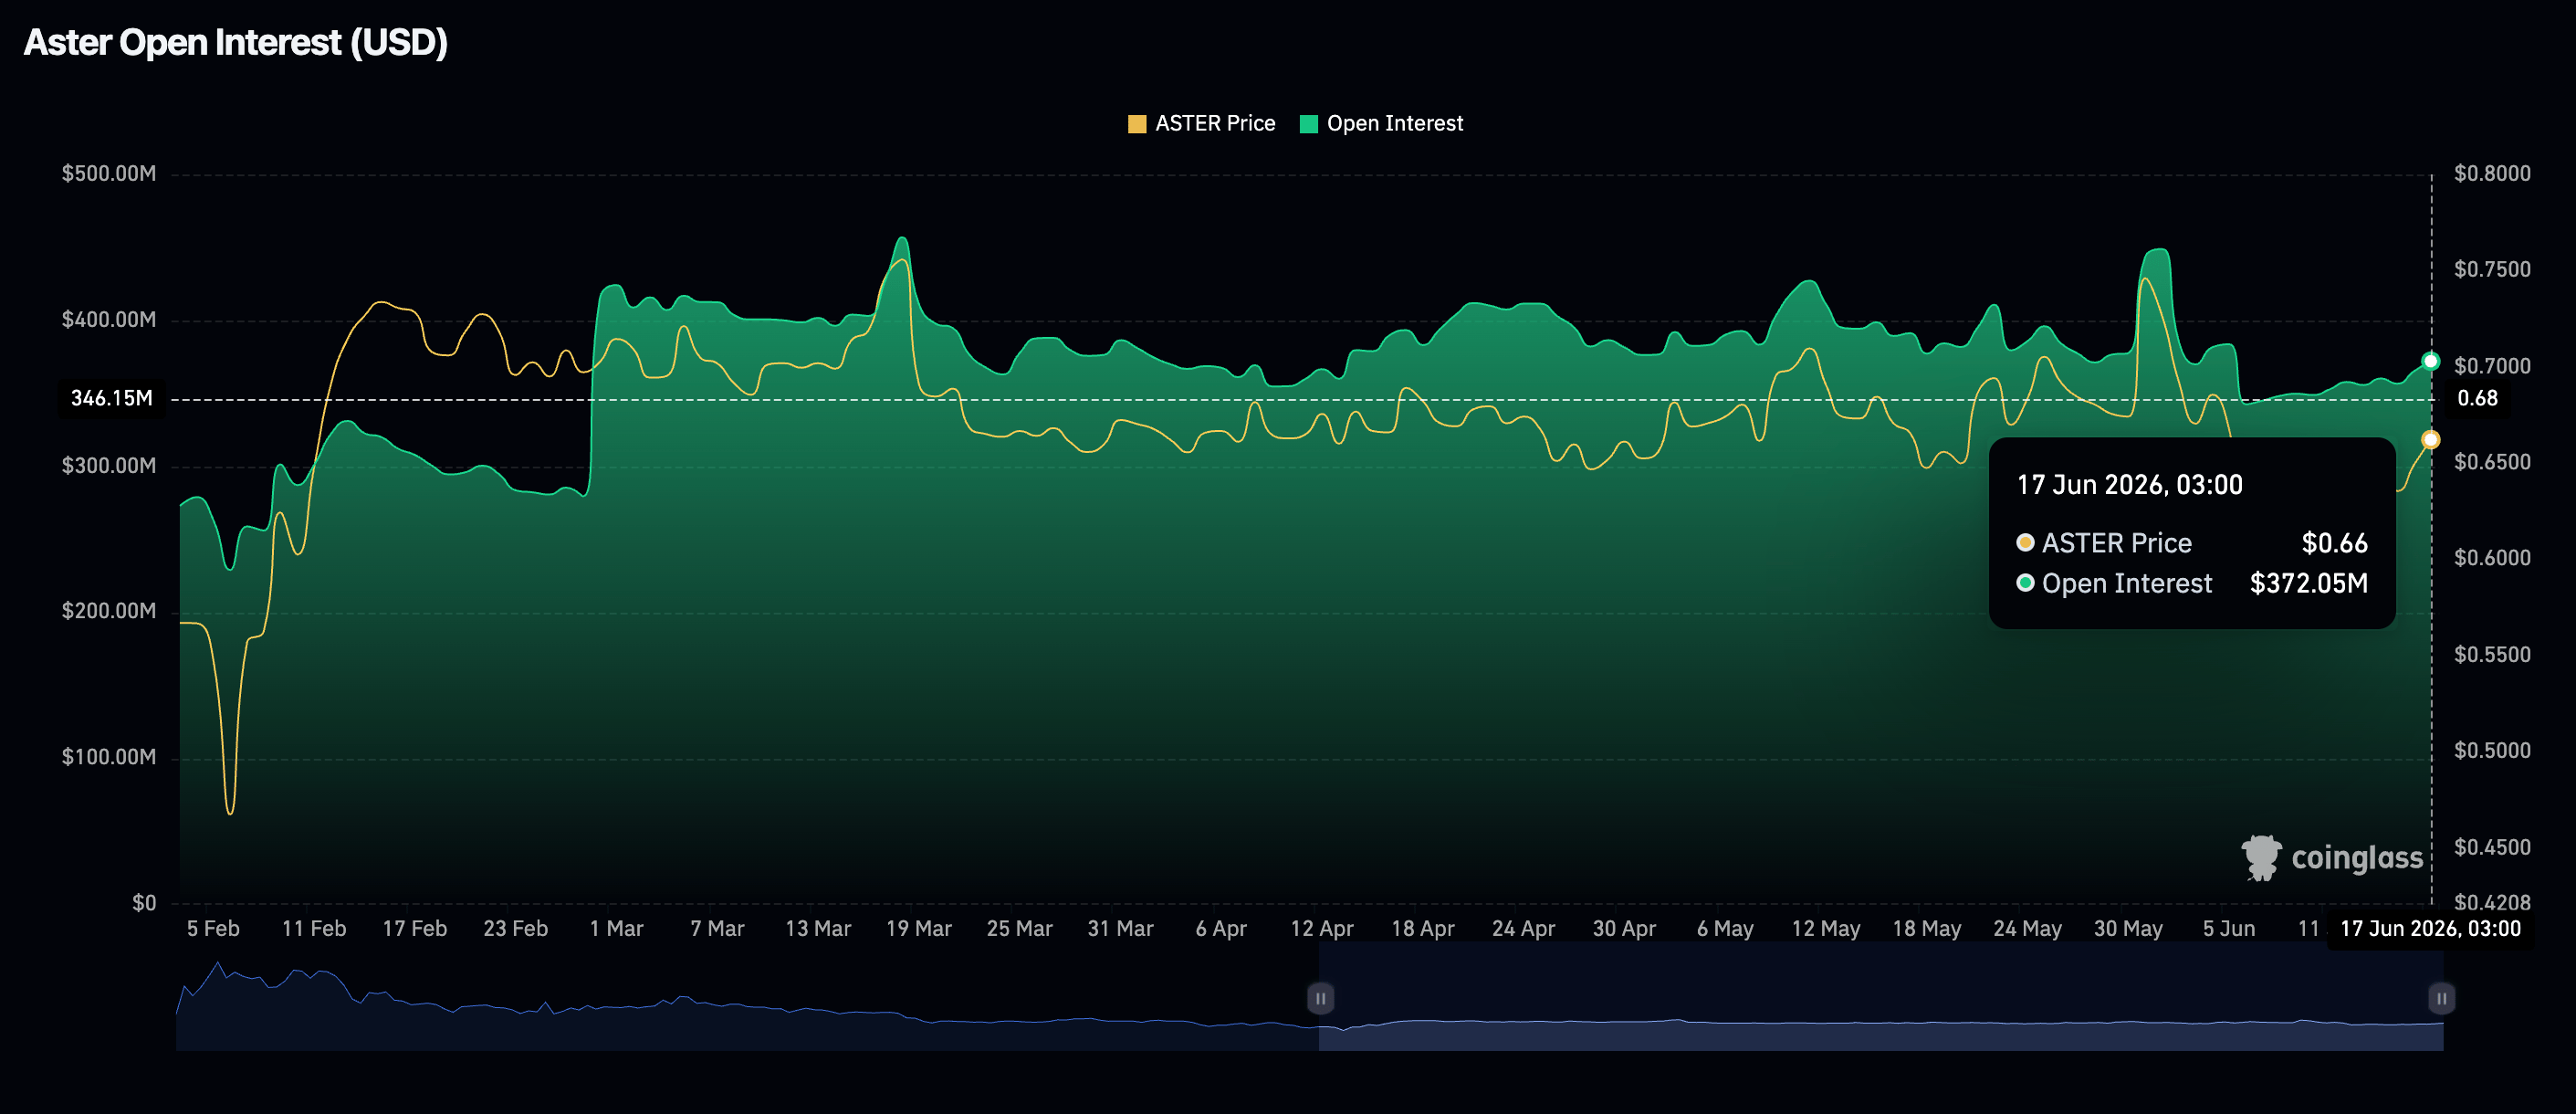
The derivatives market is showing signs of strengthening, with futures open interest rising to $372 million on Wednesday from $365 million the previous day. Sustained growth in the OI will be crucial to confirm the uptrend as investor confidence continues to build.
Aster holds above the 50-day, 100-day and 200-day EMAs, suggesting a constructive near-term bias as price is supported by the broader trend structure. The Parabolic SAR has flipped below price at $0.59, adding to the bullish tone, while the MACD histogram has turned positive on the daily chart, hinting at recovering upside momentum. Moreover, the MFI lingers near the lower band, implying modest buying pressure so far.
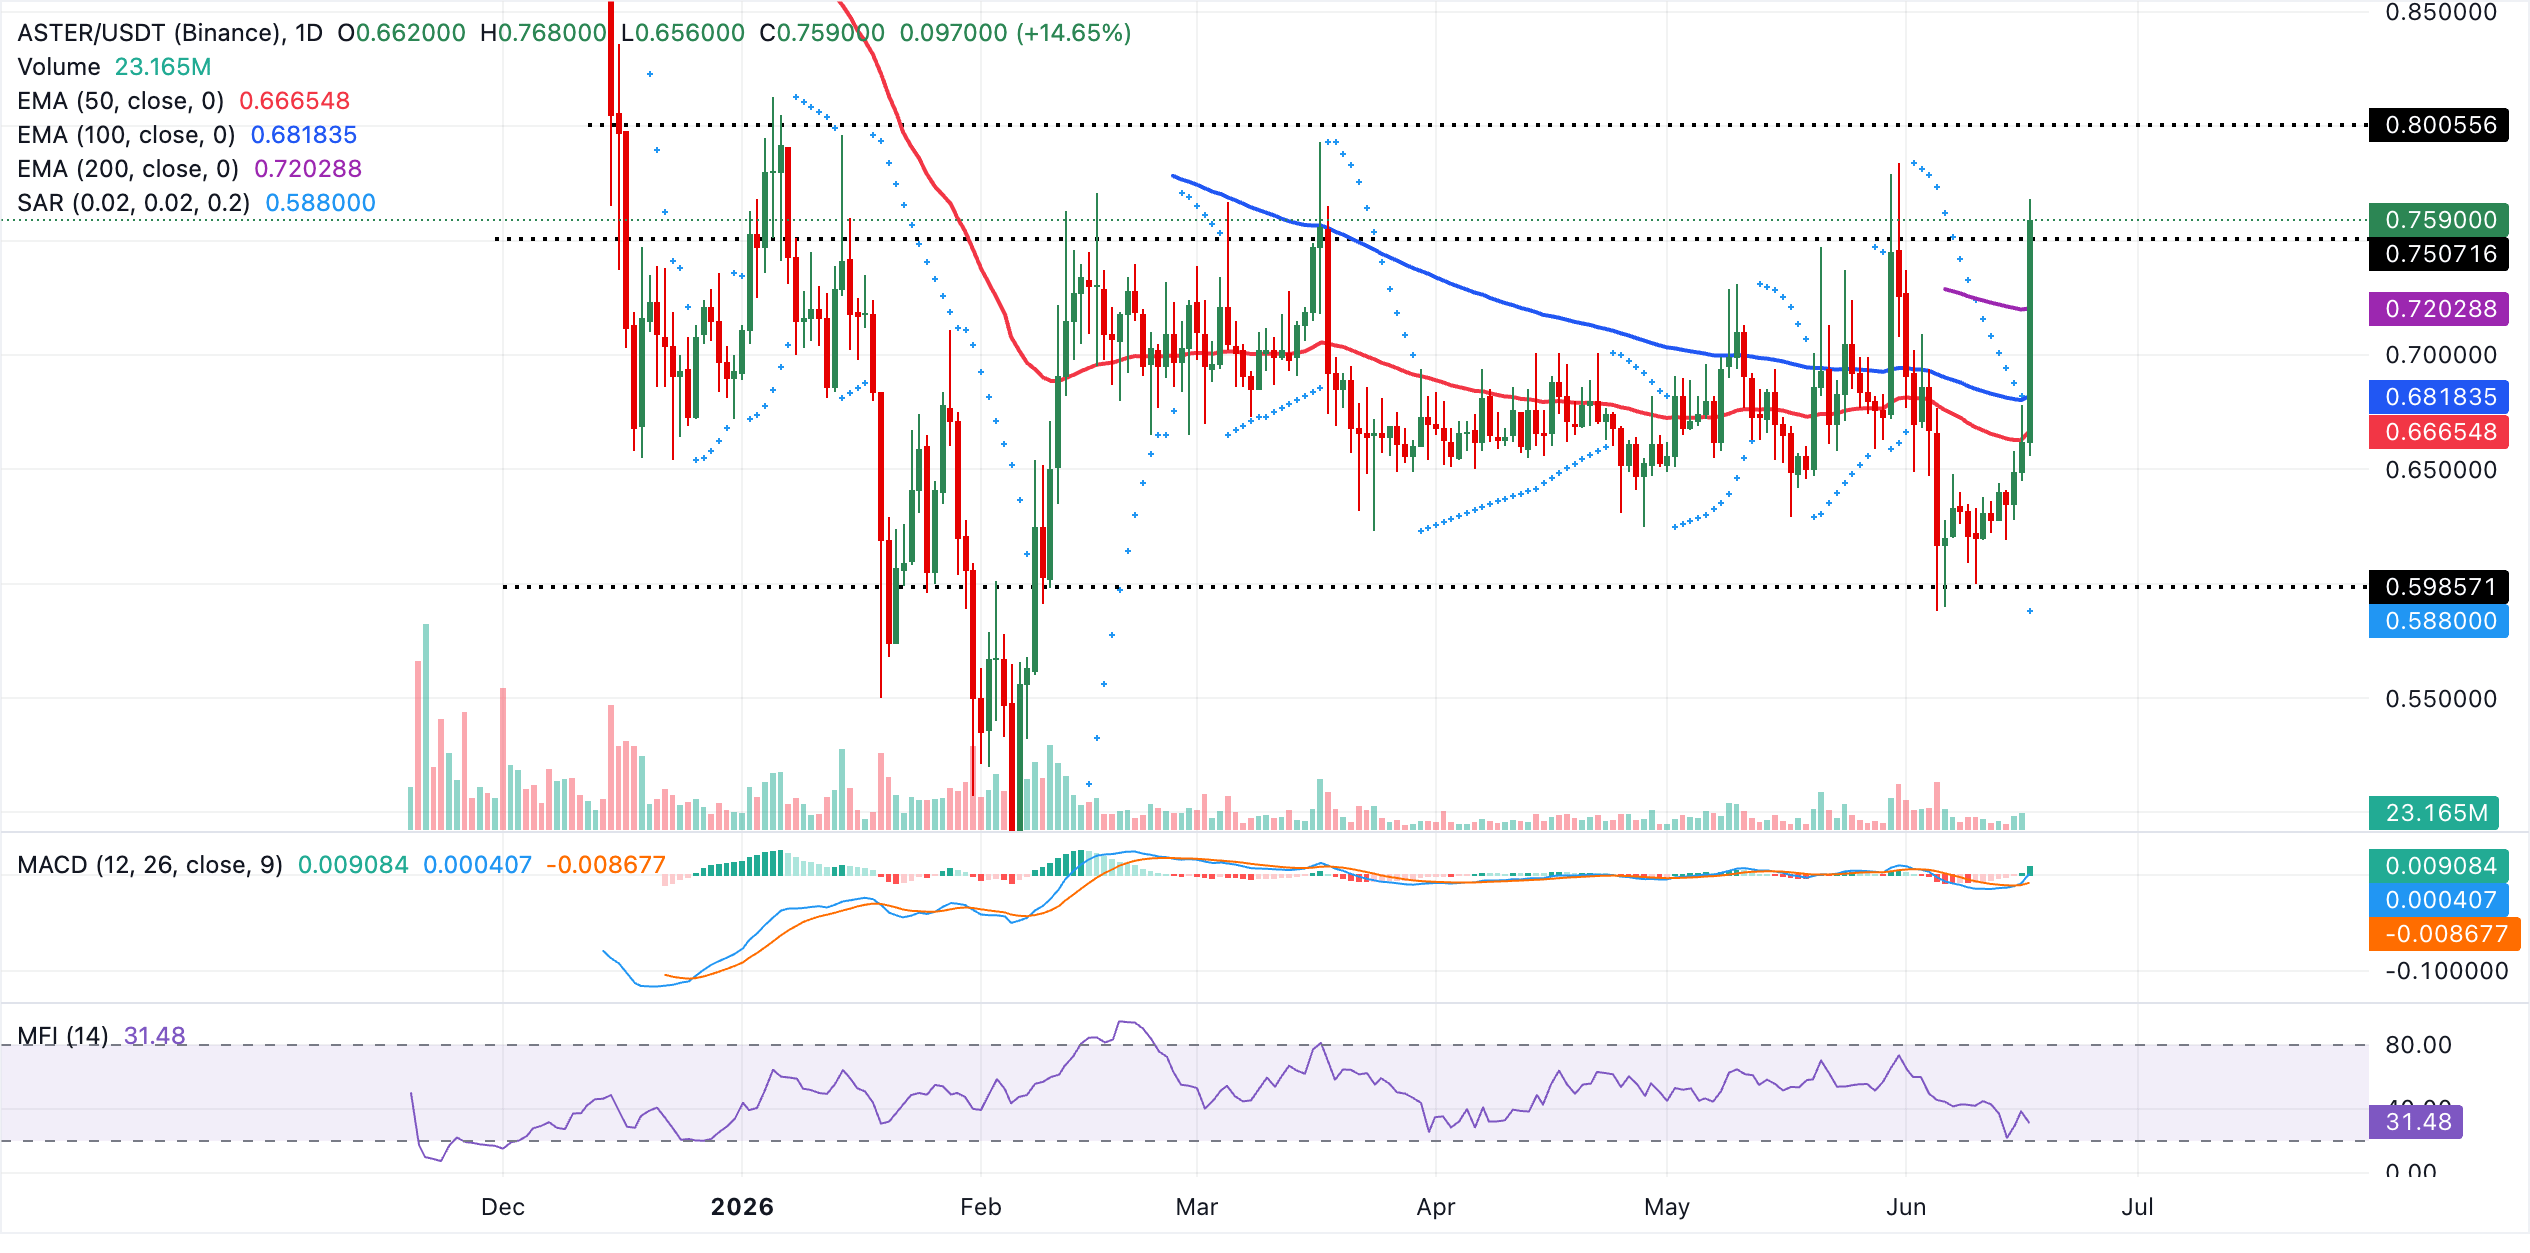
On the downside, immediate support is seen at the recent breakout and pivot area near $0.76, with stronger demand likely emerging at the 200-day EMA around $0.72 if a deeper pullback unfolds. The 100-day EMA at $0.68 and the 50-day EMA at $0.67 line up as additional layers of trend support, ahead of the Parabolic SAR level near $0.59, which guards the broader bullish structure.
(The technical analysis of this story was written with the help of an AI tool.)


Leave a comment