
The Hidden Clock Inside Every Currency Crisis
Most investors think about inflation as a dial that turns slowly, one they can monitor and respond to over time. History tells a different story. The transition from elevated inflation to full currency collapse has repeatedly compressed into timelines far shorter than conventional wisdom suggests. Understanding why this happens, and what it means for wealth preservation, is the foundation of any serious conversation about gold and silver for hyperinflation and currency collapse protection.
Fiat currencies follow recognisable lifecycle patterns. They begin as credible monetary instruments, backed either by commodity reserves or institutional trust. Over decades, fiscal pressures erode that credibility through debt accumulation and monetary expansion. The critical vulnerability is not the debt itself but the point at which market confidence fractures.
Once that fracture occurs, the feedback loop between currency depreciation, rising prices, and accelerating money printing becomes self-reinforcing. Slowing it down requires political will and institutional capacity that governments in crisis rarely possess. For anyone holding paper savings, this timeline is the most important variable to understand when considering precious metals as a protective strategy.
When big ASX news breaks, our subscribers know first
What the Historical Record Actually Shows
The 1970s Stagflation Decade: Numbers in Context
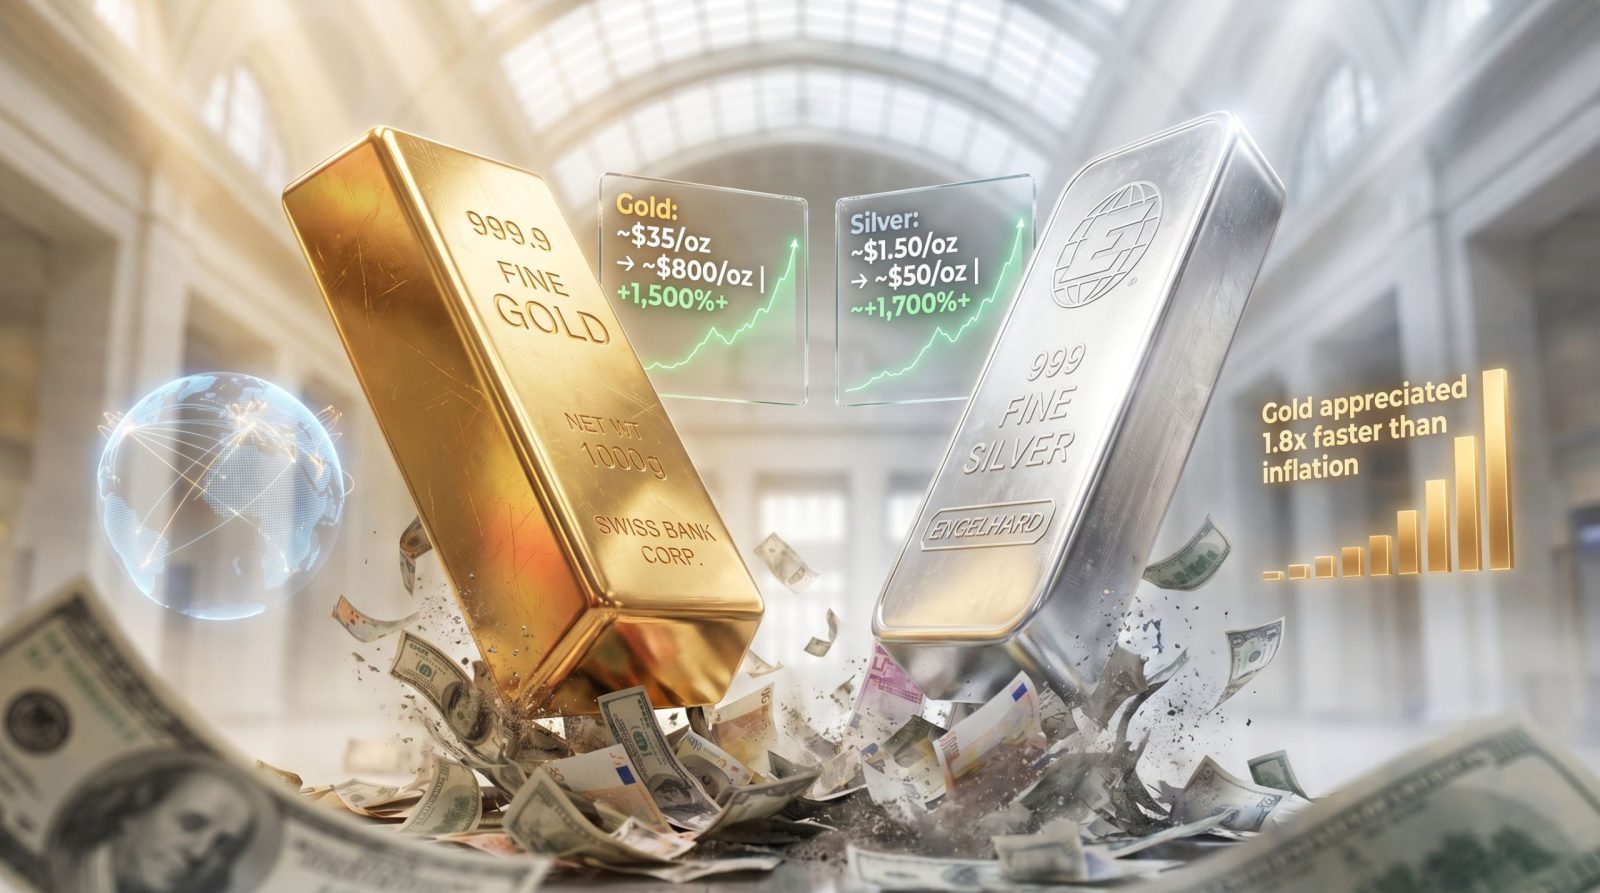
The United States stagflation period of the 1970s remains the most relevant modern precedent for a developed economy experiencing sustained inflationary distress. The Nixon gold shock in August 1971, when President Nixon closed the gold window, saw gold trading at approximately $40 per ounce. By January 1980, it had reached $850 per ounce, representing an appreciation of more than 2,000% from that inflection point.
Silver’s trajectory was even more dramatic, moving from roughly $1.50 per ounce in the early 1970s to a peak of approximately $48 to $50 per ounce in January 1980.
| Asset | Approximate 1971 Price | 1980 Peak | Approximate Gain |
|---|---|---|---|
| Gold | ~$40/oz (post-Nixon shock) | ~$850/oz | ~2,000%+ |
| Silver | ~$1.50/oz | ~$48–$50/oz | ~3,000%+ |
| U.S. Dollar (purchasing power) | Baseline | Severely eroded | Significant real loss |
It is worth noting that silver’s peak was partly amplified by the Hunt Brothers’ attempt to corner the silver market in 1979 to 1980, which inflated the peak price beyond fundamental monetary demand alone. After regulatory intervention, silver collapsed to approximately $10 per ounce by mid-1982, illustrating the volatility profile that distinguishes silver from gold.
The Weimar Episode: What German Hyperinflation Teaches Us
The German hyperinflation of 1919 to 1923 remains the textbook case for understanding how rapidly a previously functional currency can disintegrate. Gold’s price in German marks escalated from approximately 170 marks per ounce before the crisis to approximately 87 trillion marks per ounce at its peak. Silver followed a comparable trajectory, moving from roughly 12 marks per ounce to over 500 billion marks.
The critical insight here is not the nominal price explosion but what these numbers represent. Gold and silver did not become more valuable in absolute terms. They maintained their international purchasing power while the domestic currency became progressively worthless. This distinction matters enormously for understanding the actual function of precious metals during currency crises: they are not appreciation assets in this context but preservation instruments.
Precious metals do not need to increase in value to protect wealth during a hyperinflationary collapse. They simply need to maintain their real purchasing power while everything denominated in the failing currency loses it.
Five Hyperinflationary Cycles: The Pattern That Repeats
Academic research into precious metals performance across multiple hyperinflationary episodes, including work building on Roy Jastram’s landmark study spanning 250 years of precious metals purchasing power, consistently supports the conclusion that gold broadly maintains real purchasing power across extended inflationary periods. Furthermore, studies comparing gold’s appreciation rate against prevailing inflation rates suggest gold tends to outpace inflation in real terms, with the outperformance most pronounced during the acute phases of currency collapse.
Zimbabwe’s hyperinflation of 2008 to 2009 represents the most extreme modern case. Price levels doubled approximately every 24.7 hours at peak, according to research published by Steve Hanke and Alex Kwaja in 2009. The currency became functionally unusable within days. Notably, what replaced the Zimbabwe dollar in daily commerce was primarily the U.S. dollar and South African rand rather than physical precious metals, highlighting an important distinction between long-term preservation and short-term exchange utility. For a deeper understanding of how these dynamics are playing out today, the concept of a gold safe haven remains highly relevant.
How Silver and Gold Actually Behave During a Collapse
The Two-Phase Silver Response
Silver exhibits a consistent two-phase behavioural pattern during financial crises that investors often misread. During the initial shock phase, silver frequently sells off sharply as investors liquidate positions to meet margin calls and cash demands. During the 2008 financial crisis, silver declined from approximately $20 per ounce in March 2008 to approximately $9 per ounce by October 2008, a drop of roughly 55%.
| Phase | Silver Price Behaviour | Historical Example | Approximate Duration |
|---|---|---|---|
| Phase 1: Panic Liquidation | Initial drop of 30–55% | 2008: $20 to $9/oz | Weeks to months |
| Phase 2: Safe Haven Recovery | Strong recovery as monetary easing accelerates | 2008–2011: $9 to $48/oz (+433%) | Months to years |
| Extended Crisis Range | Scenario-dependent price band | Model projection: $80–$200/oz | Scenario-dependent |
Investors who sold silver during the Phase 1 panic in 2008 locked in substantial losses and missed the subsequent 433% recovery from the October 2008 low to the May 2011 high of approximately $48 per ounce. Understanding this behavioural pattern is essential for maintaining conviction through volatility.
Gold and Silver: A Side-by-Side Comparison
| Factor | Gold | Silver |
|---|---|---|
| Primary crisis role | Store of value and monetary reserve | Accessible monetary hedge with industrial dimension |
| Volatility profile | Lower | Significantly higher |
| Entry price accessibility | Higher per unit | Lower per unit, more accessible |
| Industrial demand upside | Limited | Substantial (solar, EVs, electronics) |
| Supply deficit risk | Moderate | High, with ongoing structural deficits |
| Liquidity in crisis | Very high | High, with short-term panic-phase risk |
Silver’s dual identity as both a monetary metal and an industrial commodity creates a compounding demand dynamic that gold does not share. Solar panel manufacturing, electric vehicle production, and electronics manufacturing all require significant silver inputs. This means that during periods of simultaneous financial instability and industrial expansion, silver faces demand pressure from two directions at once, creating what some analysts describe as an asymmetric price environment.
The Gold-to-Silver Ratio as a Positioning Tool
The gold-to-silver ratio, which measures how many ounces of silver are required to purchase one ounce of gold, has historically served as a tactical signal for relative positioning. Historically, the ratio has averaged approximately 47 to 1 over extended periods, though it has traded as high as 120 to 1 during acute crisis periods (as seen briefly in March 2020) and as low as 15 to 1 during periods of silver outperformance.
When the ratio is elevated relative to historical norms, it has historically indicated that silver is undervalued relative to gold, creating a potential rotation opportunity for investors already holding precious metals exposure. This does not eliminate silver’s short-term volatility risk but provides a longer-term mean-reversion framework.
The U.S. Debt Trajectory and What It Means for Monetary Stability
From $1 Trillion to the Current Level: Understanding the Acceleration
The United States national debt reached $1 trillion for the first time in the early 1980s. It reached $5 trillion around 2008, $20 trillion in 2017, and $30 trillion in 2022. As of early 2025, the figure stands at approximately $36 to $37 trillion according to U.S. Treasury data. This exponential acceleration, rather than any single debt level, is the more significant signal for monetary risk analysis.
Simultaneously, the Federal Reserve’s M2 money supply expanded from approximately $4.4 trillion in December 2008 to approximately $21 trillion by January 2022, a 377% increase over fourteen years. Every additional unit of currency created mathematically dilutes the purchasing power of existing currency, reinforcing the structural case for assets with fixed or constrained supply. According to economic trend analysis, this relationship between monetary expansion and precious metals pricing has remained consistent across multiple economic cycles.
Every dollar created through monetary expansion represents a fractional claim on a larger pool of currency units competing for the same real-world goods and services. The scarcity of gold and silver is not a narrative feature but a mathematical one relative to an expanding money supply.
Food Supply Disruptions and the Compounding Inflation Effect
One perspective that receives limited mainstream attention is the compounding relationship between energy price shocks, agricultural output, and consumer price inflation. Diesel fuel is a fundamental input cost for modern industrial agriculture, affecting planting, harvesting, transport, and fertiliser production simultaneously.
Geopolitical disruptions that affect oil supply chains do not simply raise pump prices. They cascade through the agricultural supply chain over the growing season following the price shock. Price increases at the commodity level translate into consumer price inflation that central banks struggle to address through conventional monetary policy tools without triggering recession.
This agricultural-inflation-monetary response chain is one of the less commonly understood accelerants for precious metals demand, as it creates conditions where inflation proves structurally resistant to interest rate responses, forcing central banks toward eventual accommodation.
The Timing Trap: Why Waiting Is the Costliest Strategy
The 2008 Case Study in Hindsight
During the 2008 financial crisis, gold at $1,200 per ounce was widely perceived as expensive relative to its pre-crisis price. Many investors concluded it was too late to enter. From that level, gold subsequently appreciated by more than 400% before its 2011 peak. Investors who applied the same logic at the 2011 peak were proven wrong on a different timeline, with gold recovering its 2011 high only in 2020 before continuing higher.
The structural lesson is that gold is not a trade with a defined entry and exit window. It is a long-duration preservation instrument whose thesis strengthens with each additional unit of monetary expansion. The question for prospective buyers is not whether the price is high in nominal terms but whether the purchasing power being converted into metal will buy more or less metal at a future date.
The Diminishing Conversion Window
A concept that deserves wider understanding is what might be called the diminishing conversion window. As monetary expansion continues and precious metals prices rise in nominal terms, each unit of fiat currency purchases progressively less physical metal. Consequently, delay is not a neutral choice — it is an active decision to accept a less favourable conversion rate.
This dynamic accelerates dramatically as inflation becomes entrenched. Premiums for physical bullion, the spread between spot price and actual purchase price for physical coins and bars, historically spike during periods of acute demand. During the 2008 crisis, physical gold premiums reached multiples of the spot price at certain points as coin and bar availability tightened.
Portfolio Construction: Physical, ETF, or Mining Exposure
Comparing Your Options
Understanding physical gold vs ETFs is an essential step in structuring a resilient precious metals portfolio.
| Format | Advantages | Key Risks |
|---|---|---|
| Physical coins and bullion | Full ownership, no counterparty risk, no systemic dependency | Storage costs, insurance requirements, liquidity slightly lower |
| Gold and silver ETFs (e.g., OUNZ) | Easy access, high liquidity, low transaction friction | Counterparty exposure, dependent on functioning financial system |
| Mining equities (e.g., senior producers) | Price leverage to metal, dividend potential | Operational risk, equity market correlation, management risk |
The Debt-Financed Metals Question
A recurring debate in precious metals communities is whether leveraging against home equity or other assets to purchase gold and silver amplifies returns during inflationary periods. The theoretical case exists: if gold rises significantly and borrowing costs remain below that appreciation rate, the leveraged position outperforms.
The practical risk, however, is more complex. Markets do not move in straight lines. A leveraged position that encounters a Phase 1 panic-phase pullback simultaneously with rising borrowing costs can force asset liquidation at precisely the wrong moment. The conservative framework — focused on eliminating debt while building physical metal holdings — removes this forced-liquidation risk.
The next major ASX story will hit our subscribers first
Geopolitical and Structural Catalysts Worth Monitoring
Central Bank Digital Currencies and Financial Privacy
European nations are advancing CBDC frameworks and digital identification systems at a pace that is generating significant concern among financial privacy advocates. CBDCs represent a structural shift in how monetary systems function, providing governments with unprecedented visibility and potential control over individual transaction activity.
The relevance to precious metals is indirect but meaningful: physical gold and silver exist entirely outside digital monetary infrastructure. They cannot be frozen, surveilled, or depreciated through algorithmic monetary policy in the way digital currency balances can. For investors concerned about the governance dimensions of CBDCs, physical precious metals represent one of the few financial instruments with no digital dependency.
Silver’s Industrial Supply Deficit
The ongoing silver supply deficits represent one of the most underappreciated dynamics in the precious metals market. Unlike gold, where annual mine supply approximately matches demand in most years, silver faces documented annual deficits driven by accelerating demand from solar panel manufacturing, EV production, and electronics.
In many scenarios, government infrastructure stimulus programmes that drive solar and EV adoption actually intensify industrial silver demand at the same time that monetary stress drives investor demand, creating simultaneous pressure from two independent demand sources. This dual demand dynamic is particularly significant when considering gold and silver for hyperinflation and currency collapse scenarios.
Frequently Asked Questions
Can gold and silver completely protect wealth during a currency collapse?
Historical evidence shows precious metals consistently preserve purchasing power during hyperinflationary episodes. However, complete protection depends on the proportion of wealth held in metals versus other assets. Those with diversified physical holdings have historically fared better than those dependent solely on financial system instruments.
How much gold and silver should someone hold as an inflation hedge?
There is no universally correct allocation. Conservative frameworks typically suggest 10 to 20% of liquid wealth in precious metals. More aggressive positioning reflects individual risk assessments of systemic monetary risk. Individual circumstances, existing debt levels, and income stability all influence the appropriate allocation. Guidance on crisis allocation can provide a useful starting reference point.
Is physical gold better than gold ETFs during a financial crisis?
Physical gold eliminates counterparty risk entirely. ETFs require functioning financial markets, custodians, and redemption mechanisms. During severe systemic stress, the ability to access physical metal without intermediary dependency becomes more valuable, though ETFs offer superior day-to-day liquidity under normal conditions.
How quickly can hyperinflation develop from standard inflation?
Historical cases show that the transition from elevated inflation to acute hyperinflation can compress into weeks rather than years. Zimbabwe’s most severe acceleration occurred over days. The Argentine peso’s collapse in 2001 unfolded over weeks. The assumption of a gradual, manageable transition is historically unsupported.
Should you take on debt to buy gold and silver?
Taking on significant new debt to purchase precious metals introduces forced-liquidation risk that undermines the preservation purpose of the position. Transferring existing equity into metals can improve positioning in specific circumstances, but net new leveraged speculation in volatile assets carries substantial downside scenarios that most investors are not positioned to manage.
What is the gold-to-silver ratio and how does it guide buying decisions?
The ratio measures how many ounces of silver equal one ounce of gold by price. Historically averaging around 47 to 1, elevated readings above 80 to 1 have historically suggested silver is undervalued relative to gold, while low readings suggest the opposite. It is a tactical positioning tool rather than a directional signal for either metal individually.
Positioning Before the Inflection Point
Currency collapses do not announce themselves with advance notice. The historical record — from Weimar Germany to Zimbabwe to Argentina — consistently shows that the window between recognising systemic risk and executing meaningful protective action is narrower than most people assume. The investors who preserved the most wealth across these episodes were those who acted during the preceding period of relative stability, not during the crisis itself.
The structural case for holding gold and silver for hyperinflation and currency collapse protection is not built on speculation about any single political outcome or market move. It is built on the documented mathematics of monetary expansion, the historical precedent of every major fiat currency system, and the physical scarcity of two metals that no central bank can print.
The question is not whether the thesis is valid. The evidence for that is extensive. The question is how much purchasing power will be sacrificed by waiting for certainty that, historically, arrives only after the opportunity to act has already passed.
This article is intended for educational and informational purposes only and does not constitute financial advice. Precious metals investment involves risk, including the possible loss of principal. Past performance of any asset, including gold and silver, is not indicative of future results. Readers should consult a qualified financial adviser before making any investment decisions. Price projections and scenario models referenced in this article represent analytical frameworks and not guaranteed outcomes.
Want to Know When the Next Major Mineral Discovery Hits the ASX?
While preserving wealth through precious metals provides a defensive foundation, Discovery Alert’s proprietary Discovery IQ model offers a complementary offensive edge — delivering real-time alerts the moment significant mineral discoveries are announced on the ASX, including gold and silver explorers that could represent the next transformative opportunity. Explore historic discoveries and their returns to see what’s possible, then begin your 14-day free trial at Discovery Alert to position yourself ahead of the broader market.


Leave a comment