
Why Silver’s Most Explosive Phase May Still Lie Ahead
Precious metals markets have a long history of testing investor patience precisely when conviction matters most. The most powerful bull markets in silver’s history have not moved in straight lines. They have consolidated, frustrated, and exhausted participants before delivering their most significant price gains. Understanding where silver sits within that cyclical framework right now is arguably more important than tracking any single price headline.
The David Morgan silver price outlook for 2025 and 2026 reflects this deeper structural perspective. Rather than chasing short-term price catalysts, Morgan’s framework examines behavioural signals, supply dynamics, monetary architecture, and ratio mechanics to assess whether silver’s historic run is genuinely over or whether the market is simply entering a familiar, uncomfortable pause before the next advance.
When big ASX news breaks, our subscribers know first
Silver’s Post-Parabolic Phase: What the January 2026 Surge Really Means
Understanding the Price Collapse and Consolidation Range
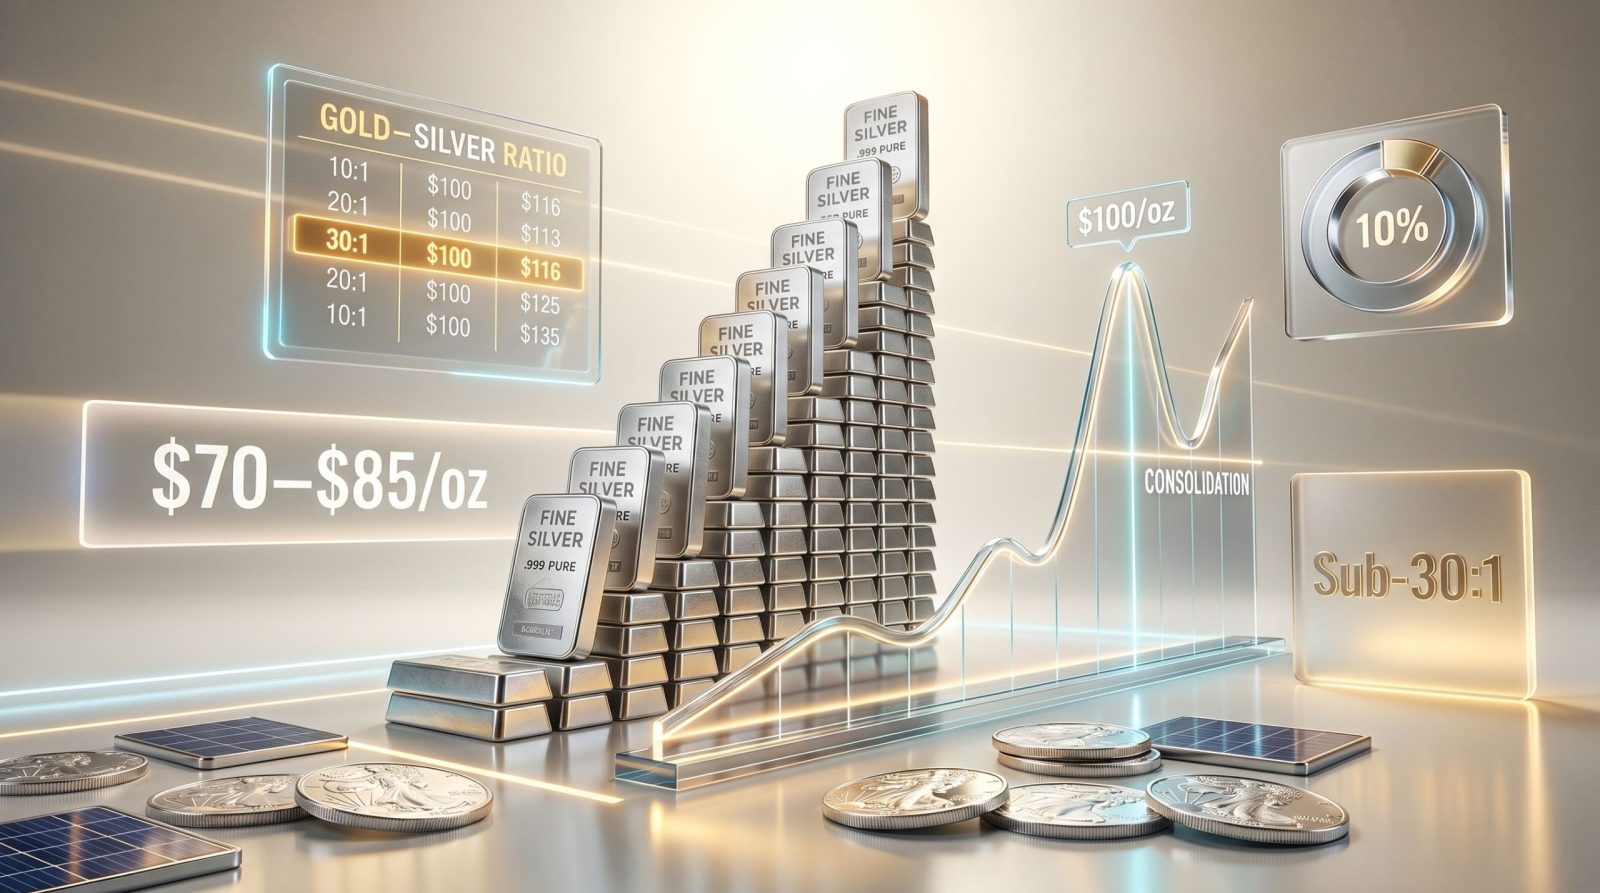
Silver’s surge past the $100 per ounce threshold in January 2026 marked one of the most significant milestones in the metal’s modern trading history. The momentum was undeniable. However, what followed was equally notable: a sharp intraday collapse that drove prices toward $65 per ounce before stabilisation occurred. For investors who had tracked the metal for years, this kind of violent post-peak volatility was not entirely surprising.
Morgan’s current base case places silver in a consolidation range of approximately $70 to $85 per ounce, a phase he believes could persist through mid-2026. His characterisation of this period is precise: this is not a bear market signal. Instead, it reflects what he describes as the “wear you out” phase typical of major bull markets before a final advance. This distinction carries significant analytical weight.
The absence of widespread retail euphoria during the run from $50 to $100-plus is Morgan’s primary reason for concluding the bull market has further to run. Long-term holder liquidation is structurally different from the kind of top-signalling behaviour historically associated with secular market peaks.
A Bloomberg technical analyst published research arguing the January 2026 rally was structurally complete, drawing parallels to the 2016 parabolic move in silver. Morgan acknowledged the technical analogy has validity. Price structures can repeat. But he stopped short of accepting the bearish conclusion, identifying a critical gap in the bearish thesis: the retail euphoria phase that historically defines a true market ceiling simply did not materialise during this cycle.
Who Was Actually Selling at $50 and $100
The composition of sellers during silver’s run to triple digits provides important context. According to Morgan, a substantial portion of selling at the $50 per ounce level came from long-term holders who had accumulated silver over five to ten years or more, many of whom had become convinced that institutional forces would perpetually suppress prices at that threshold. Once $50 broke convincingly and prices continued toward $100, further liquidation by this same cohort continued throughout the ascent.
This behavioural profile is structurally different from euphoric new-money entry, which is the kind of participation associated with genuine market tops. The “shoe shine boy giving stock tips” metaphor, referencing the behavioural warning sign from the 1929 market era, is a framework Morgan applies directly. When neighbours, non-investors, and casual market participants begin enthusiastically promoting an asset as a guaranteed winner, that is when serious long-term investors should consider taking significant profits.
That signal has not yet appeared in the silver market.
How the Ratio Works and Why It Matters
The gold-silver ratio measures how many ounces of silver are required to purchase one ounce of gold. Historically, this ratio has ranged from approximately 15:1 to 100:1, reflecting wildly different periods of relative valuation between the two metals. When the ratio is elevated, silver is cheap relative to gold. When it compresses, silver has historically outperformed gold significantly. In-depth gold-silver ratio analysis reveals how this metric has served as one of the most reliable forward indicators available to precious metals investors.
The current ratio sits near 50:1. Morgan’s structural thesis centres on compression toward sub-30:1 and potentially sub-20:1 as the defining characteristic of silver’s most powerful rally phase. The mathematical implications of ratio compression are striking:
| Gold-Silver Ratio | Implied Silver Price (Gold @ $3,000) | Implied Silver Price (Gold @ $3,500) |
|---|---|---|
| 50:1 (current) | $60 | $70 |
| 30:1 | $100 | $116 |
| 20:1 | $150 | $175 |
| 15:1 (historical extreme) | $200 | $233 |
This framework shifts analytical focus away from absolute price targets and toward the relationship between the two metals. The question becomes less “what will silver cost?” and more “what relative valuation between gold and silver is structurally justified given supply dynamics, industrial demand growth, and monetary conditions?”
Institutional Forecasts vs. Structural Analysis
J.P. Morgan published a 2026 silver price forecast of approximately $81 per ounce on average, with quarterly ranges of roughly $75 to $85, citing 130% gains in 2025 driven by industrial demand growth and significant buying from China and India. Furthermore, this institutional forecast sits comfortably within Morgan’s consolidation range, which is notable alignment at the near-term level.
However, the divergence becomes significant over a longer horizon. Institutional models typically weight demand averages and near-term macro variables. Morgan’s framework prioritises physical market dynamics, supply constraints, and the behavioural signals that precede major phase transitions. These are fundamentally different methodologies that can agree in the short term while diverging sharply in multi-year projections. For instance, understanding silver supply deficits is a key part of why Morgan’s long-range view diverges so sharply from consensus institutional projections.
Three Conditions Morgan Believes Must Occur Before a True Silver Market Peak
Morgan has articulated a clear behavioural checklist that he monitors for signs of a genuine market top. None of these conditions have been met as of the current analysis:
- Mainstream retail investors begin discussing silver in everyday, non-specialist conversations as a guaranteed winner with unlimited upside
- Silver is described publicly by non-specialist commentators using superlatives such as indispensable, irreplaceable, and predictions of prices in the thousands of dollars per ounce begin circulating in popular media
- Industrial demand narratives surrounding solar panels, electric vehicles, and AI infrastructure become common investment conversation topics beyond specialist and resource-focused communities
Until these conditions are met, Morgan maintains that the structural bull case remains intact despite near-term price consolidation.
Mining Economics and the Hidden Energy Cost Problem
Why Oil Prices Directly Impact Mining Margins
Energy costs represent approximately 20 to 25% of total operating costs for mid-to-large-scale mining operations under normal conditions. If crude oil prices escalate materially due to geopolitical disruptions affecting major shipping routes, that proportion could rise toward 30 to 40%, creating meaningful margin compression for direct mining operators even in an environment of rising metal prices.
Morgan has noted that the oil market has not yet fully priced in the disruption from ongoing geopolitical pressures affecting critical shipping routes. His view is that oil remains undervalued relative to the supply risks already present, let alone potential future escalation. This creates a layered risk for resource investors holding direct mining exposure. Consequently, understanding how gold and silver prices respond to these trade and geopolitical pressures is essential context for any portfolio decision in this environment.
Two Portfolio Strategies to Manage Energy Exposure
Morgan has outlined two distinct approaches to structurally managing oil price risk within a precious metals-focused portfolio:
Framework 1: Royalty and Streaming Companies
- Royalty and streaming structures provide financing to mining operators in exchange for a percentage of future production or revenue
- These companies do not bear direct operational costs, meaning rising energy prices do not directly compress their margins
- Morgan has favoured royalty and streaming structures as a core portfolio allocation since the earliest days of his research service, describing them as cash-rich, unhedged, and insulated from the direct energy cost dynamics that affect conventional miners
Framework 2: Direct Energy Sector Exposure
- Adding oil and energy company positions to a metals-focused portfolio creates a natural hedge
- If energy prices rise and compress mining margins, gains in energy equity positions can offset that impact
- Morgan added oil positions to his recommended portfolio prior to the most recent geopolitical escalation, framing the trade as a recognition of undervalued assets rather than a reactive hedge
A combined allocation to royalty and streaming companies alongside selective energy equity positions can structurally neutralise oil price risk without sacrificing precious metals upside exposure. This is a portfolio construction insight rarely discussed in mainstream precious metals commentary.
| Asset Type | Energy Cost Exposure | Liquidity at Peak | Re-entry Flexibility |
|---|---|---|---|
| Direct Mining Equities | High | High | Moderate |
| Royalty and Streaming Stocks | Minimal | High | High |
| Physical Silver | None | Moderate | Lower |
| Silver ETFs | None | Very High | Highest |
| Oil Equities (hedge) | Inverse benefit | High | High |
The Macro Environment: What Money Supply Growth Signals for Silver
Federal Reserve Balance Sheet and the Lagged Metal Response
The U.S. Federal Reserve began pivoting from quantitative tightening back toward balance sheet expansion in late 2024. Historically, sustained money supply growth functions as a lagged bullish catalyst for precious metals, typically with a transmission delay of 12 to 24 months. The current environment combines balance sheet expansion with elevated geopolitical uncertainty, growing fiscal deficits, and increased military spending — a combination that has historically been favourable for hard asset valuations.
Yet metals have not responded as most analysts expected. Gold, silver, platinum, and palladium have all traded in broad sideways ranges rather than trending higher in response to these macro conditions. Morgan attributes this to what he characterises as maximum uncertainty across multiple dimensions simultaneously: geopolitical conflict, AI disruption anxiety, political incoherence, and food supply concerns.
The general investing public lacks sufficient monetary literacy to connect fiscal expansion, currency debasement, and precious metals valuations in real time. This means the metals response is typically delayed rather than immediate, with capital rotation occurring only once consequences become more visible in daily economic experience.
The Stock Market Paradox and the Invisible Crash
U.S. equity markets continue reaching nominal all-time highs despite significant economic and geopolitical stress. Morgan’s revised analytical framework accommodates this paradox. In near-inflationary or hyperinflationary environments, nominal stock prices rise as investors seek any asset that preserves purchasing power better than cash. Historical examples from Zimbabwe, Argentina, and Turkey demonstrate that equity markets in those countries continued rising in nominal terms even as currencies collapsed.
The critical insight is what happens when the S&P 500 is measured in gold rather than dollars. This calculation, which Morgan describes as revealing an “invisible crash,” suggests that real purchasing power of equity portfolios may be declining even as nominal prices rise. Investors who focus exclusively on nominal index levels may be missing a significant erosion of real wealth. Morgan draws a direct parallel to current market dynamics, echoing analysis explored in David Morgan’s publicly available forecasts which examine how nominal gains can mask real purchasing power losses.
The next major ASX story will hit our subscribers first
Physical Silver vs. Mining Equities: A Framework for Allocation Decisions
Lessons from the January 2026 Peak
Morgan provided specific guidance to his membership to scale out of positions in tranches as silver moved above $80 and into the $100 range. In retrospect, selling mining equities during the peak period offered structural advantages over liquidating physical silver:
- Mining equities carry lower bid-ask spreads compared to physical silver markets, particularly during periods of refinery backlog
- Execution is faster with significantly less slippage
- Equities can be re-entered at lower prices during corrections with greater ease, as demonstrated when silver briefly touched $65 per ounce post-peak
One member of Morgan’s community executed this strategy with notable precision, selling equity positions near the peak and re-entering near the $65 low within approximately three to four days.
The 10% Rule and the Non-Negotiable Physical Reserve
Morgan recommends a 10% precious metals allocation as a baseline for most investors. Within that 10%, the split between physical metal and equities depends on age, risk tolerance, and investment objectives. However, beyond the portfolio percentage question, Morgan articulates a separate principle for physical metal that operates independently of trading considerations:
Maintaining a minimum physical metal reserve equivalent to six months of personal living expenses is a non-negotiable baseline that should never be liquidated regardless of price levels. This functions as a financial life preserver, not a trading position.
If monthly living expenses are $3,000, the minimum untouchable physical metal reserve would be approximately $18,000 to $20,000 in current metal value. This reserve exists not as a return-generating instrument but as a sovereignty-preservation tool against scenarios involving bank closures, currency stress, or payment system disruptions.
The Monetary System Transition and Silver’s Role Outside Digital Architecture
The Ownership Theory of Money
A foundational concept from monetary historian Jerome Smith that Morgan references directly concerns what Smith called the ownership theory of money. Bank deposits are legally classified as unsecured creditor claims against the bank, not the depositor’s property. In a bank failure scenario, depositors become creditors and may receive equity in the failed institution rather than cash. Physical gold and silver held outside the banking system represent true ownership — assets that cannot be rehypothecated, frozen, or digitally restricted.
This legal reality is rarely discussed in mainstream personal finance contexts but carries material implications for risk management in a period of increasing financial system stress. Furthermore, silver’s dual role as both a monetary asset and an industrial commodity gives it a unique structural position that few other assets can replicate in this kind of environment.
ISO 20022 and the Digital Clearing Architecture
Morgan has studied the architecture of the emerging global monetary system extensively, including presenting on the topic at the 50th anniversary of the New Orleans Gold Conference. His analysis draws on publicly available material from the Bank for International Settlements, known as the banker’s bank.
A critical technical detail that receives little attention in mainstream financial commentary is the ISO 20022 financial messaging standard, which underpins global payment clearing. According to Morgan’s analysis, all transactions regardless of currency, platform, or instrument ultimately clear through this standardised institutional framework. This has significant implications for BRICS-driven alternatives to dollar dominance: if clearing ultimately routes through the same institutional infrastructure, the practical impact on dollar hegemony may be more limited than advocates of these alternatives suggest.
Physical precious metals represent one of the few asset classes that exist entirely outside this digital clearing architecture — a structural argument for their role in a diversified portfolio that extends beyond simple inflation hedging.
The Freedom-Money Correlation
Morgan has written directly on the relationship between sound money systems and individual economic freedom, arguing there is a demonstrable historical correlation between the two. As monetary systems become more digitised and subject to surveillance infrastructure, physical assets held outside the banking system take on a dual function: financial hedge and practical sovereignty preservation tool. Additionally, central bank influence on monetary architecture is a factor Morgan considers integral to understanding why physical metals continue to attract long-term structural demand.
Industrial Demand: The Structural Support for Silver’s Long-Term Price Floor
Why Silver’s Supply Cannot Respond Elastically to Price Signals
A critical supply-side dynamic that distinguishes silver from most commodities is that approximately 70 to 80% of annual mine supply is produced as a byproduct of base metal mining, primarily copper, zinc, and lead operations. This means silver mine supply cannot respond elastically to silver price signals in the way that primary commodity production can. When silver prices rise, silver miners cannot simply open new dedicated silver mines quickly enough to satisfy demand. The supply response is constrained by the economics of the base metals that drive primary mining decisions.
This byproduct supply structure creates a price support mechanism that institutional demand-averaging models often underweight. JPMorgan’s research on silver prices acknowledges sustained industrial demand as a key driver, yet institutional supply-side models have historically underestimated the constraints imposed by byproduct production dependency.
Emerging and Accelerating Industrial Demand Categories
Three industrial demand categories are relevant to silver’s structural price floor:
- Solar photovoltaic manufacturing remains one of the largest and fastest-growing industrial consumers of silver globally, with silver’s electrical conductivity properties making meaningful substitution technically difficult
- Electric vehicle production and associated charging infrastructure add incremental silver demand that was not present in previous bull market cycles, representing a genuinely new demand layer
- AI data centre infrastructure requires extensive electrical connectivity and thermal management systems, representing an emerging demand category not fully reflected in long-term supply models that were constructed before the current AI infrastructure buildout
Physical delivery dynamics at exchanges and elevated premiums for refined silver during peak demand periods in 2025 signalled tightening physical availability relative to paper market pricing — a disconnect that Morgan’s supply-constraint framework treats as a leading indicator rather than a short-term anomaly.
Frequently Asked Questions: David Morgan Silver Price Outlook
Will Silver Return to Triple Digits in 2025 or 2026?
Morgan believes silver will return to and likely exceed $100 per ounce, but cautions that the timeline may extend beyond what many analysts are projecting. His base case anticipates a consolidation phase through mid-2026, followed by a potential resumption of the broader bull trend. Some institutional forecasts target triple-digit silver before end of 2025, which Morgan considers possible but not his primary scenario.
What Is Morgan’s Actual Price Target for Silver?
Morgan does not publish a single fixed price target. His framework is ratio-based and phase-based. He anticipates silver outperforming gold as the gold-silver ratio compresses, with the final phase of the bull market potentially driving prices well above January 2026 highs. Longer-term scenarios discussed in his research include prices significantly above $100 per ounce during peak price discovery phases.
Is Now a Good Time to Buy Silver?
Morgan’s current positioning guidance leans toward building cash reserves during the consolidation phase, maintaining existing core physical positions, and selectively adding to royalty and streaming equity positions on weakness. He does not advocate aggressive new buying at current elevated prices relative to long-term historical averages.
What Is the Minimum Physical Silver Allocation?
The framework Morgan recommends is maintaining a minimum of six months of personal living expenses in physical metal as a non-negotiable baseline reserve. Beyond that, allocation decisions depend on individual risk tolerance, age, and financial objectives.
Key Takeaways: David Morgan’s Silver Market Framework
| Theme | Morgan’s Current Position |
|---|---|
| Near-term price range | $70 to $85 per ounce consolidation through mid-2026 |
| Long-term direction | Higher; bull market not concluded |
| Gold-silver ratio target | Sub-30:1 as major rally signal |
| Top signal to watch | Mainstream retail euphoria; not yet present |
| Preferred equity structure | Royalty and streaming companies |
| Energy hedge strategy | Direct oil equity exposure added pre-escalation |
| Physical allocation minimum | Six months living expenses; never liquidate |
| Monetary system outlook | Digital tokenised transition underway |
| Stock market view | Nominal highs masking real purchasing power decline |
| Cash position guidance | Building cash reserves currently advisable |
This article reflects the views and frameworks of David Morgan as expressed in publicly available interviews and research. It does not constitute financial advice. All investments carry risk, and past price behaviour does not guarantee future results. Readers should conduct independent research and consult a qualified financial professional before making investment decisions.
Discovery Alert’s proprietary Discovery IQ model delivers real-time notifications on significant ASX mineral discoveries, instantly translating complex data across 30-plus commodities into clear, actionable insights for both short-term traders and long-term investors — begin your 14-day free trial today, or explore historic discovery returns to understand just how transformative early positioning in major mineral discoveries can be.


Leave a comment