
A substantial number of people are facing the prospect of a dramatic drop in income when they retire, a pensions industry body has warned.
Pensions UK has delivered this caution as it published its updated “retirement living standards”.
These benchmarks have been designed to assist individuals in understanding the potential quality of life they could achieve in their post-work years.
Developed by the Centre for Research in Social Policy at Loughborough University, the standards show three distinct lifestyle levels for retirement.
These range from a “minimum” lifestyle, which covers basic necessities alongside some discretionary spending; to a “moderate” lifestyle, offering enhanced financial security and flexibility; and finally, a “comfortable” lifestyle, characterised by greater financial freedom and the inclusion of luxuries.
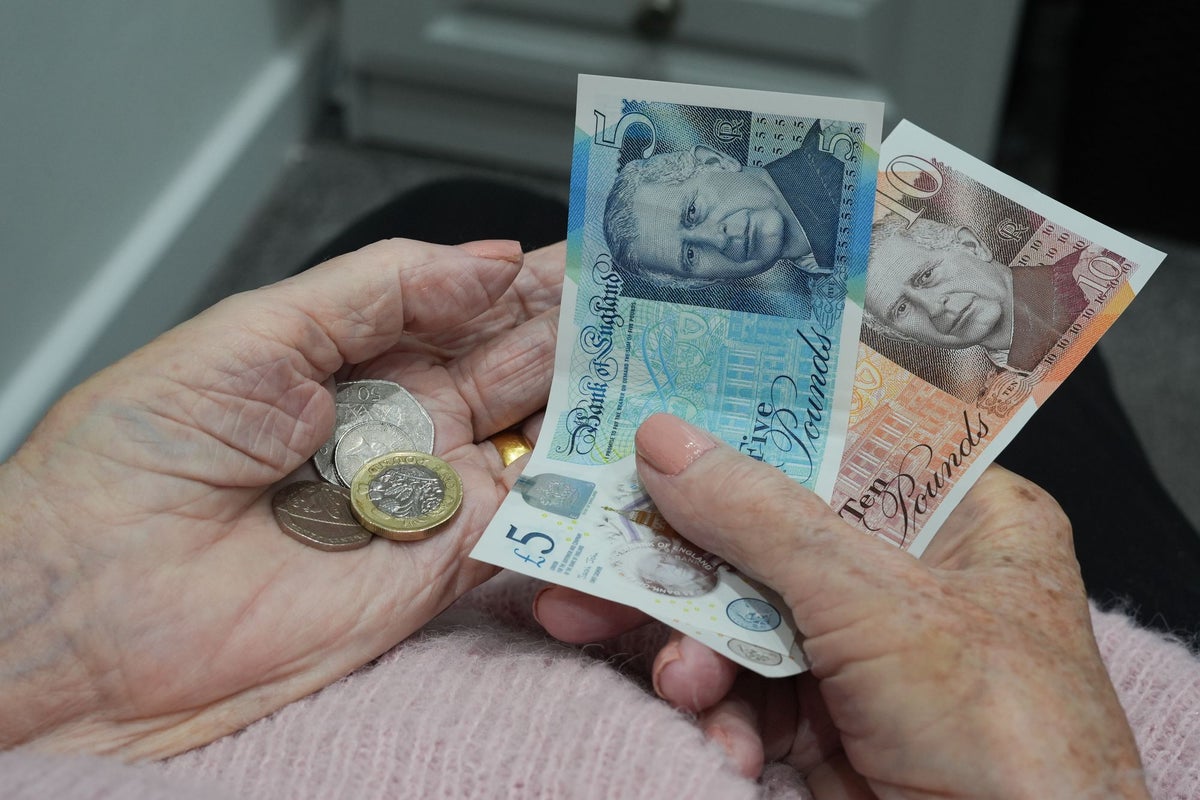
According to the calculations, a minimum retirement lifestyle costs around £13,900 annually for a one-person household and £22,500 for two people.
A moderate lifestyle costs £32,700 for one person and £45,400 for two, while a comfortable lifestyle costs around £45,400 for one person and £62,700 for two.
Pensions UK said it expects around 82% of the working population across the UK to reach at least the minimum standard of living in retirement, falling to just 23% reaching a moderate standard and less than one in 10 (9%) enjoying a comfortable lifestyle.
It said it wants to see more action to help fix the retirement savings gap, with employers where possible offering matching contributions above minimum levels.

Pensions UK also said that housing costs are not included within the retirement living standards, as they vary significantly depending on location and personal circumstances.
Some people will enter retirement owning a home outright and be mortgage‑free, while other people may continue to have a mortgage and others may rent.
This means it is important for individuals to use the standards as a guide and adjust them to reflect their own situation, Pensions UK said.
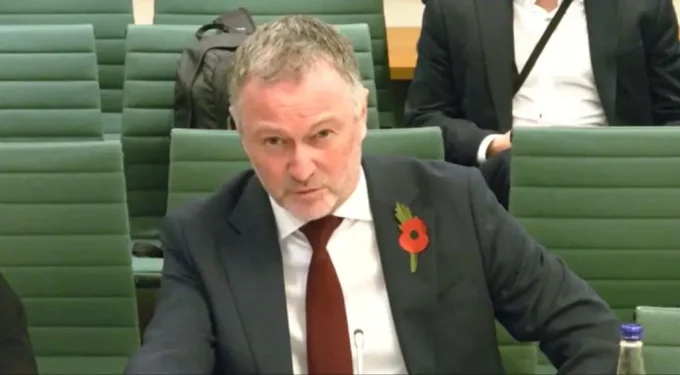
Zoe Alexander, executive director of policy and advocacy at Pensions UK, said: “The latest update to the retirement living standards underlines a clear reality for many people – today’s saving levels will not be enough for the retirement they expect.”
She added: “Without action, too many risk facing a cliff edge drop in income when they stop work.”
Ms Alexander added: “We also encourage people to speak to their employer and see whether the organisation is prepared to support them to save above the minimum, such as higher rates of matching pension contributions.”


Leave a comment