

Tron (TRX) maintains a neutral-to-bearish tone, trading above $0.32 at the time of writing on Thursday. The smart contracts token failed in its attempt to break out above resistance at $0.33 the day before, reflecting a broader downturn in the crypto market.
Despite recent signs of inflation easing in the United States (US), the war between the US and Iran in the Middle East fans above risk assets, prompting investors to reassess their exposure.
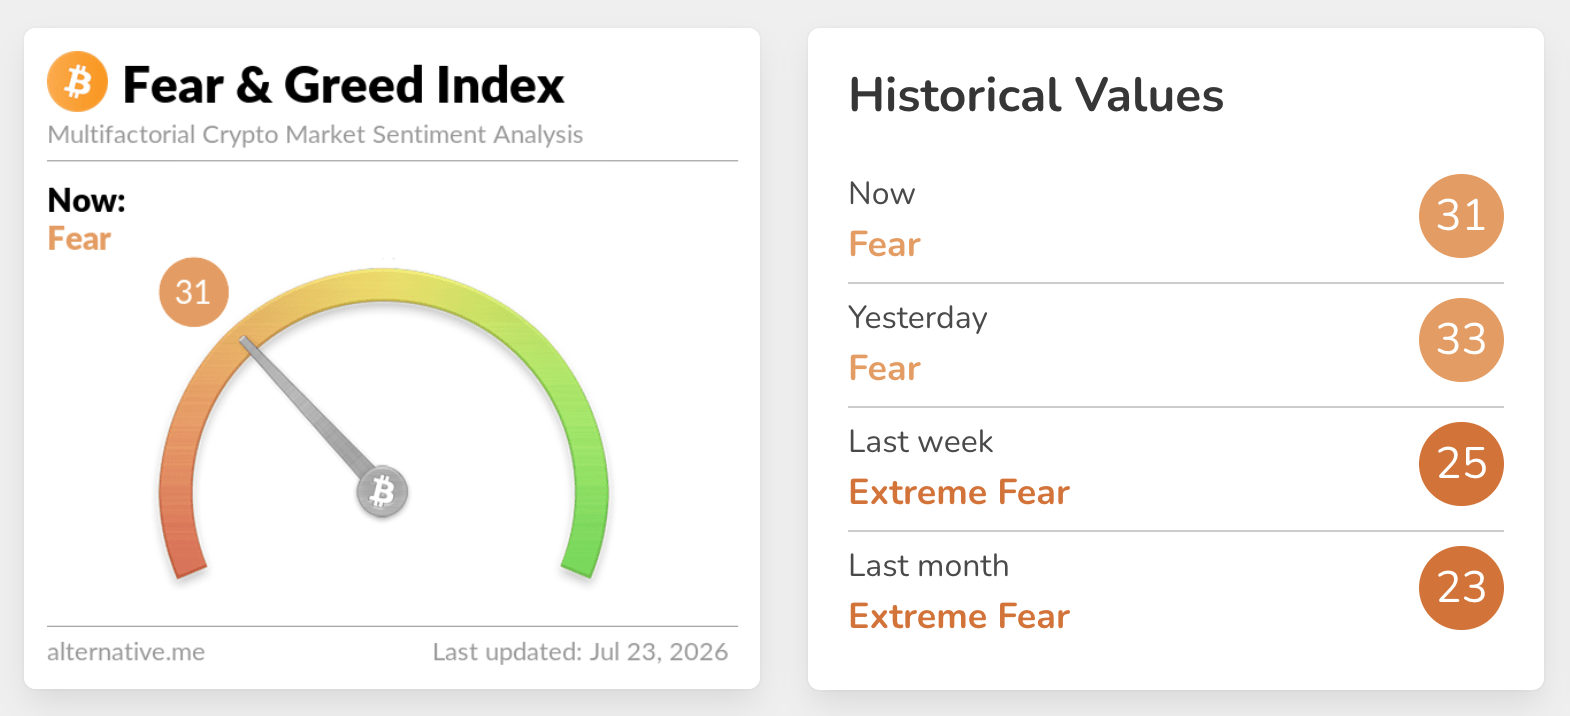
Crypto market sentiment is in Fear territory, with a minor drawdown to 31 on Thursday from 33 the day before, according to the Fear & Greed Index. If this weakness persists, it could negatively impact appetite for risk assets, in turn reducing demand and the tail force in the broader crypto market.
Gasless fees boost Tron DAO’s payment infrastructure
Most crypto protocols charge gas fees for transactions. These transactions consume energy and bandwidth, requiring network users to spend or stake the underlying token such as TRX.
This presents a significant usability barrier, as recipients of Tether (USDT) without a TRX balance are unable to transfer their funds. They must first obtain TRX, navigate the network’s energy and bandwidth requirements, and maintain a sufficient TRX balance to facilitate transactions.
However, with gasless transactions, that bottleneck disappears. Users authorize the transfer, while a third-party sponsor covers the on-chain transaction fee by deducting a minor fee directly from the transferred USDT, eliminating the need for a TRX balance.
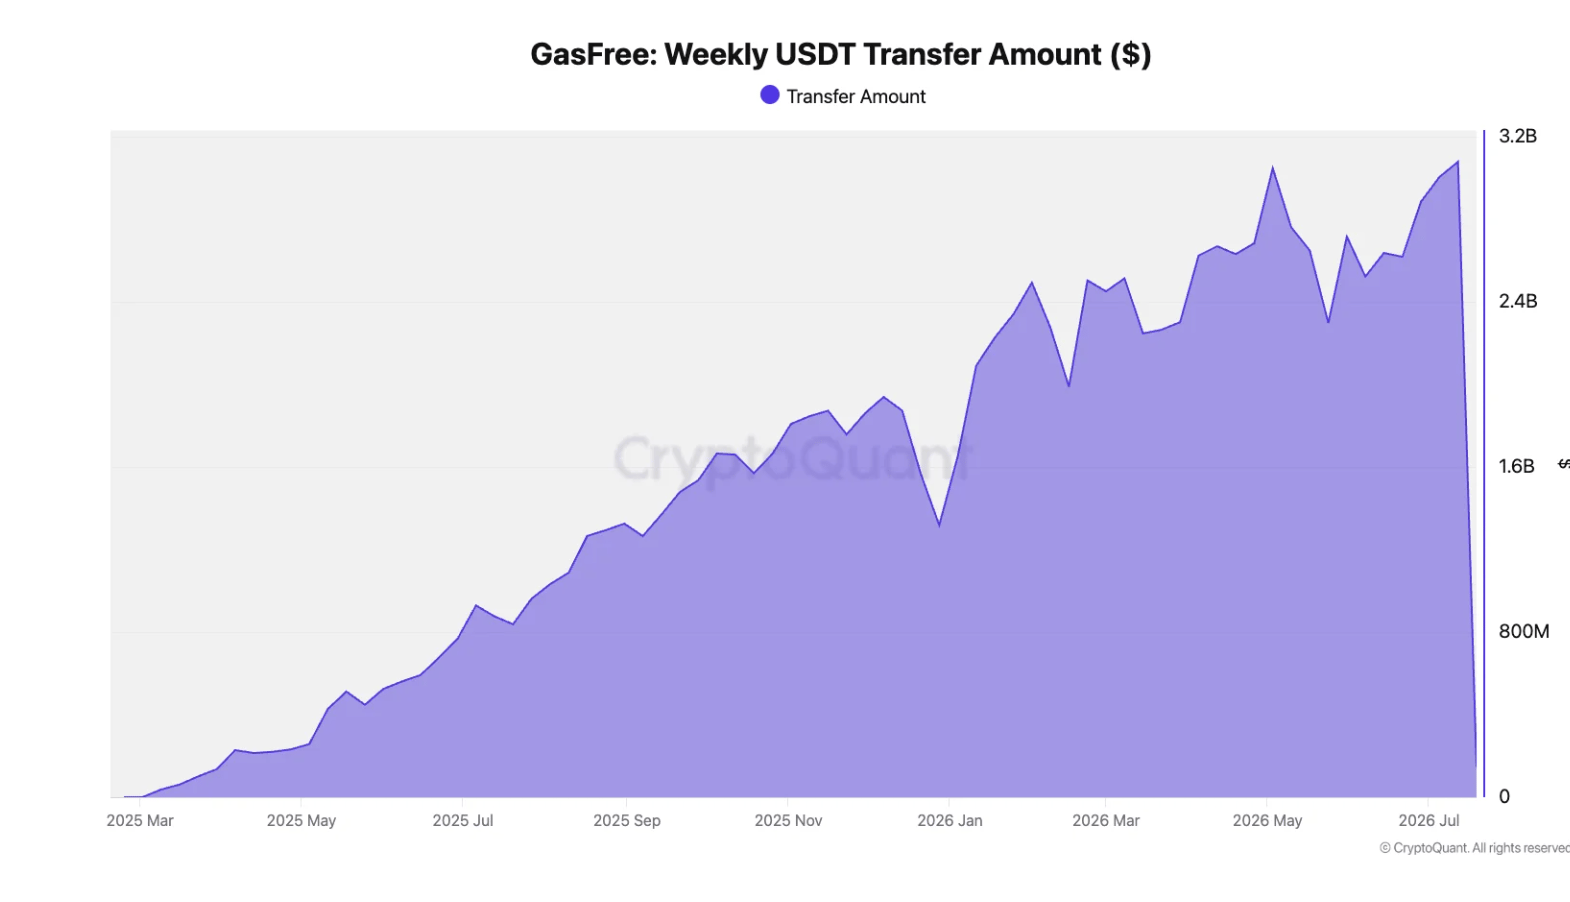
According to CryptoQuant, the rapid adoption of Tron’s gasless fees led to a jump in USDT transfer volume to $2.9 billion in the last week of June, up from near zero in the same week last year. Moreover, the transfer volume hit a record $3 billion in the first week of May, notably higher than the 2025 weekly high of $1.9 billion.
Price analysis: TRX edges down within a broader bearish outlook
The TRX price sits right on the 100-day Exponential Moving Average (EMA) at $0.327. The the 50-day EMA at $0.328 coincides with the Bollinger Bands middle layer, capping the topside.
The Moving Average Convergence Divergence (MACD) indicator holds slightly above zero with a modest positive histogram on the daily chart, and the Relative Strength Index (RSI) near the midline, both hinting at balanced momentum without strong directional conviction.
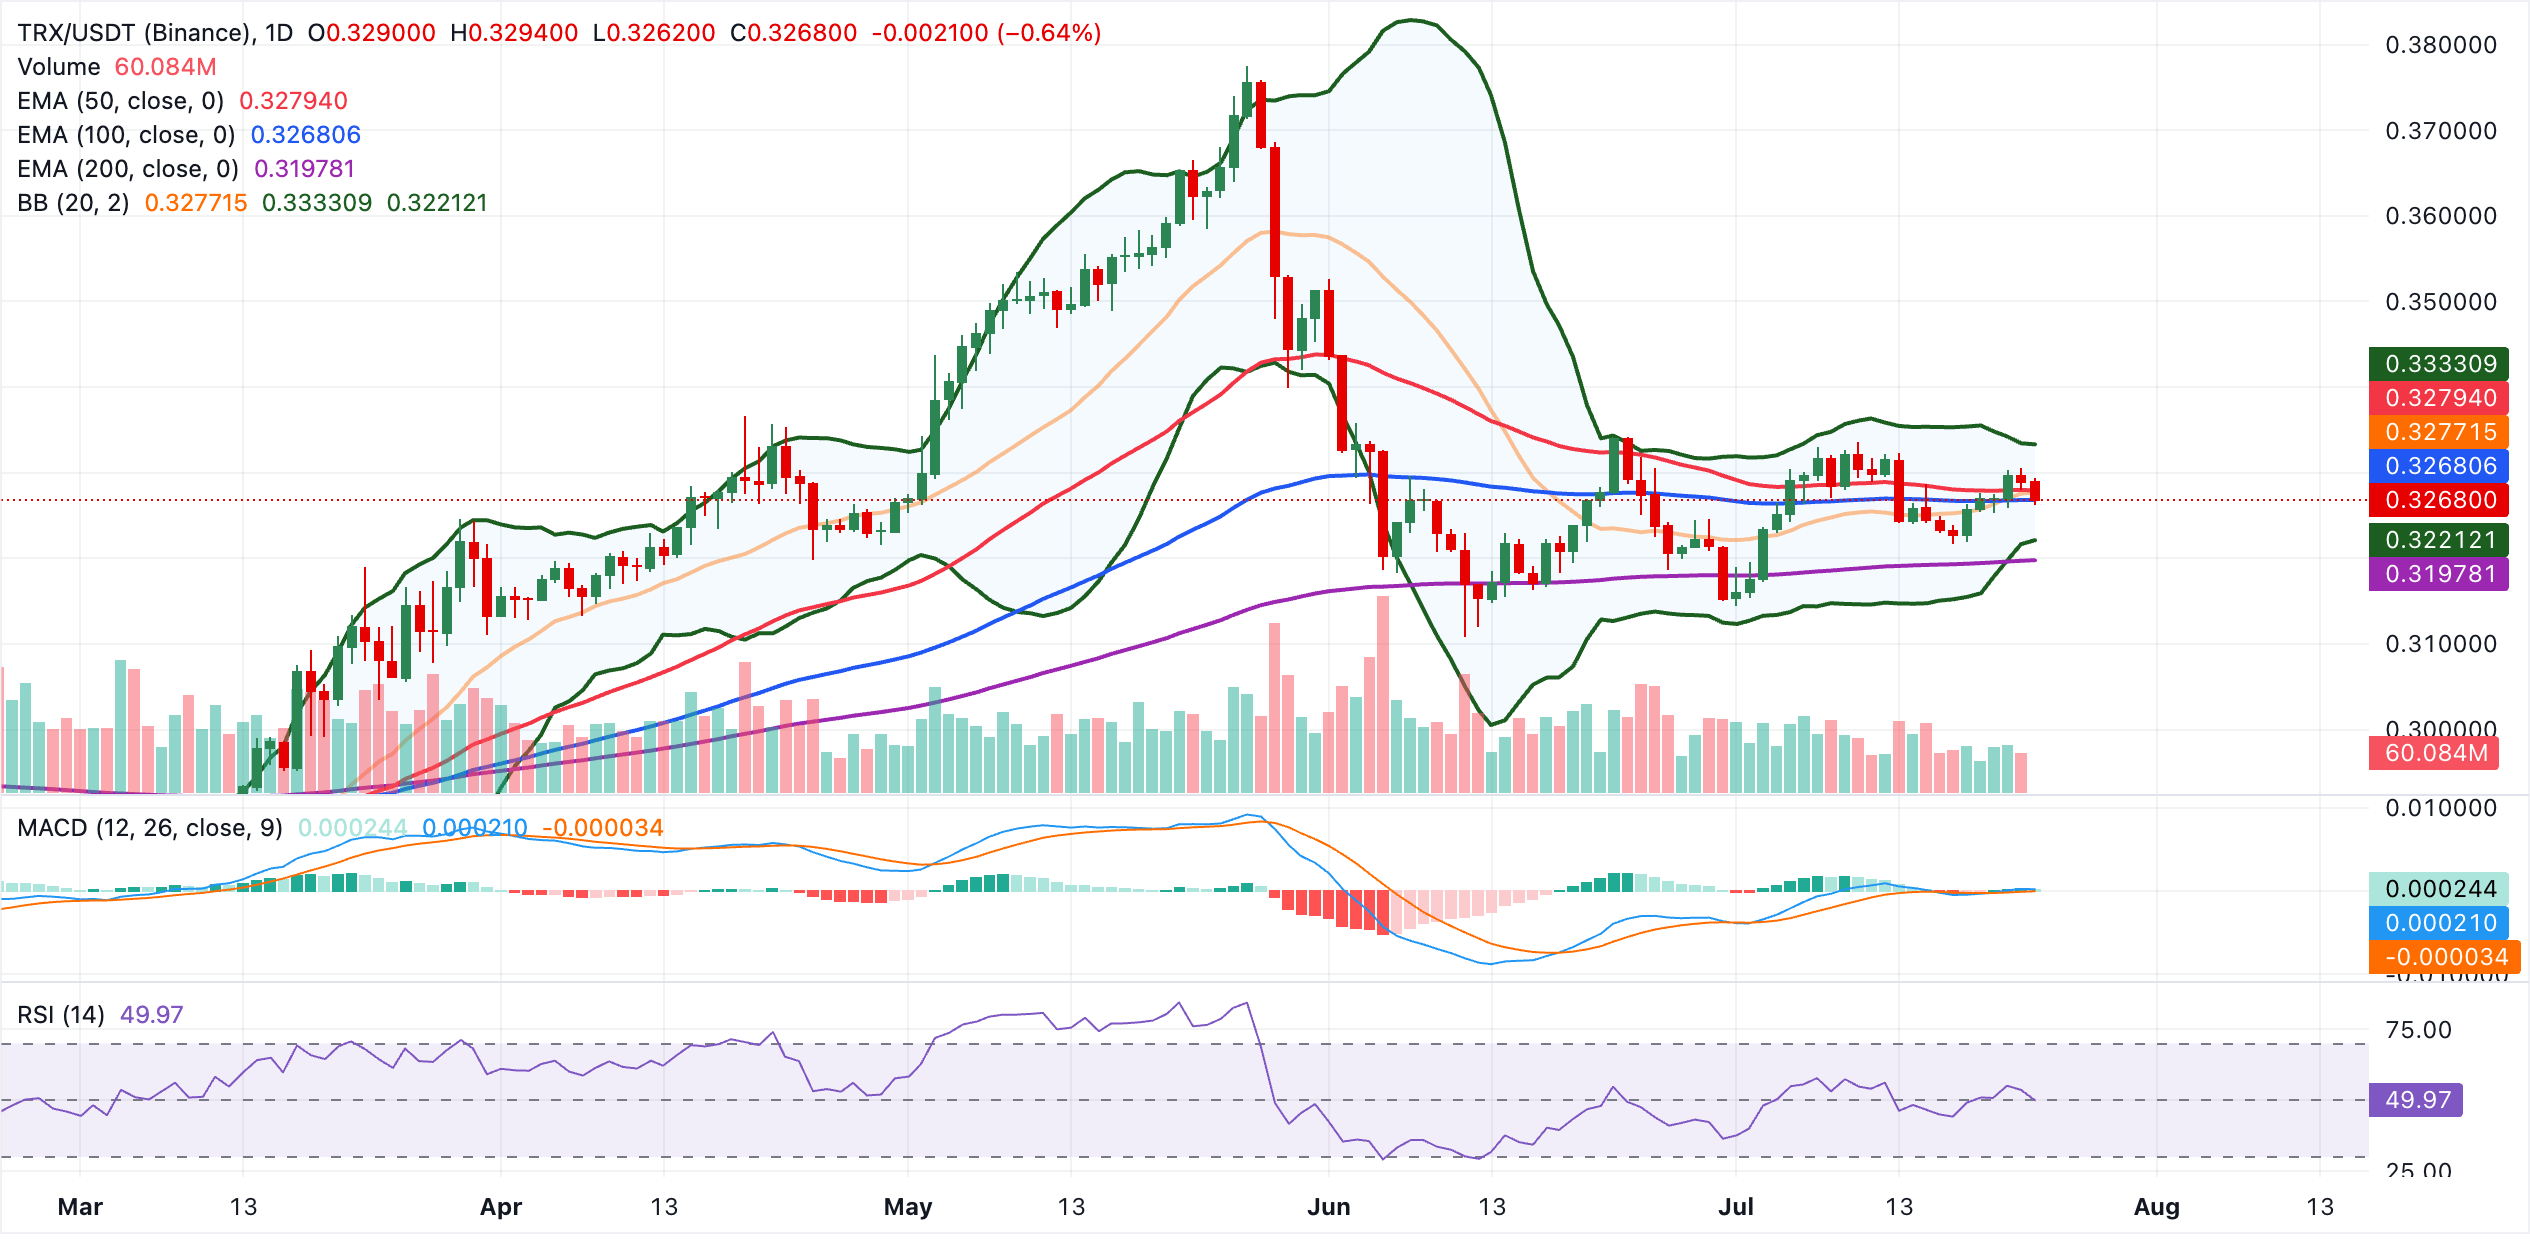
Initial resistance is clustered around the Bollinger middle layer at $0.328, which aligns with the 50-day EMA. A daily close above this banded area would open the way toward the Bollinger upper band near $0.333. On the downside, first support lies at the Bollinger lower band at $0.322, followed by the more strategic 200-day EMA at $0.320, where buyers are likely to defend the broader uptrend base. A break beneath this zone would shift the near-term bias toward a deeper corrective phase.
(The technical analysis of this story was written with the help of an AI tool. Know more.)












Leave a comment