
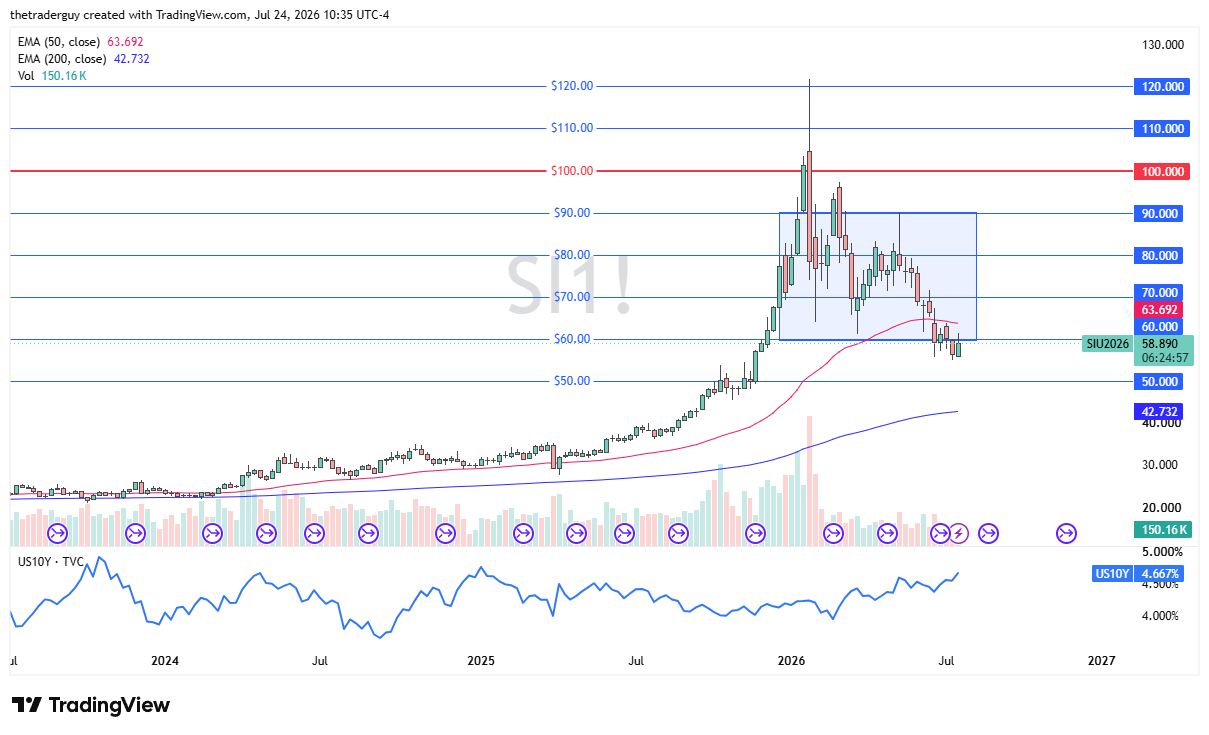
Silver
Silver rose during the course of the week, but it continues to find a lot of problems with the $60 level. The $60 level, of course, is a large, round, psychologically significant figure that a lot of people will be paying attention to, and it certainly looks as if the sellers are starting to come back into the picture and defend that area from the bearish side.

$55 continues to offer support. This is a market that is currently fighting higher-than-usual interest rates.
Gold
The gold market is very much the same. It rallied a bit to reach the $4,200 region, but pulled back from there, an area that has been important multiple times.
The $4,000 level is an area that is a large round, psychologically significant figure, and it also shows support down to the $3,900 level.
Ultimately, this is a market that continues to see a lot of volatility and choppiness, but keep in mind that the headlines coming out of the Middle East will continue to play havoc with what happens next, not only here, but in the interest rate markets themselves, which is one of the biggest drivers of how we have been deciding to move around the world.
USD/CAD
The U.S. dollar has rallied against the Canadian dollar this week, despite the fact that oil has spiked. That is not a huge surprise considering that there is a certain amount of fear out there, and of course interest rates in America continue to climb. As long as there is a positive carry on this trade, it does make sense that buyers will remain interested.
Ultimately, this is a market that has been very bullish until a couple of weeks ago, and with this, it makes a certain amount of sense that we got the pullback. Now that we have had a couple of weeks to cool off, it looks like we are going to start heading back towards the 1.4150 level.

EUR/USD
The euro dollar has fallen a bit during the course of the week, and the 1.14 level continues to be a significant level that a lot of people would be watching, as it is a support level from recent consolidation over the course of the last year.
Ultimately, interest rates in the United States continue to be a bullish factor for the U.S. dollar, and that continues to be a big factor here as well.
USD/JPY
The U.S. dollar continues to see plenty of strength against the Japanese yen, a currency that simply cannot get out of its way. Over the longer term, I anticipate that this market goes much higher, and I do believe that eventually we will have some type of short-term pullback.
That pullback should offer a nice buying opportunity from everything I can see. And with that being the case, it looks very much like a market that anytime we do get a pullback, the interest rate differential alone has buyers interested.
GBP/USD
The British pound fell during the course of the week as we continue to chop around in the same consolidation area between 1.3150 and 1.37. Ultimately, despite the fact that we have fallen, I do not think much has changed here.
The British pound continues to be somewhat sideways, and as this market continues to see a lot of sideways action, range-bound traders will continue to be attracted to it. The British pound is a little bit of an outlier against the U.S. dollar in comparison to other markets, in so much as the British central bank is at least somewhat hawkish.
Bitcoin
Bitcoin continues to show a lot of noise, and at this point, it is likely that Bitcoin will continue to be thrown around by risk appetite.
That being said, it looks to me like we are trying to find the $60,000 level as a hard floor. The weekly candlestick is a bit of a shooting star, the previous two were hammers, so I think this lends itself to be a sideways market while we try to determine what to do next.
NASDAQ 100
The Nasdaq 100 initially tried to rally during the week, but gave back gains rather quickly as we continue to see a lot of concern out there.
Quite frankly, it looks like we are on the precipice of a bigger pullback, but we will have to wait and see. If we could turn around and take out the top of this past weekly candlestick, that would be strong, but I think as long as we have so much chaos in the Middle East, it is going to be very difficult for the Nasdaq to take off because of the higher interest rates going forward.











Leave a comment