

Bitcoin Cash (BCH) trades in the red below $522 at the time of writing on Tuesday, after multiple rejections at key resistance. BCH’s derivatives and on-chain indicators point to growing bearish sentiment and raise the risk of a dead-cat bounce toward lower support levels.
Derivatives and on-chain metrics signal a bearish bias
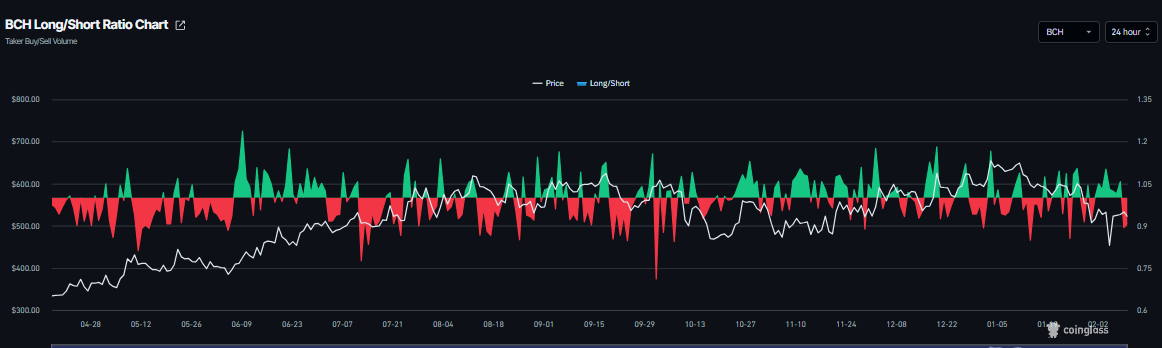
Bitcoin Cash’s derivatives data shows a bearish outlook. CoinGlass long-to-short ratio for HYPE reads 0.90 on Tuesday. This ratio, being below one, indicates bearish sentiment in the market, as more traders are betting on the asset’s price to fall.
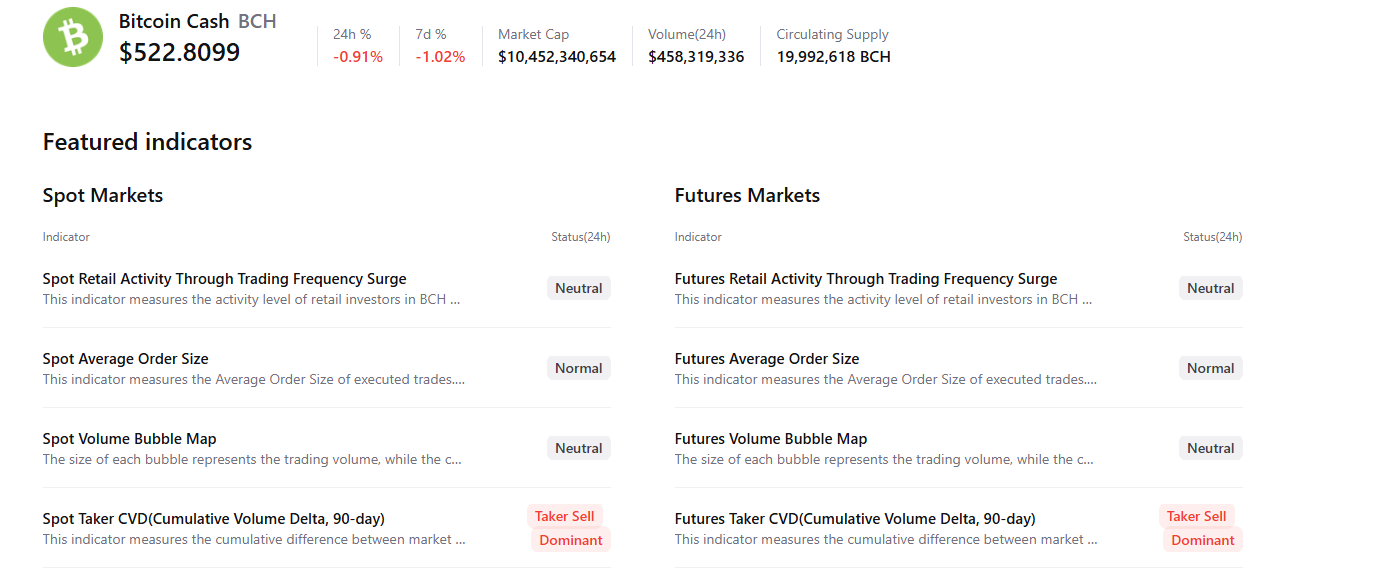
CryptoQuant’s summary data supports the negative outlook, as BCH’s spot and futures markets show sell dominance, signaling a correction ahead.
Bitcoin Cash Price Forecast: Dead-cat bounce scenario in play
Bitcoin Cash price has been rejected multiple times at the 61.8% Fibonacci retracement level (from the January 27 high of $603.90 to the February 6 low of $423.00) at $534.80. This level roughly coincides with the previously broken ascending trendline and the 200-day Exponential Moving Average (EMA) at $544.70, making this a key reversal zone.
Moreover, the current price action suggests a potential dead-cat bounce — a brief price increase within a broader downtrend — with BCH trading at $525.40 on Tuesday.
If BCH continues its correction, it could extend the decline toward the daily support at $478.70.
The Relative Strength Index (RSI) reads 44, below its neutral level of 50 and points downward, suggesting bearish momentum is gaining traction. However, the Moving Average Convergence Divergence (MACD) lines are converging, increasing the likelihood of a bullish crossover. If the MACD fails to confirm a bullish crossover, it suggests bearish momentum remains intact, increasing the risk of a further correction.
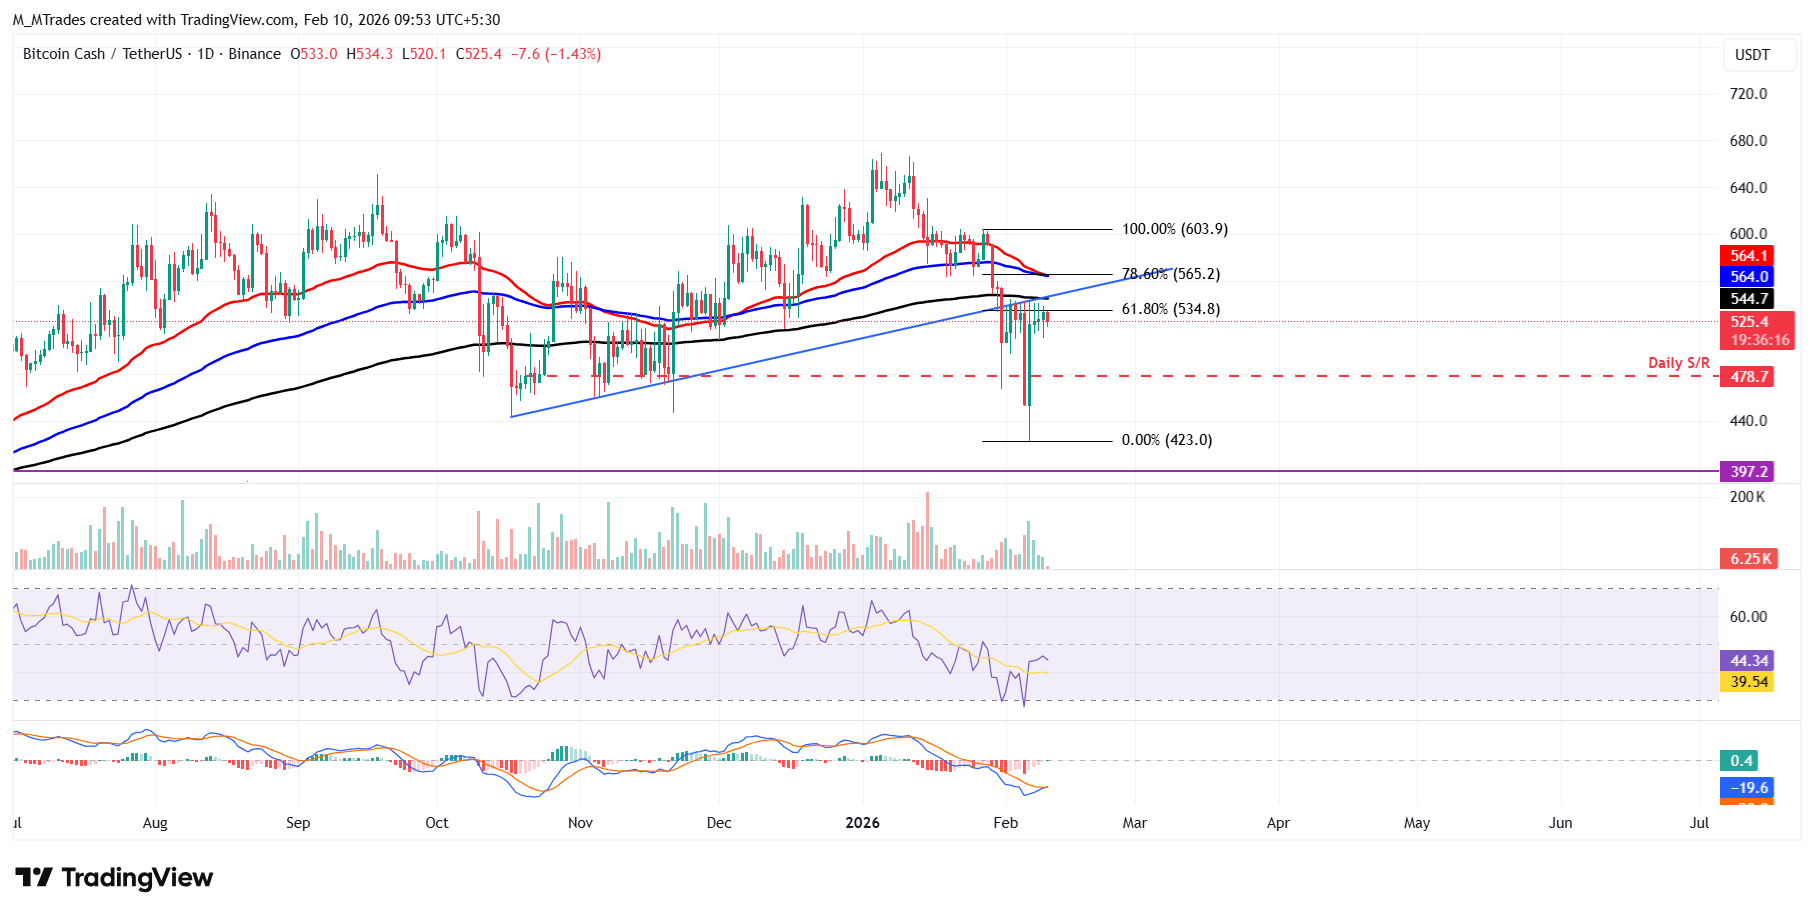
However, if BCH rallies and closes above the 200-day EMA at $544.70 on a daily basis, it could extend the advance toward the immediate resistance at $564.00, its 100-day EMA.













Leave a comment