
Key Takeaways
- BCH’s price has fallen roughly 12% over the last 30 days, as sellers briefly took control.
- BCH has broken above a falling wedge after a prolonged sequence of lower highs and lows.
- Unless buyers reclaim $496 and break resistance zones, downside risk remains possible.
Bitcoin Cash (BCH) has taken a significant hit, shedding 12% of its value in the last 30 days, rattling short-term holders and raising uncomfortable questions about the strength of its current market structure.
Given Bitcoin Cash’s history, a 12% decline in isolation is not unusual. But the context surrounding this particular drop demands closer examination.
Here is a structured breakdown of what happened and the three most likely scenarios that follow for Bitcoin Cash’s price.
What Is Behind the 12% Decline?
Bitcoin Cash’s latest selloff reflects a combination of broader market weakness and technical vulnerabilities specific to the BCH network.
The cryptocurrency had been trading in a relatively elevated range following a period of optimism in the crypto market.
However, as overall crypto market sentiment shifted and Bitcoin dominance reasserted itself, mid-cap assets like BCH were among the first to absorb the resulting sell pressure.
The 12% drop has pushed Bitcoin Cash’s price below several short-term moving averages simultaneously.
Volume during the decline was elevated, suggesting this was not a low-conviction drift lowe. Instead, it was an active, deliberate reduction in exposure by market participants.
Upside Targets Remain Feasible
Bitcoin Cash’s price is attempting a short-term recovery on the 4-hour chart after weeks of sustained downside pressure.
Before this move, BCH’s price formed a clear sequence of lower highs and lower lows, resulting in a sharp drop from the $580 region toward $440.
That decline carved out a falling wedge, a typically bullish reversal formation.
Now, the price has broken above the wedge’s upper boundary; as a result, the structure is shifting. However, confirmation remains pending.
Momentum indicators support cautious optimism; the Awesome Oscillator (AO) has flipped positive, printing expanding green histogram bars. This suggests bullish momentum is rebuilding after prolonged negative pressure.
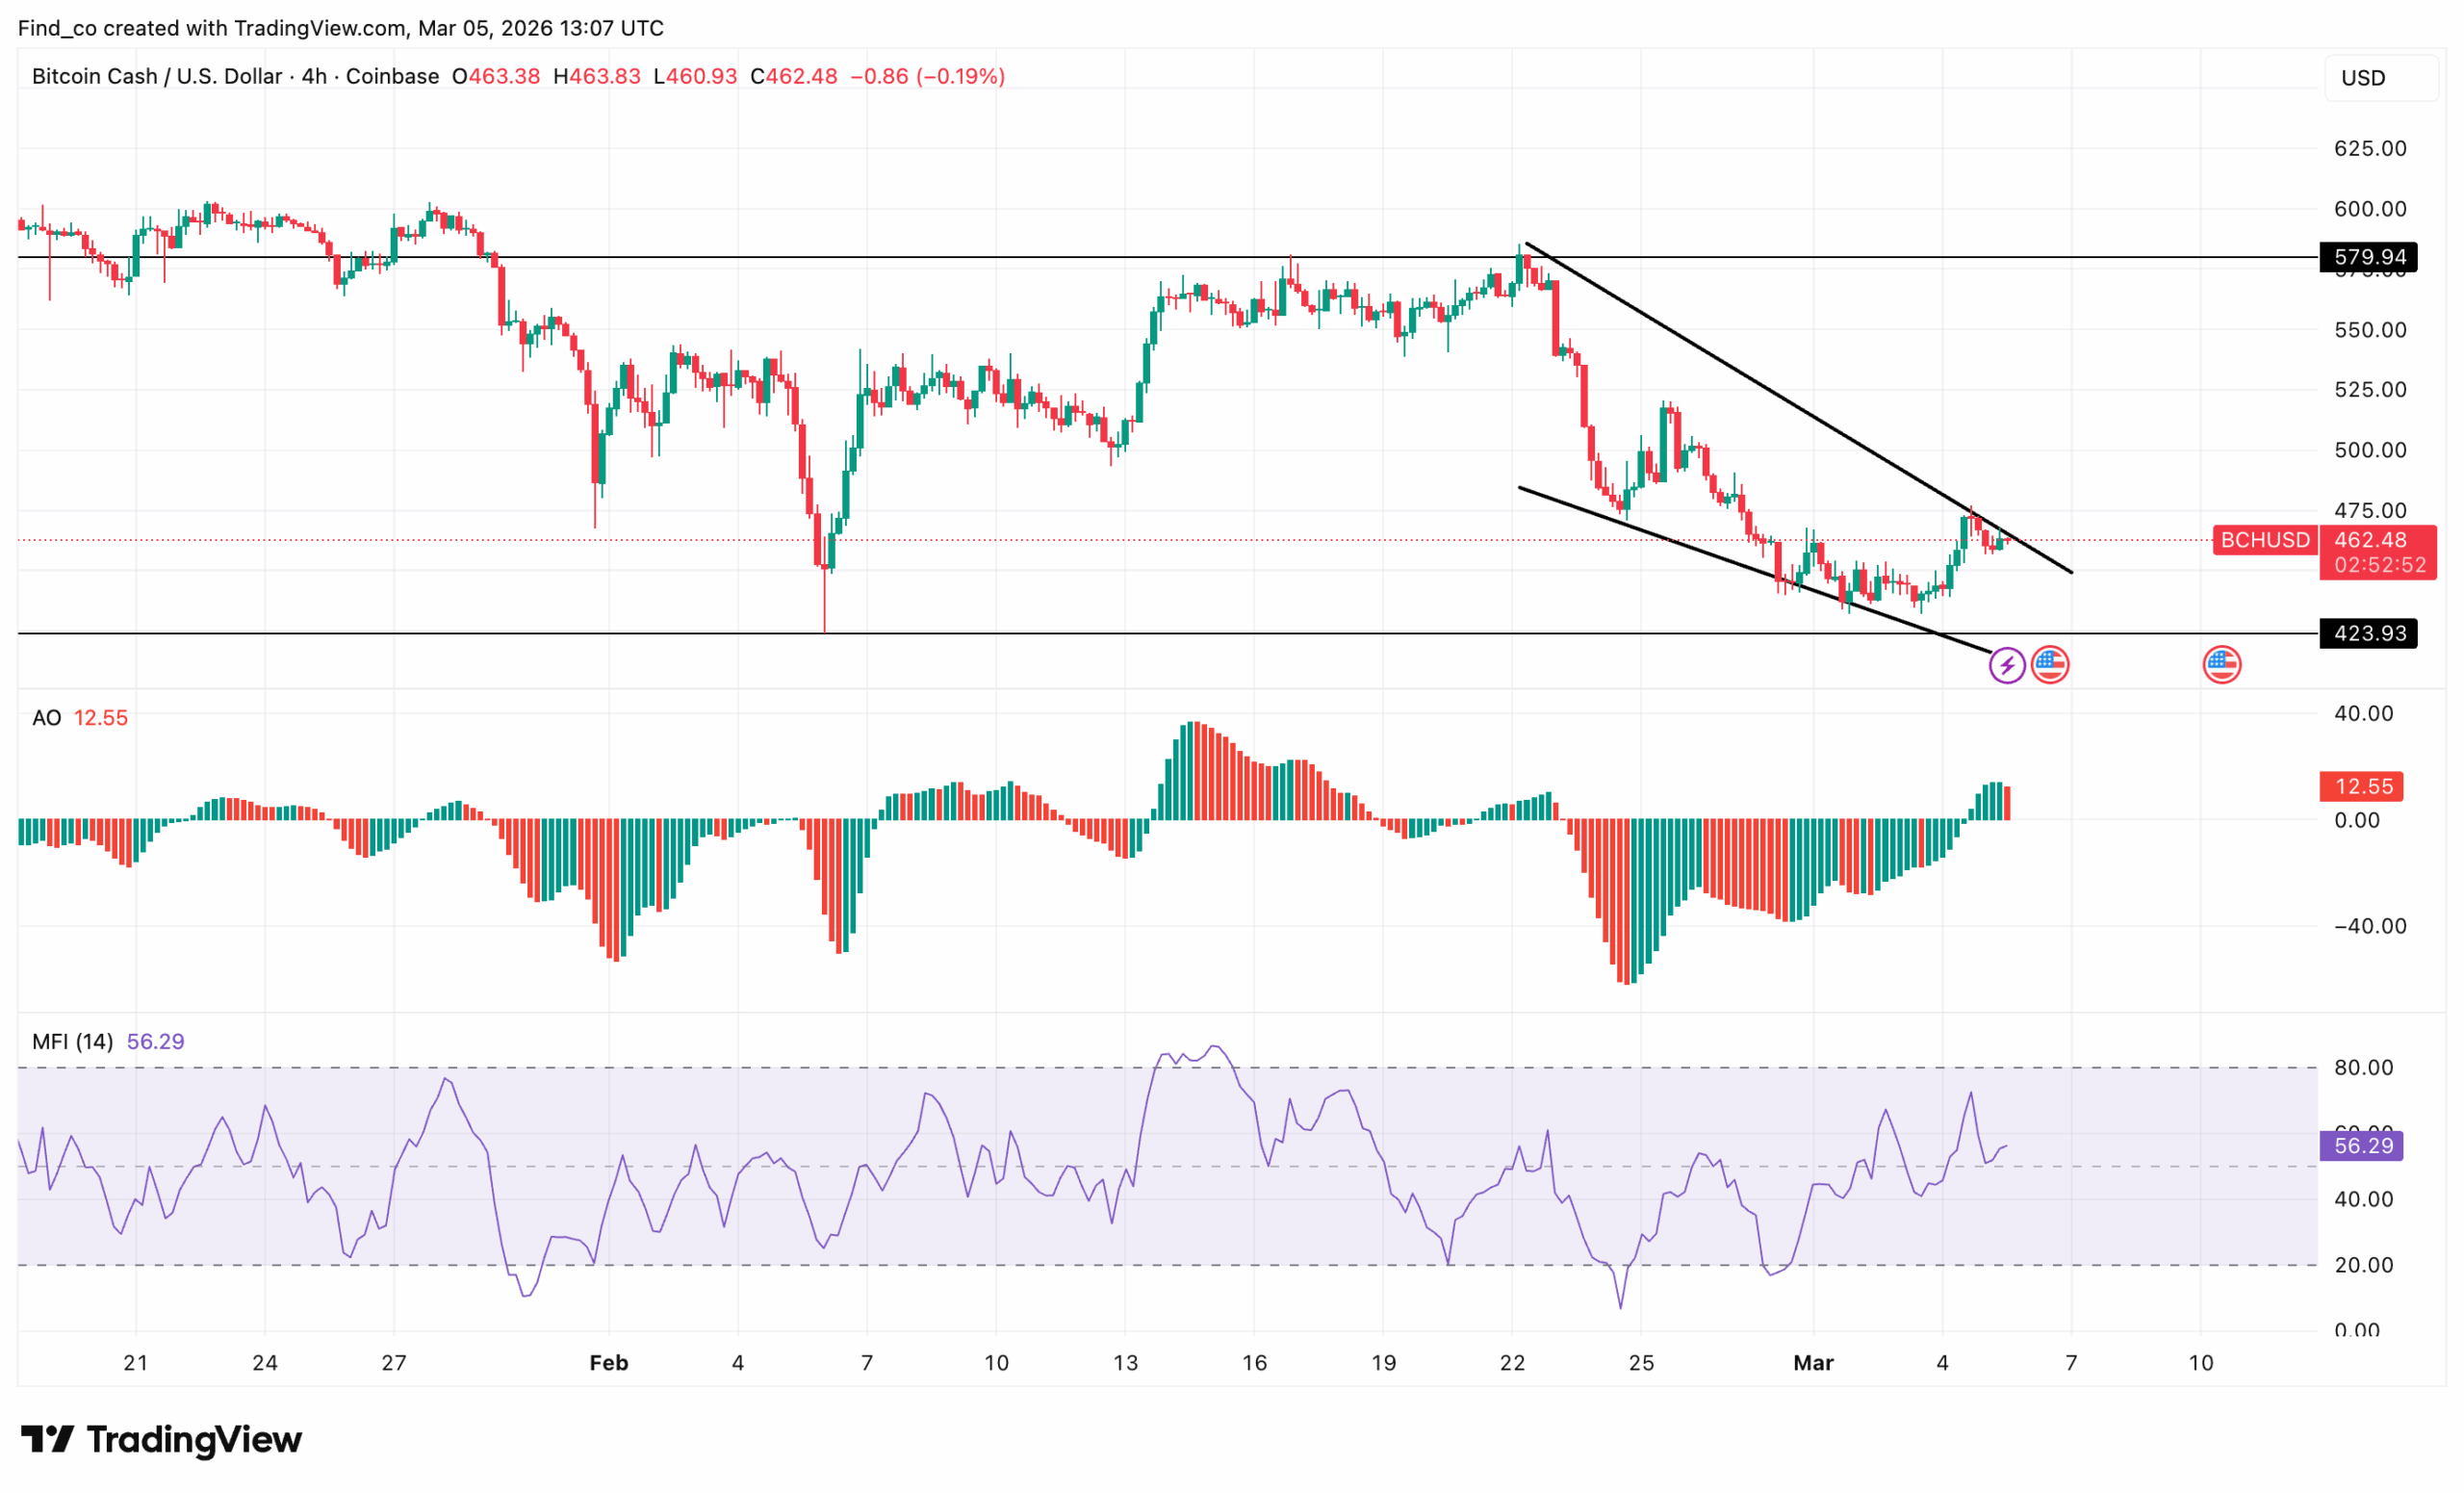
At the same time, the Money Flow Index (MFI) sits around 54, rising from oversold conditions. That signals capital inflows are returning, though not yet at euphoric levels.
A key notable point is that neither the AO nor the MFI indicator is overextended. Therefore, there is room for continuation if buyers maintain pressure.
3 Scenarios BCH Traders Must Prepare For
- Scenario 2 — Bullish Recovery and Range Reclaim: If Bitcoin’s price stabilises and broader altcoin sentiment improves, BCH has the liquidity and community depth to stage a swift recovery. The key signal to watch is whether BCH can reclaim its pre-drop levels on meaningful volume. A successful reclaim would confirm the decline as a shakeout rather than a structural breakdown, reopening the path toward previous highs.
- Scenario 2 — Sideways Consolidation: The most probable near-term outcome is a period of range-bound price action as the market digests the decline. BCH has historically demonstrated strong demand at key support zones, and a stabilisation period can build the base needed for a more sustained recovery attempt.
- Scenario 3 — Extended Correction: If Bitcoin’s price falls below its critical support levels or macroeconomic sentiment deteriorates further, BCH could face a second leg lower. Bitcoin Cash, despite its strong fundamentals, carries a relatively high beta to Bitcoin’s price movements — meaning it tends to fall harder and faster than BTC during risk-off periods. Therefore, a deeper correction would bring longer-term historical support zones into play.
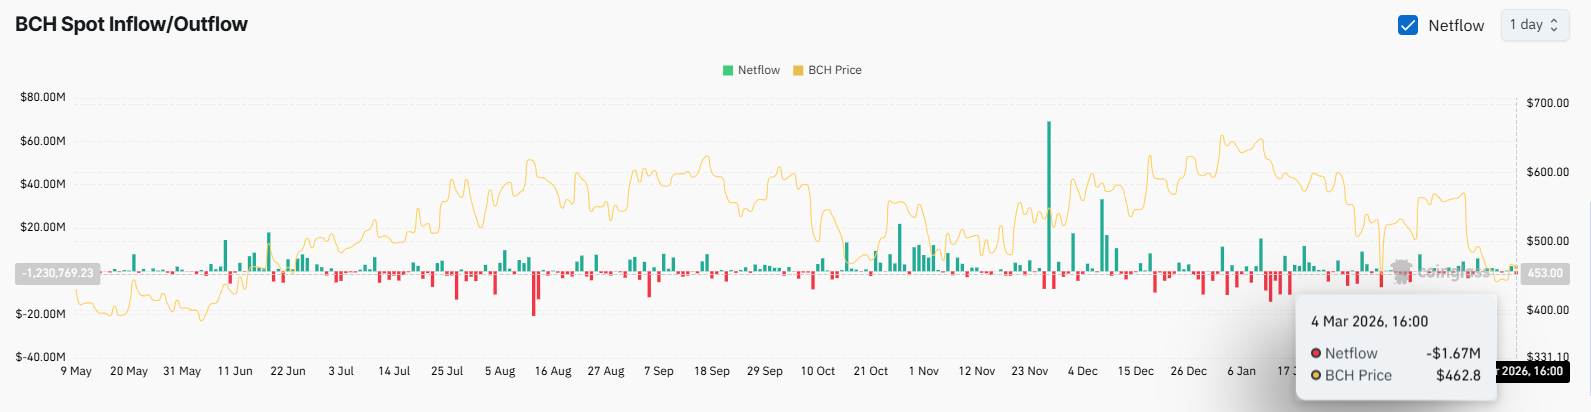
Net Outflows Signal Caution
In the meantime, Bitcoin Cash has seen modest net outflows of $1.67 million, while the price has held near $462.35.
Traders are reducing exposure despite the short-term rebound, showing that buying pressure remains cautious.
BCH is stabilizing after its drop from $580, and a move toward $500 is possible if inflows pick up. Until then, the upside remains fragile and vulnerable to renewed selling.
BCH Price Outlook: Downside Risk
On the daily chart, Bitcoin Cash dropped below the 0.382 Fibonacci level at $496, triggering a surge in bearish momentum toward the $451.03 zone, aligned with the 0.236 retracement level.
This area now acts as a key support, and if buyers hold it, a short-term rebound could emerge.
Earlier rallies stalled near $569 and $621, showing strong resistance and lower highs. The breakdown below $496.28 confirms that sellers have regained control.
Momentum indicators support this bearish outlook. The Relative Strength Index (RSI) sits near 38, signaling fading buying strength,
while the Chaikin money flow (CMF) reads -0.17, reflecting continued capital outflows. Both suggest buyers remain cautious.
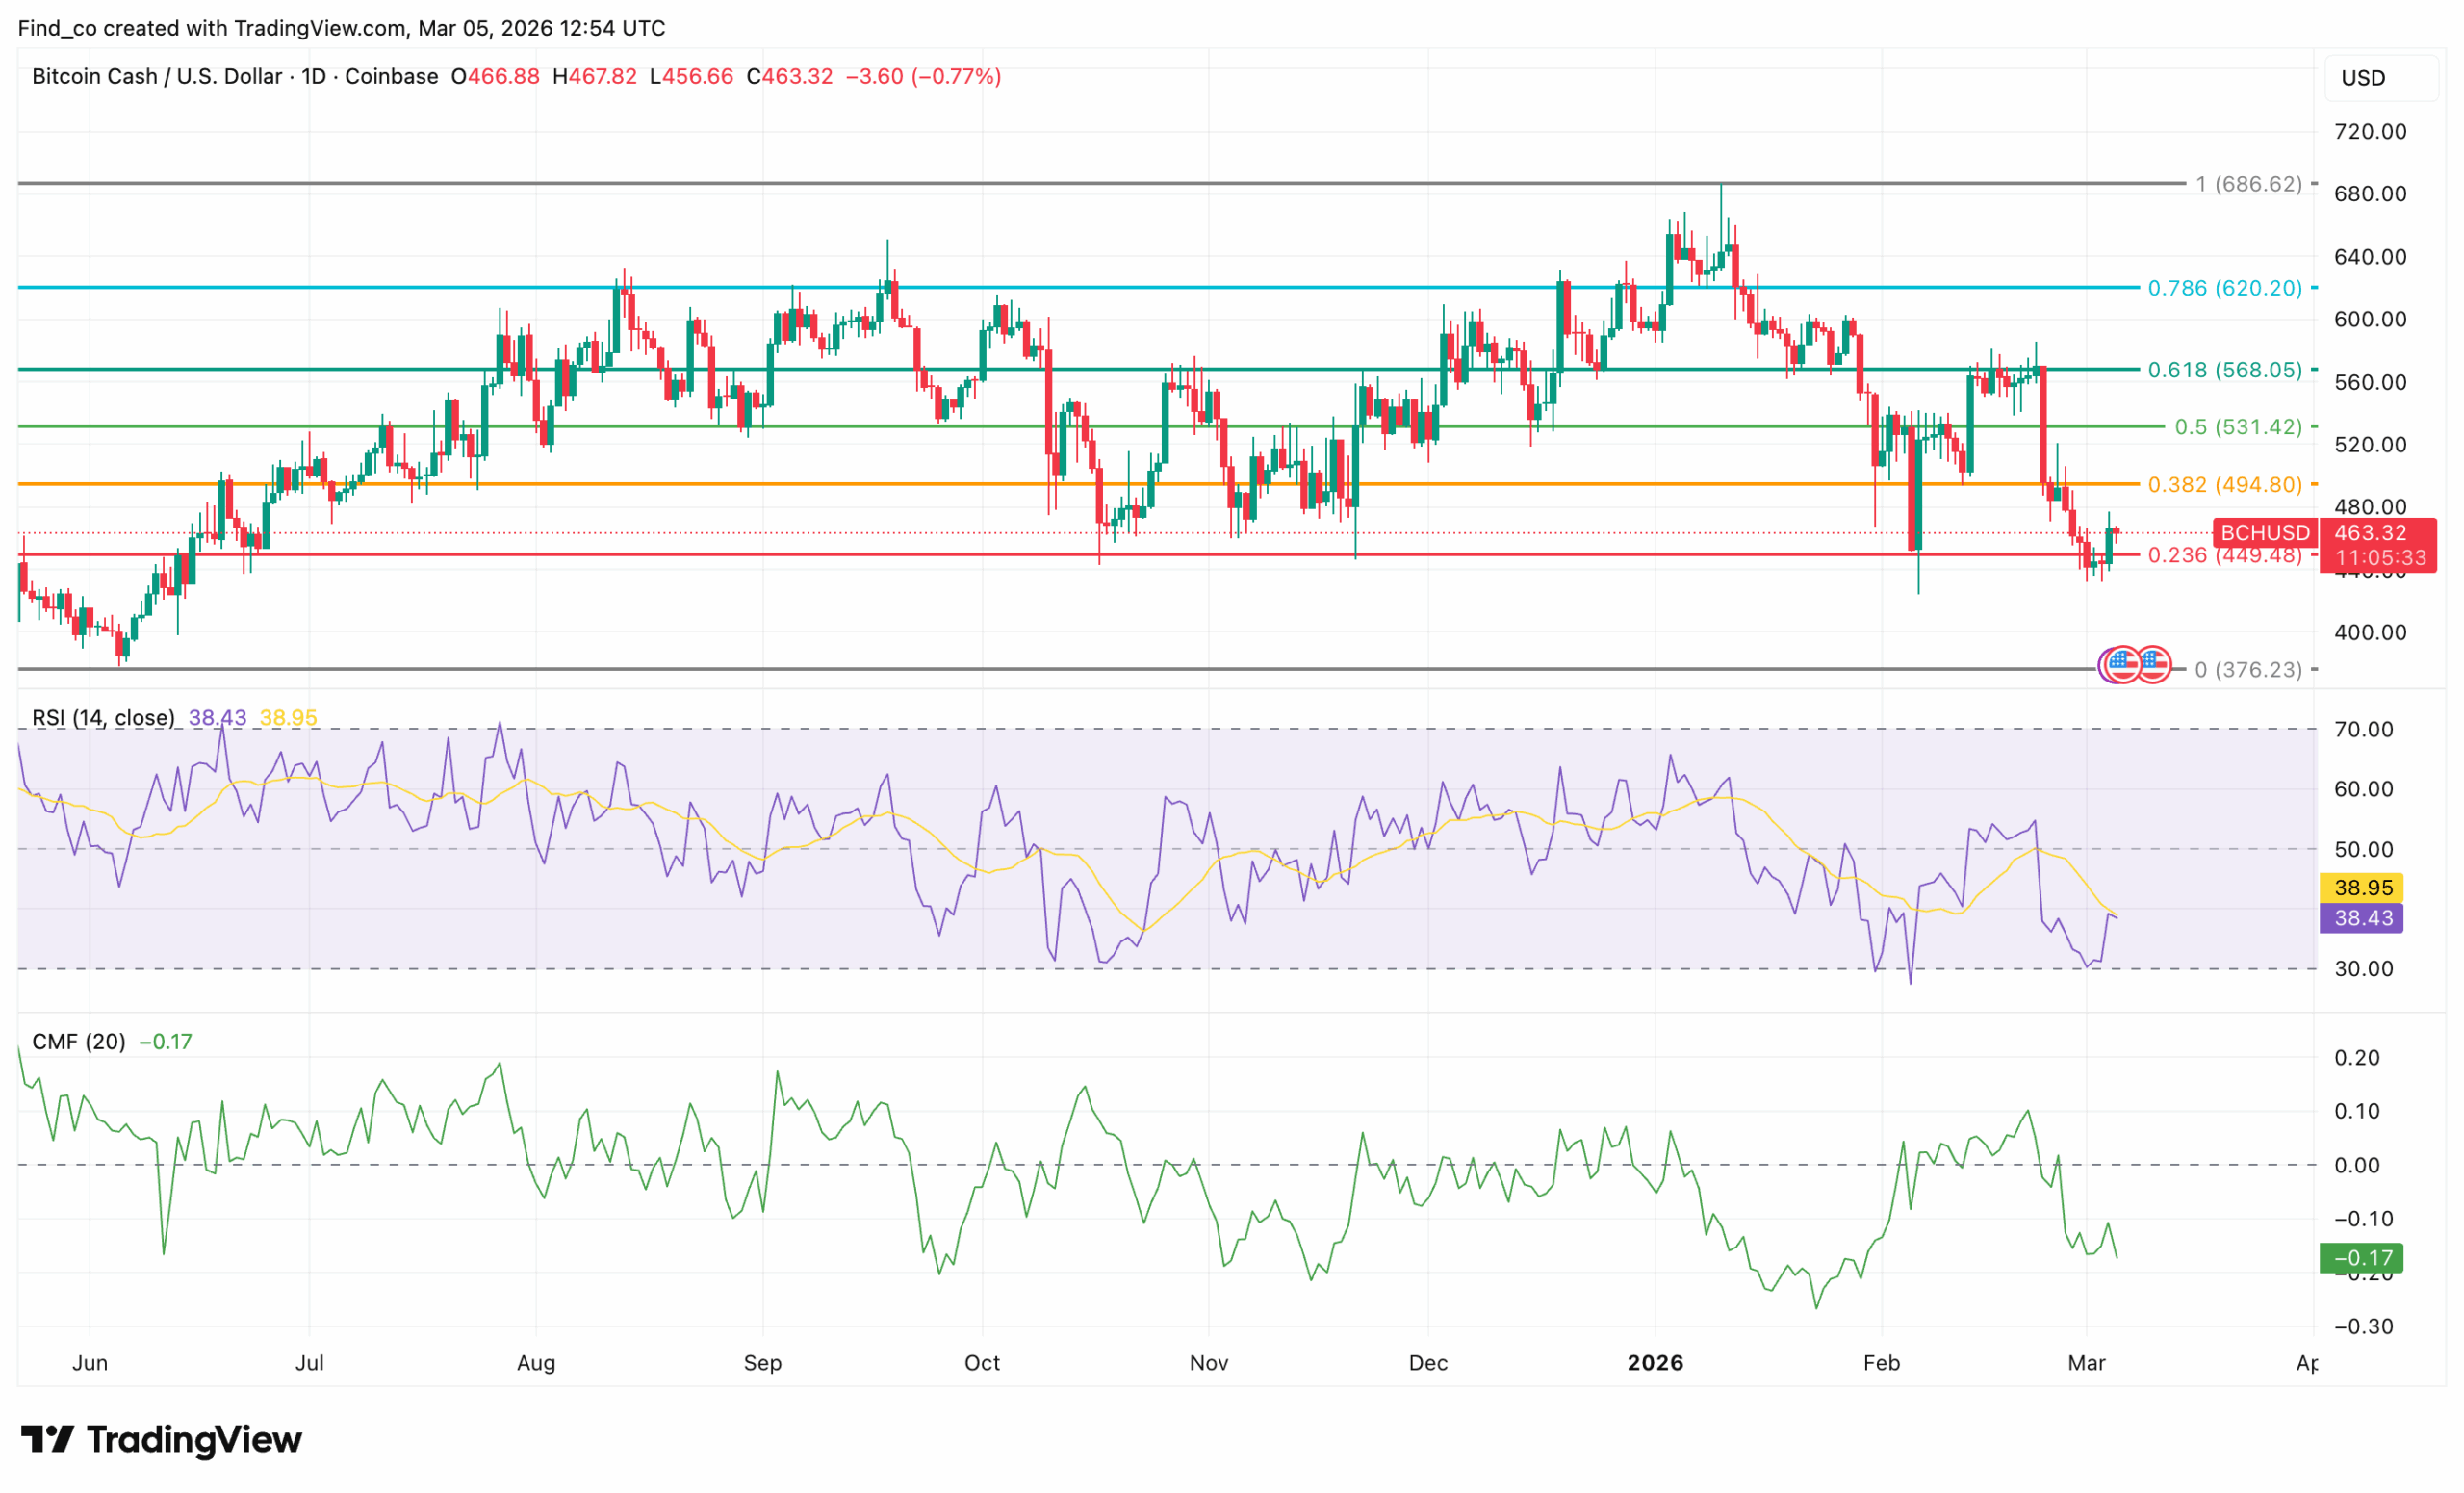
The $451.03 region could be decisive. Holding it may allow the BCH price to recover toward $496.28, potentially $532, or even $569.
On the contrary, failing at $451 opens the way to $377, a historically important support level.
The information provided in this article is for informational purposes only. It is not intended to be, nor should it be construed as, financial advice. We do not make any warranties regarding the completeness, reliability, or accuracy of this information. All investments involve risk, and past performance does not guarantee future results. We recommend consulting a financial advisor before making any investment decisions.

Victor Olanrewaju is a crypto analyst and reporter at CCN with deep roots in on-chain research and technical analysis. His crypto journey began in 2017, but it was the 2020 Uniswap airdrop that sparked a full-time pivot into the space.
With a foundation in copywriting, Victor honed his craft creating high-converting content for leading crypto brokers — most notably an XRP price prediction that ranked #1 on Google during the 2021 bull run.
He later joined AMBCrypto in 2022, where he combined storytelling with technical and on-chain analysis to cover key market narratives.
In 2024, he expanded his expertise at BeInCrypto, collaborating with analysts and using tools like Glassnode, Santiment, and IntoTheBlock to break down Bitcoin and altcoin trends.
At CCN, Victor covers the top cryptocurrencies, memecoins, macro shifts, blending real-time insights with deep-dive metrics.
He holds a Bachelor’s degree in Physics from the University of Ibadan, equipping him to simplify complex data for a wide audience. Follow his work or connect on LinkedIn or X.


Leave a comment