

The cryptocurrency market recently experienced one of its most volatile weeks of the year. plummeted toward the $59,000 threshold, wiping out over $100 billion from the total market capitalization in a single day and pushing the Crypto Fear & Greed Index deep into “Extreme Fear” territory.
In previous cycles, sharp post-Halving corrections were viewed as a natural part of wealth transfer from short-term speculators to long-term holders. However, 2026 marks a critical turning point. For the first time in Bitcoin’s history, the market must test the resilience of an entire ecosystem backed by spot ETFs, Bitcoin Treasury Companies, and hundreds of billions of dollars in institutional capital.
To determine whether Bitcoin’s traditional 4-year cycle, a market model driven by Halving events that historically triggers massive rallies followed by deep corrections, is still on track, investors must look at two major market trends happening at the same time: the micro leverage flush and the macro demand stress.
Anatomy of a Leverage Flush
From a market structure perspective, the recent downturn carries all the classic traits of a traditional leverage wipeout.
Historically, post-Halving cycles never move in a straight line. Bitcoin has always experienced deep corrections of 20% to 40% before establishing a sustainable uptrend. This phase acts as a necessary filter to flush out excess leverage, return funding rates to neutral, and cool down short-term speculation.
According to data from Coinglass, the most intense sell-off during the first week of June forced the liquidation of roughly $6.6 billion in leveraged positions, with the vast majority being long contracts. This was the primary driver behind the market’s massive “flush”
Figure 1: Cryptocurrency Liquidation History, Coinglass.com
In the current macroeconomic landscape, steady outflows from Crypto ETFs since early May have weakened spot market liquidity. This laid the groundwork for the sharp drop, triggering a chain reaction of cascading liquidations in the derivatives market.

Figure 2: Crypto ETF Net Flows, Coinglass.com
Compounding this pressure, rising geopolitical tensions have pushed global risk appetite into a defensive, “risk-off” posture. At the same time, institutional investors have begun reassessing the risks associated with public companies holding massive amounts of Bitcoin on their balance sheets.
Beyond Leverage: Bitcoin’s Biggest Demand Source is Under Fire
Throughout 2024–2025, one of the strongest bullish arguments for Bitcoin was the rise of Bitcoin Treasury Companies.
The business model is relatively straightforward:
- Raise capital from the equity markets.
- Use that capital to buy Bitcoin.
- Issue more equity or debt to buy even more Bitcoin.
No company embodies this strategy more clearly than Michael Saylor’s Strategy.
In a bull market, this mechanism functions almost flawlessly. Rising Bitcoin prices drive up the company’s stock price, making it easier to raise capital and buy more Bitcoin. This creates a powerful, positive feedback loop.
However, the current correction is testing this model like never before.
Recently, Strategy announced the sale of 32 BTC, its first sale since late 2022. In terms of size, this transaction is completely negligible compared to the tens of billions of dollars in Bitcoin the company holds.
Yet, the market’s primary concern is not the volume sold. The real shift is in market perception.
A company once viewed as the ultimate symbol of the “buy and hold forever” philosophy has shown that selling is on the table when liquidity needs arise. Even so, the transaction size remains far too small to impact Bitcoin’s supply, and there is currently no evidence that Strategy is abandoning its long-term accumulation strategy.
Meanwhile, the broader group of Bitcoin Treasury Companies is facing severe pressure from capital markets. According to Bloomberg data, the aggregate market cap of these companies collapsed from roughly $134 billion to $72 billion, wiping out over $62 billion in just a few months.
This indicates that investors are no longer just repricing Bitcoin itself; they are repricing the entire model of raising capital to hoard Bitcoin.
If the narrative in 2025 was these companies will continuously absorb Bitcoin supply, the market in 2026 is asking the opposite question: Will these corporations remain a source of long-term demand, or could they become a massive source of potential sell pressure if global financial conditions continue to tighten?
Technical Analysis: Bitcoin’s Current Setup
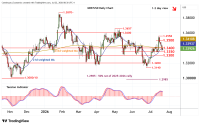
Looking at the weekly chart, the technical picture shows that the medium-term downtrend still maintains the upper hand.
After hitting an all-time high near $120,000 in late 2025, Bitcoin has consistently printed lower highs and lower lows, confirming a bearish structure on higher timeframes.
Figure 3: BTCUSD weekly chart, IUX
Notably, the relief rally from $65,000 back toward $82,000 during April–May failed to break above the previous lower high. The rapid reversal from this area suggests that buying pressure is not yet strong enough to reverse the medium-term trend.
The $60,000 level has now become an incredibly vital technical battleground. It represents:
- A major psychological support level.
- The accumulation base formed before Bitcoin’s massive breakout in 2024.
If the $60,000 zone holds, the market could sustain a consolidation phase similar to mid-cycle corrections seen in past years. On the other hand, if this support breaks convincingly on the weekly close, the current bearish structure could open the door to test deeper liquidity pools below.
From a momentum standpoint, the weekly RSI is hovering around 35. This shows that while the market has weakened significantly, it has not yet reached the extreme oversold conditions typical of major cycle bottoms. In short, selling pressure has intensified, but we have yet to see definitive signs of total market capitulation. This is why price action around $60,000 over the coming weeks will be critical to watch.
Key Takeaways for Traders and Investors
- Look Beyond Liquidations: The recent leverage flush was the immediate trigger for the drop, but it is not the sole cause. ETF flows, global liquidity conditions, and the financial health of Bitcoin Treasury Companies are playing an increasingly dominant role in shaping the trend.
- The $60,000 Level is the Ultimate Line in the Sand: This is more than a psychological number. It is a long-term technical support line that separates a standard medium-term correction from the risk of a prolonged downtrend.
- Monitor Bitcoin Treasury Companies: In past cycles, traders primarily tracked miners and spot ETF volumes. Today, Strategy and similar corporate holders are equally vital variables. Their ongoing ability to raise capital will directly impact Bitcoin’s demand side in the months ahead.
- The 4-Year Cycle is Evolving: History shows deep post-Halving drawdowns are normal. However, Bitcoin in 2026 operates in a completely different ecosystem than in 2020 or 2016. The key question is no longer just whether the 4-year cycle remains valid, but whether the largest buyers of this cycle can afford to support the market through this rough patch.


Leave a comment