

Zcash (ZEC) price shows mild recovery during early Asian hours on Friday, rising toward the $500 mark. Retail demand supports ZEC’s recovery, with an 18% rise in its futures Open Interest, likely linked to the announcement of the Ironwood shielded pool.
Technically, ZEC should clear a key Fibonacci resistance level near $520 to test its all-time high of $690.
Upcoming Ironwood shielded pool lifts retail demand
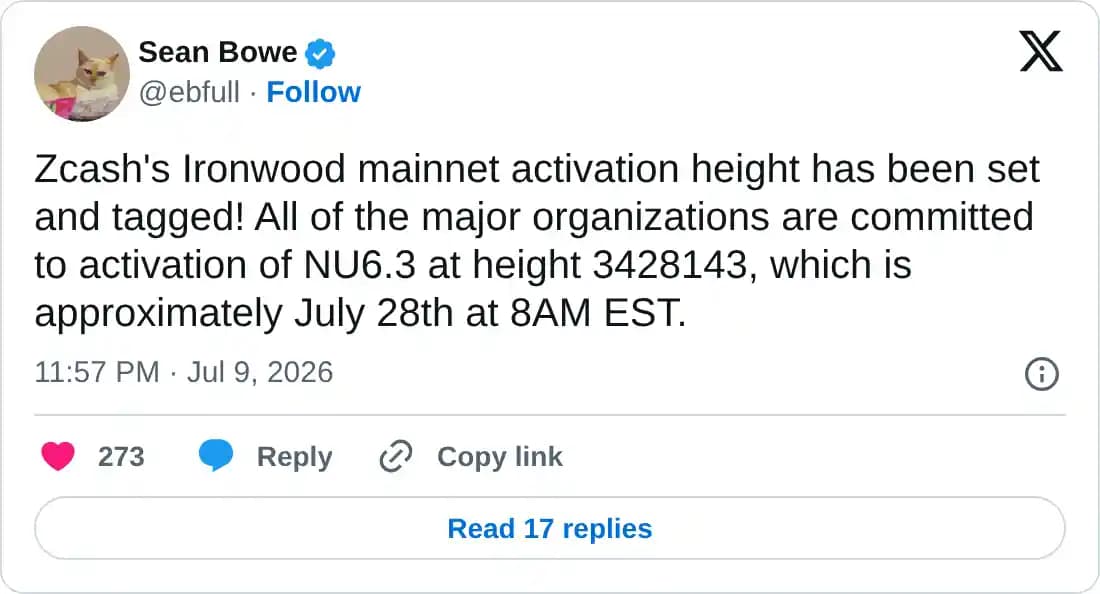
Zcash developer Sean Bowe announced in an X post on Friday that the Ironwood shielded pool is set for mainnet activation at block height 3428143, around July 28, with full commitment from major organizations.
The successor to the current Orchard pool directs a new shielded value while restricting the old pool to spend only to restore the integrity of the verifiable circulating supply. The upgrade follows the recent counterfeiting vulnerability discovered in the Orchard pool, adding formal verification, independent audits, and quantum-recoverable note formats to enhance security.
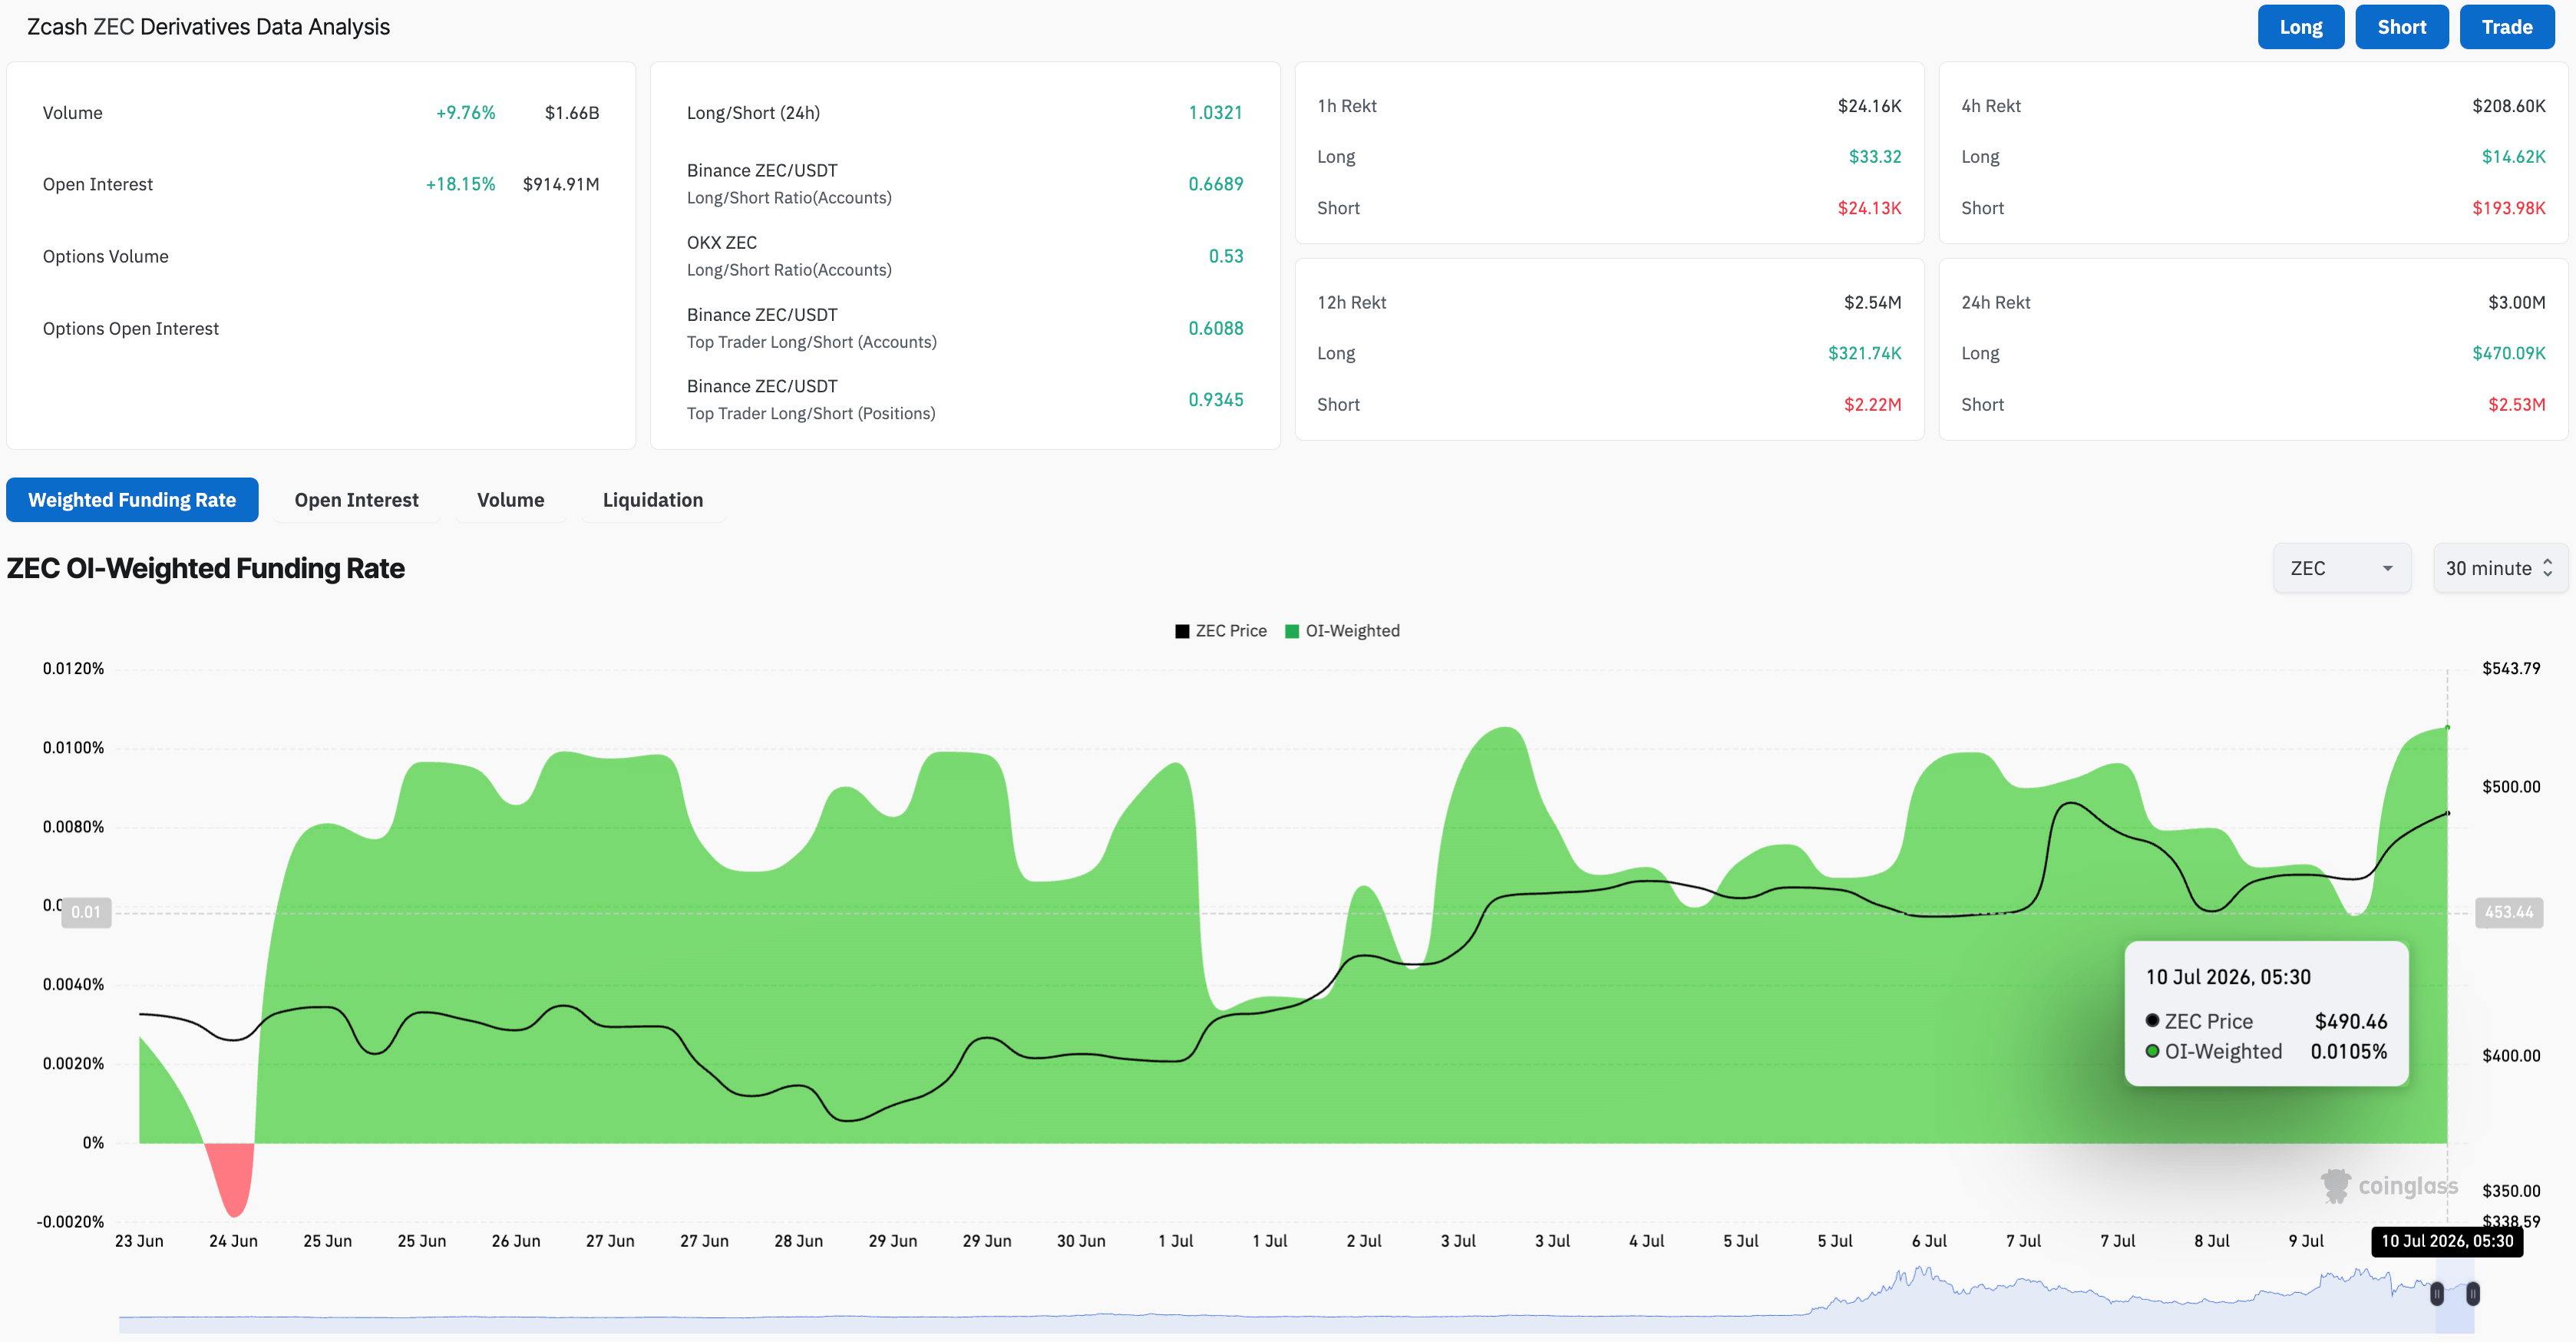
Zcash’s attempt to restore trust in its privacy coin and shielded pool lifts retail demand for derivatives. CoinGlass data shows ZEC futures Open Interest (OI) is up 18% over the last 24 hours to $914.91 million, reflecting increased capital inflows boosting positional buildup.
In addition, the volume is up roughly 10% to $1.66 billion in the same period, indicating increased activity, while a surge in the positive funding rate to 0.0105% suggests that traders are willing to take long positions even at a premium.
Renewed retail support amid a network upgrade positions Zcash for an upside rally, provided that broader market sentiment holds steady even as geopolitical tensions fuel near-term volatility.
Will Zcash rally above $500?
Zcash hovers around $90 on Friday, maintaining a near-term bullish bias as price holds well above the 50-day Exponential Moving Average (EMA) at $457 and the 200-day EMA at $388. From a technical perspective, ZEC rises above a broken resistance trendline of a symmetrical triangle pattern, near $460.
The breakout rally is heading toward the 78.6% Fibonacci retracement level at $520, measured over the upswing from $184 to $690. A decisive close above this level could target the all-time high of $690, paving the way for a fresh price discovery phase.
That said, momentum remains constructive, with the Relative Strength Index (RSI) at 57 showing a steady upward trend, crossing above the midline, while the Moving Average Convergence Divergence (MACD) line enters positive territory, together hinting at persistent upside pressure.

On the downside, immediate support is seen at the former descending trendline around $460, reinforced by the 50-day EMA at $457. A slip below this zone could test the 200-day EMA and the nearby rising support trendline near $388.
(The technical analysis of this story was written with the help of an AI tool. Know more.)












Leave a comment