

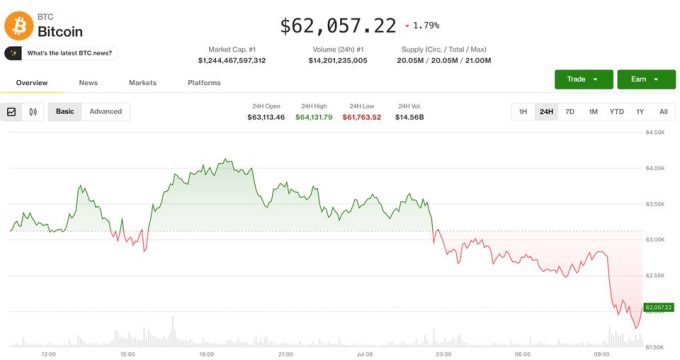
Bitcoin (BTC) is extending its losses on Thursday for the third consecutive day amid renewed tensions between the US and Iran. Risk-off market sentiment intensifies, with Jupiter (JUP) and Pi Network (PI) emerging as the biggest losers over the last 24 hours.
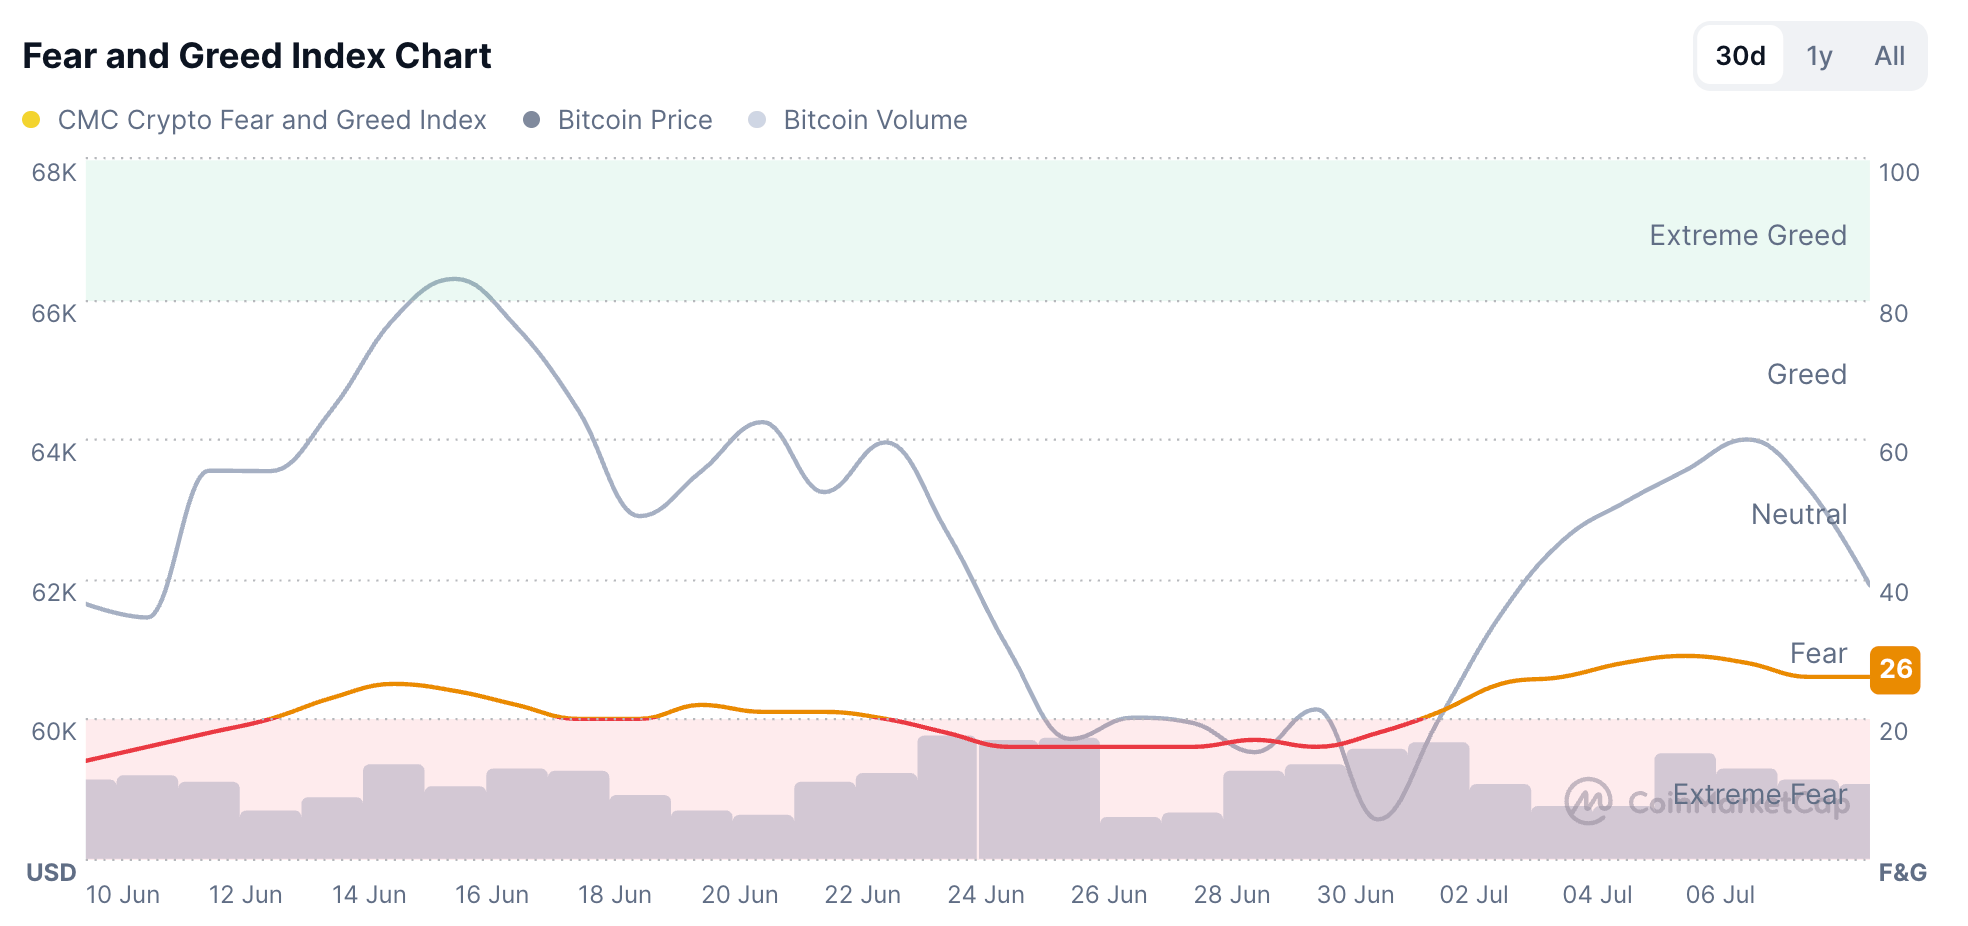
CoinMarketCap’s Crypto Fear and Greed Index is at 26 on Thursday, down from 29 on Monday, indicating a clear increase in risk-off sentiment.
Bitcoin vulnerable to steeper decline
Bitcoin shows a steady decline so far this week, reversing before testing the $65,000 threshold. A clear lower-high formation on the daily chart reaffirms the near-term bearish tone, while BTC remains well below the 50-day Exponential Moving Average (EMA) at $65,412 and the 200-day EMA at $75,821.
The Moving Average Convergence Divergence (MACD) approaches its signal line, raising the risk of a bearish crossover, while the Relative Strength Index (RSI) at 44 dips below the midline, suggesting that buying pressure remains subdued.
Looking down, the horizontal support around $60,000 emerges as the zone where dip-buying interest could attempt to slow the decline.

Initial resistance emerges at the 50-day EMA around $65,412, with a subsequent barrier near the broken rising trendline at roughly $75,008. The 200-day EMA at $75,821 marks a higher, more structural ceiling that would need to be reclaimed to meaningfully shift the bearish bias.
Jupiter and Pi Network extend losses
Jupiter extends losses on Thursday, following a 10% drop the previous day. The DeFi token remains capped below a local resistance trendline, near the 78.6% Fibonacci retracement level at $0.2406, measured from the $0.2766 to $0.1444 downswing.
The 50-day EMA at $0.2070 serves as the key support zone, further reinforced by the 50% retracement level at $0.1998. A slip below this zone could target the 23.6% Fibonacci retracement level at $0.1683, followed by the Fibonacci anchor at $0.1444.
Momentum suggests the broader downtrend is intact, with recent recovery attempts losing traction as the MACD has slipped below its signal line and the RSI at 47 hints at fading bullish momentum.
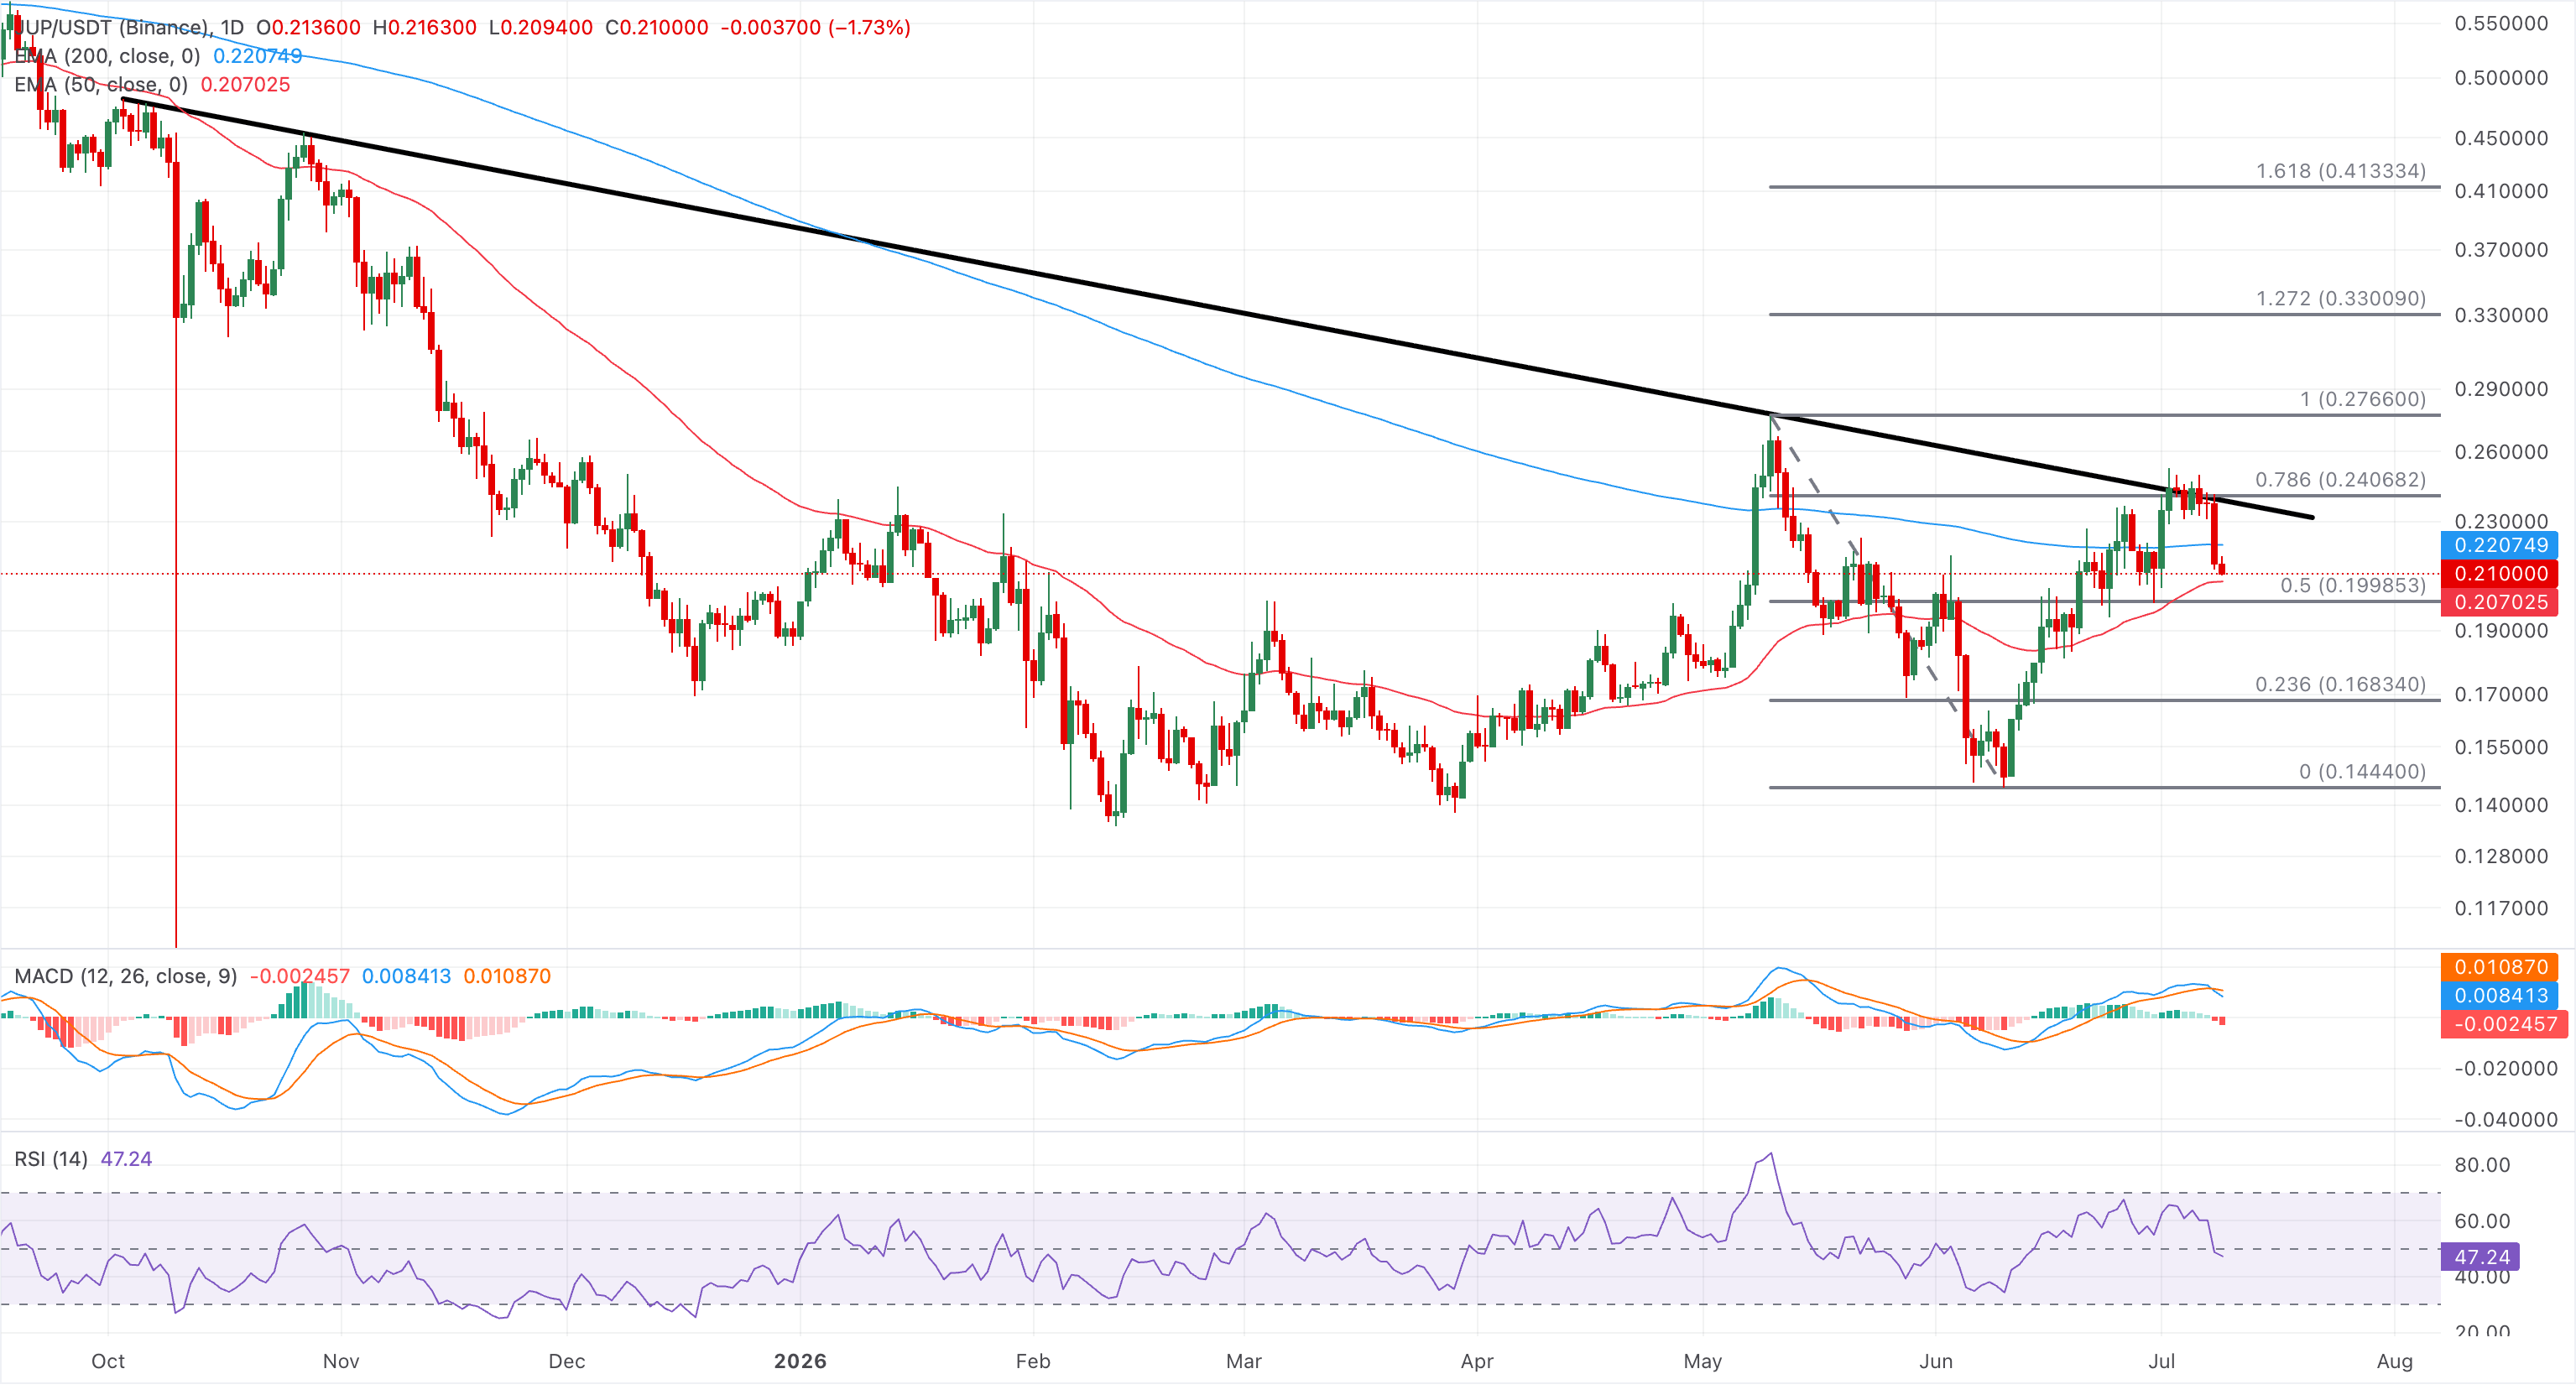
On the topside, immediate resistance sits at the 200-day EMA near $0.2207, and a sustained break above this barrier would open the way toward the descending trendline break zone around $0.2418.
Pi Network is edging closer to the $0.1000 psychological threshold as the bearish phase extends. PI holds well below the 50-day EMA at $0.1311 and the 200-day EMA at $0.1901, reaffirming a long-term bearish trend.
The MACD and signal line continue to decline as the negative histogram expands, while the RSI at 21 falls deeper into the oversold territory, suggesting that downside momentum remains dominant even as short-term selling pressure may be nearing exhaustion.
PI token tests the S1 Pivot Point at $0.1010, which guards the downside to the S2 Pivot Point at $0.0867.
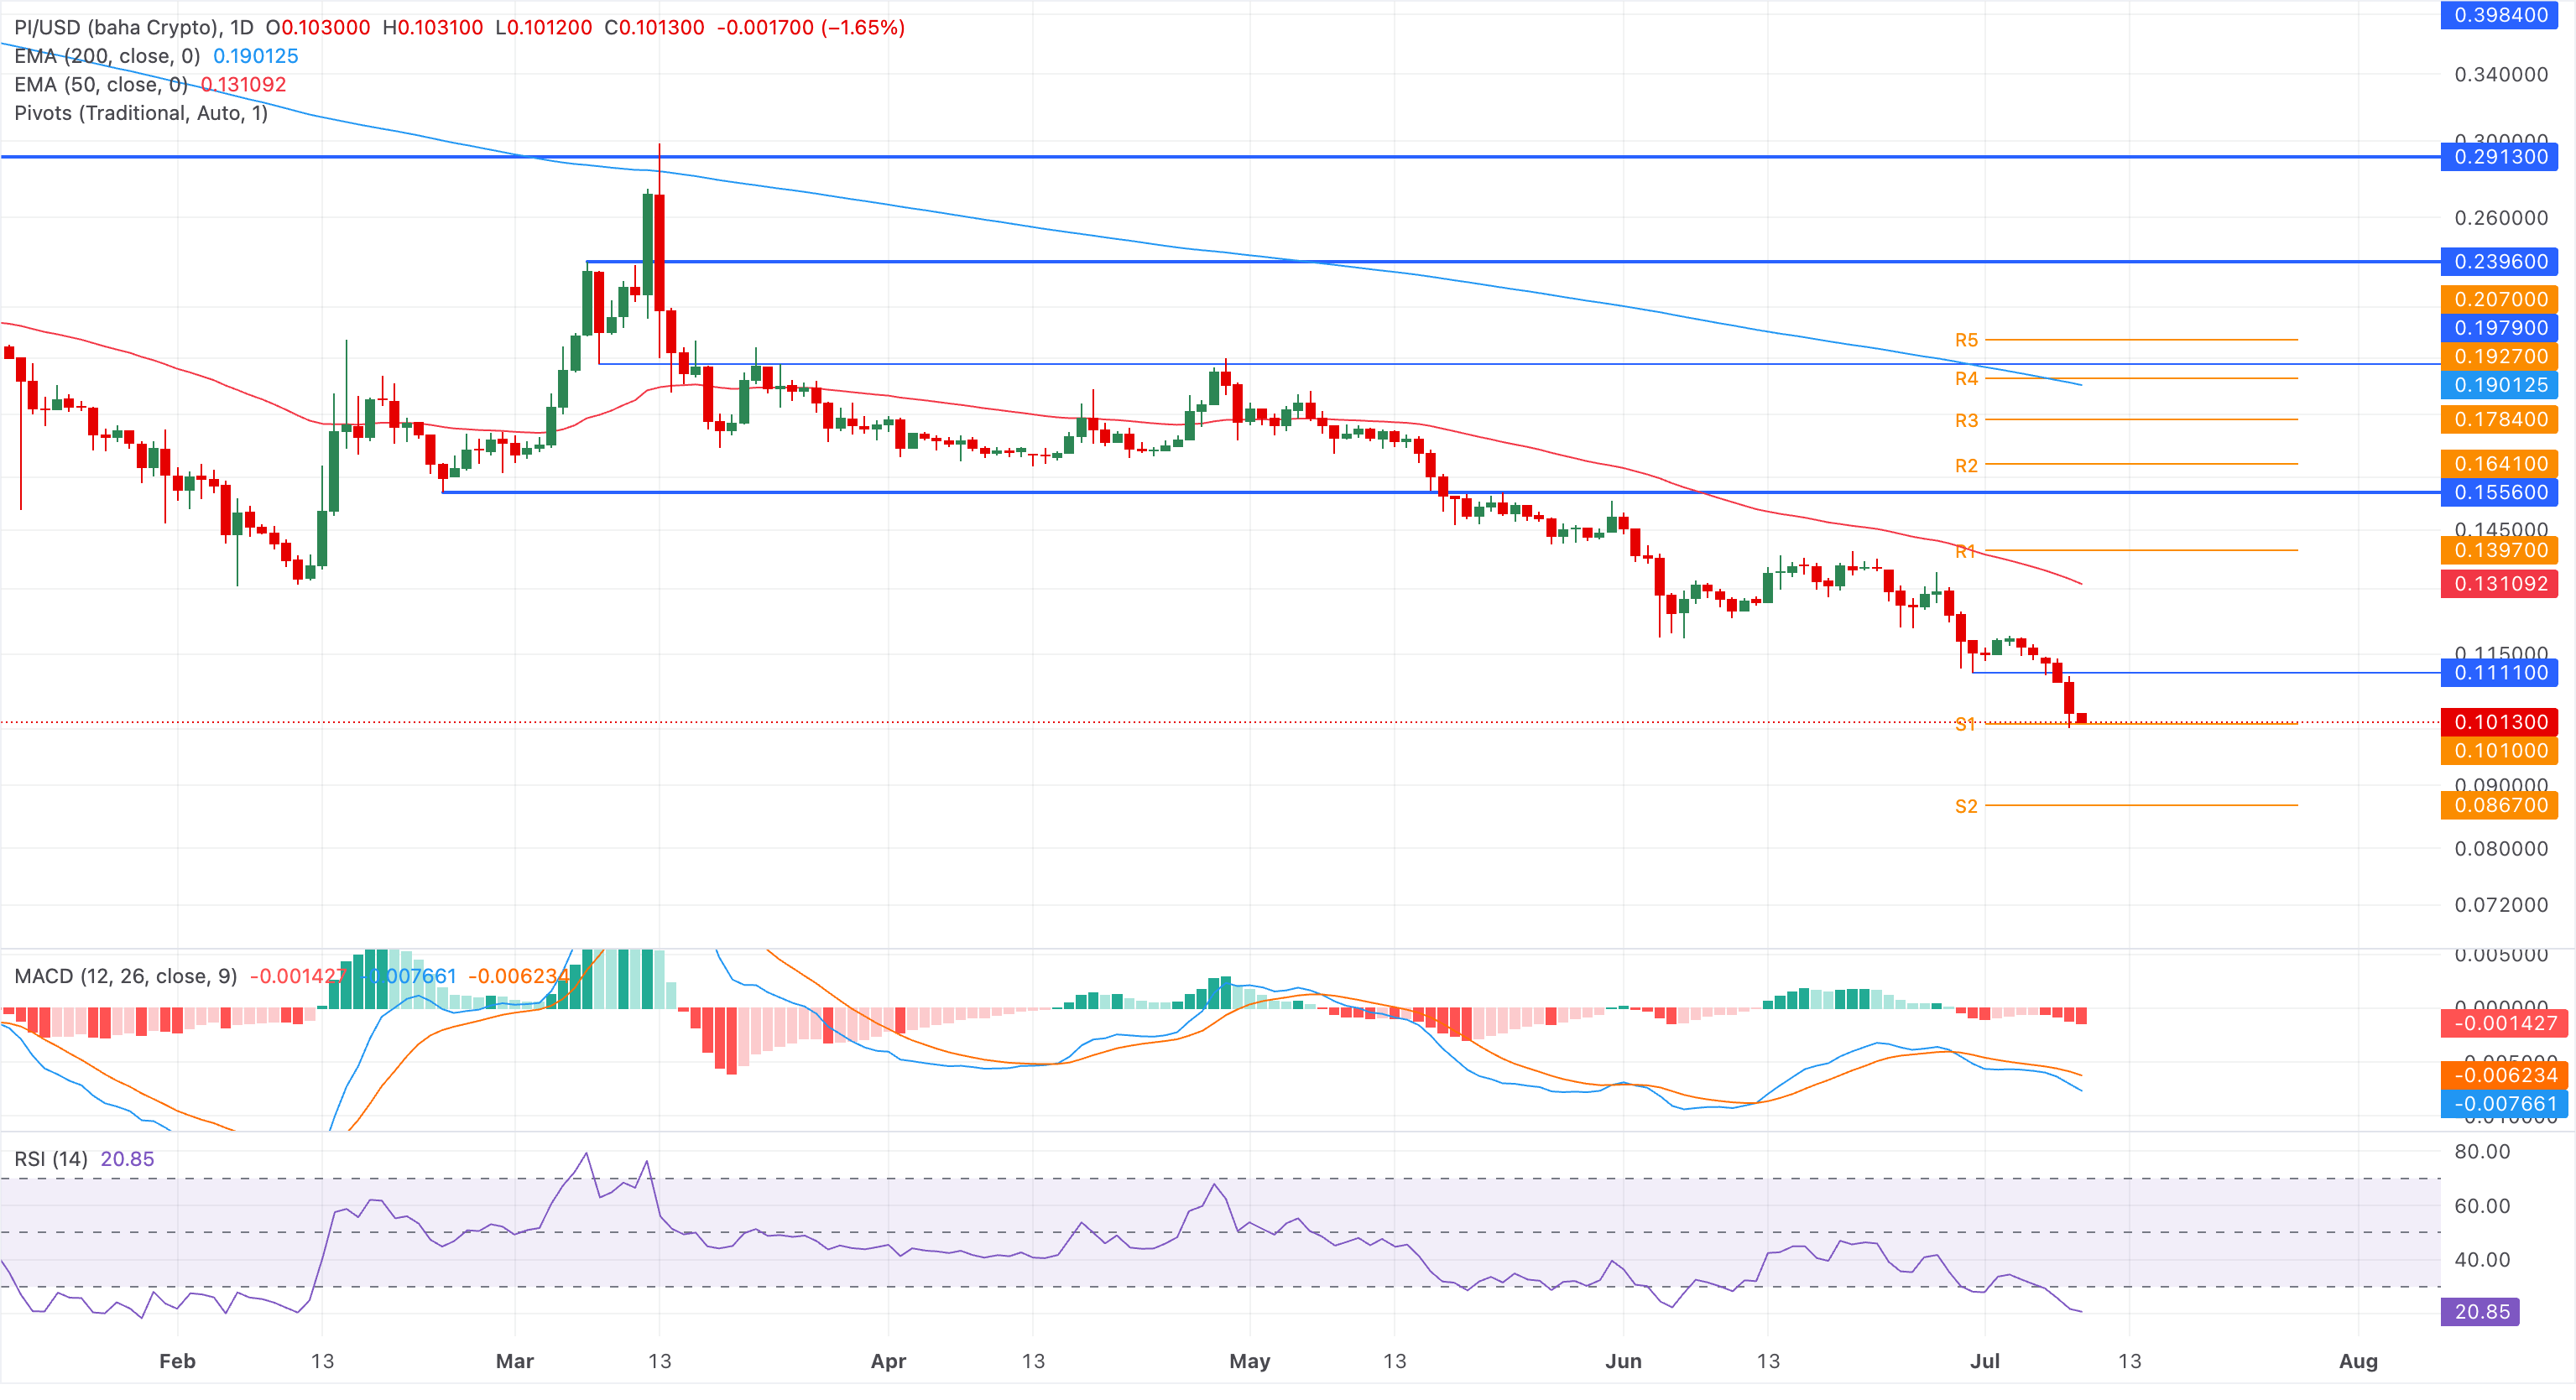
Looking up, initial resistance aligns with the 50-day EMA at $0.1311, which acts as the first cap on any rebound.
(The technical analysis of this story was written with the help of an AI tool. Know more.)












Leave a comment