
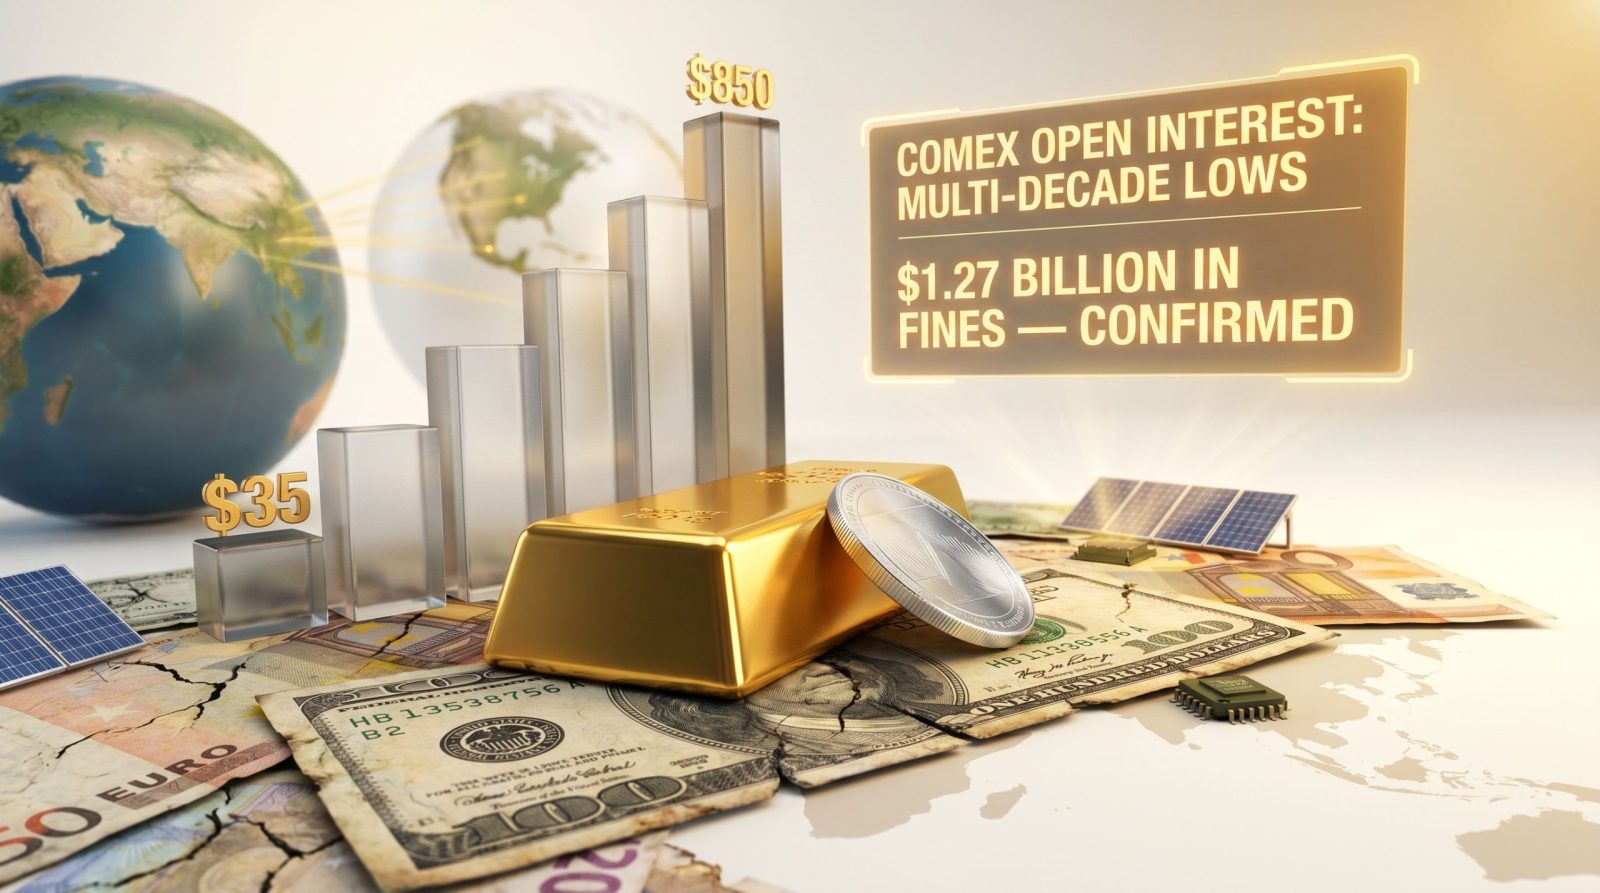
History offers a counterintuitive lesson for investors conditioned to believe that rising interest rates are bad for gold. During the 1970s, the U.S. Federal funds rate climbed from roughly 3.75% to 19% by 1981 — a period of aggressive monetary tightening by any measure. Yet over that same window, gold surged from $35 per ounce to $850, representing a gain of more than 2,300%. Silver followed a similarly dramatic trajectory, and the dynamics underlying gold and silver market manipulation and fiat currency collapse were already beginning to take shape.
The conventional model that frames gold as a yield-less asset disadvantaged by rising nominal rates misses a critical variable: currency risk. When the fundamental question shifts from “what is the return on my investment?” to “can I trust the currency my investment is denominated in?”, gold and silver stop behaving like commodities and start behaving like monetary alternatives. That distinction is not theoretical — it is playing out again in real time across sovereign bond markets, commodity pricing structures, and central bank reserve allocations.
When big ASX news breaks, our subscribers know first
The Bond Market Signal That Precedes Everything Else
Long-End Yield Breakouts Across the G7
The most significant early-warning indicator for monetary stress is not a headline inflation print or a central bank statement — it is the long bond yield. When investors in long-duration sovereign debt begin demanding higher compensation, they are implicitly communicating that they no longer trust the purchasing power of the currency being repaid.
Long-end yields in Germany, France, and Japan have already broken out to the upside. The pattern elsewhere across G7 nations appears to be following. This matters because these are not fringe economies experiencing idiosyncratic stress — they are the core pillars of the post-Bretton Woods financial architecture.
Commodity Prices as a Purchasing Power Thermometer
A broad-based rise across the entire commodity complex is not simply a supply disruption story. When the whole commodity basket moves upward simultaneously, the more accurate interpretation is that the purchasing power of the currency being used to measure those commodities is declining. This reframing transforms inflation data from a policy problem into a structural monetary signal.
The expectation among global investors that the purchasing power of major fiat currencies will continue to erode is precisely why long-end bond yields face persistent upward pressure. A nominal yield of 5% on a 12-to-15-year U.S. Treasury may offer inadequate compensation if the investor expects currency debasement to outpace that return over the same period.
This dynamic was already developing across the commodity space before any geopolitical escalation provided a convenient narrative explanation. The inflation story, in other words, predates the headlines used to explain it. Furthermore, the world losing trust in the U.S. dollar is adding additional structural pressure to this trend.
Is the Fiat Currency System Approaching a Structural Breaking Point?
Debasement Is Not the Same as Collapse
There is an important analytical distinction between currency debasement and outright currency collapse. Debasement — the gradual erosion of purchasing power through money supply expansion, deficit spending, and negative real rates — is well-documented, broadly accepted by mainstream economists, and already measurable through inflation data and debt metrics. Collapse is a different claim entirely.
The more defensible thesis is not that fiat currencies fail suddenly, but that confidence in them deteriorates over a longer arc, with periodic acceleration. Some macro analysts have raised scenarios where a significant loss of dollar confidence could materialise within a 12-to-18-month horizon, though this represents a tail-risk projection rather than a base-case forecast. Most mainstream economic institutions do not support the thesis of imminent systemic collapse. For a deeper perspective on why fiat currencies fail, the historical evidence points consistently to gradual erosion rather than sudden implosion.
| Claim | Evidence Status | Mainstream Position |
|---|---|---|
| Fiat currencies are being debased | Supported by inflation data and debt metrics | Broadly accepted |
| Central banks are net buyers of gold | Confirmed by IMF and World Gold Council data | Confirmed |
| Dollar collapse within 12 to 18 months | Speculative tail-risk scenario | Disputed by most economists |
| Fiat system is structurally ending | Argued by hard-money analysts | Not supported by mainstream data |
| Gold preserves purchasing power long-term | Historically supported | Broadly accepted |
Central Bank Gold Buying: Diversification or a Deeper Signal?
Central banks globally have been consistent net buyers of gold since at least 2022, with the scale and persistence of this accumulation now historically significant according to World Gold Council data. The publicly stated rationale is portfolio diversification and reserve management.
A less widely discussed interpretation is that sovereign reserve managers are not simply buying gold — they are reducing their exposure to dollar-denominated assets. When central banks across Asia, the Middle East, and Eastern Europe add gold to their reserves, the implicit transaction is a sale of fiat currency instruments. Whether this represents prudent diversification or a more fundamental vote of no confidence in the dollar system depends on how one interprets the scale and coordination of the movement.
Notably, major financial institutions have begun publishing meaningfully higher gold price forecasts. The mechanism behind this shift appears partly informed by direct intelligence from reserve managers in Asia and other regions, who have communicated off-the-record that their primary motivation is reducing dollar exposure rather than acquiring gold as a commodity.
Geopolitical Fractures and the Anti-Dollar Narrative
The St. Petersburg International Economic Forum has become a significant gathering point for the emerging anti-dollar narrative. Attendance reportedly spans delegates from more than 80 governments, and the forum has served as a platform for explicit statements encouraging nations to reduce reliance on Western financial infrastructure. The informal conversations at events like this, occurring alongside formal presentations, carry considerable weight in shaping sovereign financial policy across the Global South and BRICS-aligned nations.
How Gold and Silver Are Actually Priced — and Where the System Strains
The Derivatives-Driven Pricing Mechanism
Since the collapse of the London Gold Pool in the late 1960s, gold and silver prices in the West have been established primarily through derivatives markets — futures contracts traded on exchanges like COMEX — rather than through physical supply and demand balancing. This structure allows paper-denominated exposure to precious metals to be created in multiples that bear no direct relationship to available physical supply. Understanding how LBMA and COMEX interact within this framework is essential for any serious investor. The consequence is that Western benchmark prices for gold and silver reflect the marginal trading activity of leveraged financial participants rather than the true cost of sourcing and delivering physical metal.
The Oil Market Parallel: Paper Prices vs. Physical Reality
A useful analogy comes from the crude oil market. Western benchmark prices such as West Texas Intermediate represent a specific grade of crude at a specific delivery point, and they frequently diverge from what distressed buyers actually pay in supply-constrained regions. Reports have circulated of buyers in acute need paying multiples of the benchmark price — in one documented case, a transaction reportedly involving $280 per barrel when an island nation with no alternatives needed immediate delivery from a passing tanker.
The same structural divergence is emerging in precious metals. Metal flowing from West to East at persistent premiums suggests that Western paper prices are systematically understating the true market-clearing price for physical delivery.
China’s Silver Dynamics: What Customs Data Reveals
China’s silver import and export data tells a particularly revealing story. The volume of silver entering China currently exceeds outbound flows by approximately 3 to 1, despite China ranking among the world’s top three silver-producing nations alongside Mexico and Peru. A 13% import tax on silver entering China accounts for some of the premium paid, but does not fully explain the sustained directional flow.
China’s silver production profile is also more complex than simple mine output figures suggest. Approximately 70% of China’s silver supply is derived not from dedicated silver mines but from the refining of imported non-ferrous ores — making the country simultaneously a major refiner, a growing net importer, and a significant strategic accumulator of the metal.
India adds another dimension to the physical demand picture. Government subsidies encouraging domestic photovoltaic manufacturing — with industrial conglomerates committing large-scale capital to solar panel production — have created substantial and growing silver import requirements that are structurally demand-driven rather than speculative.
The Documented History of Precious Metals Market Manipulation
What Regulators Have Actually Proven
Discussions of gold and silver market manipulation and fiat currency collapse often conflate confirmed historical enforcement actions with contested ongoing allegations. It is important to separate these categories clearly.
Between 2008 and 2016, major financial institutions engaged in silver market manipulation through a practice known as spoofing — placing and cancelling large orders to create artificial price signals. Regulatory enforcement resulted in approximately $1.27 billion in combined fines and criminal convictions, including prison sentences for at least two traders at JPMorgan. This is not speculation or conspiracy theory — it is adjudicated fact, confirmed through the U.S. court system and regulatory proceedings.
| Category | Status |
|---|---|
| Silver spoofing (2008 to 2016) | Confirmed through fines and criminal convictions |
| London gold price-setting scrutiny | Regulatory investigation confirmed |
| Ongoing systematic suppression as policy | Contested — alternative structural explanations exist |
| Price moves explained by margin calls and crowded-trade unwinding | Supported by market structure data |
| Indefinite price suppression as deliberate ongoing policy | Speculative — not adjudicated |
Spoofing, Layering, and Why Short-Term Selloffs Can Mislead
Spoofing involves placing large visible orders that are never intended for execution, creating the illusion of supply or demand to move prices in a desired direction before the orders are pulled. Layering is a related technique where multiple orders at different price levels create a false impression of depth. Both techniques exploit the fact that market participants react to visible order flow even before execution occurs.
The practical consequence for precious metals investors is that sharp short-term price declines do not necessarily indicate fundamental weakness. However, a market participant with significant net short exposure has a clear incentive to manufacture selling pressure through order flow manipulation, particularly when leveraged long positions can be forced into margin calls that then create genuine selling momentum. Analysts examining sudden gold and silver selloffs have noted that these episodes frequently reveal more about positioning mechanics than about underlying fundamentals.
COMEX Open Interest at Multi-Decade Lows: Reading the Structural Signal
An Unusual Divergence
One of the most analytically unusual features of the current gold and silver market is the simultaneous occurrence of near-record spot prices and multi-decade lows in COMEX futures open interest. Gold and silver open interest levels have fallen to ranges not seen since approximately 2005, a period when prices were a fraction of current levels.
Standard market logic would predict the opposite: high and rising prices should attract speculative participation, increasing open interest as traders and investors seek exposure to momentum. The fact that this is not happening warrants serious structural explanation.
Three Competing Explanations for Collapsing Futures Participation
-
Bullion bank positioning risk: Market makers carrying net short exposure to precious metals have a direct incentive to deter new long positions. Widening bid-ask spreads — quoting offers substantially above screen prices — raises the effective cost of entering a long futures position, discouraging participation while simultaneously reducing the risk that new buyers push prices higher against existing short books.
-
Counterparty trust erosion: Institutional participants who have observed the history of manipulation enforcement, and who are watching physical metal migrate persistently from West to East, may be questioning whether paper settlement mechanisms genuinely represent gold and silver ownership.
-
Physical market migration: Capital that previously expressed precious metals views through derivatives is increasingly shifting toward physical ownership, removing that participation from futures open interest statistics entirely.
When open interest in silver futures falls to its lowest level in 20 years while spot prices are simultaneously above $50 per ounce, the market is not behaving like a well-functioning price discovery mechanism. It is behaving like a market with structural integrity problems.
The next major ASX story will hit our subscribers first
The Silver Market: Industrial Demand Meets Scarcity
The Structural Demand Transformation
Silver has historically been treated primarily as a monetary metal and secondarily as an industrial input. That hierarchy has inverted. Today, the fastest-growing demand categories for silver are industrial, and they are structurally driven rather than cyclical. In addition, the silver supply deficits now emerging globally are compounding the pressure on an already strained physical market.
Key demand drivers currently reshaping the silver market include:
- Photovoltaic manufacturing — solar panel production requires silver paste for electrical conductivity, and the global scaling of solar capacity represents a demand base that grows with every new installation
- Military and defence applications — ammunition production and electronics in defence systems have drawn down strategic silver stockpiles significantly, with reports suggesting military demand has consumed reserves that took decades to accumulate
- Investment demand — currently described by analysts as early-stage, with retail and institutional investors having only begun to engage with silver relative to prior cycle participation levels
- Indian industrial policy — government incentives for domestic solar manufacturing have converted major Indian conglomerates into large-scale silver importers, adding a sovereign policy dimension to demand that is unlikely to reverse
The Gold-to-Silver Ratio and Retail Rotation Dynamics
The gold-to-silver ratio — the number of silver ounces required to purchase one ounce of gold — currently sits at historically elevated levels. Prior periods of extreme ratio readings have preceded significant silver outperformance during the subsequent normalisation phase.
A psychologically important dynamic historically accompanies gold bull markets at higher price levels: as gold becomes unaffordable for retail investors on a per-ounce basis, purchasing interest rotates into silver. At a gold price of $6,000 per ounce, a single coin represents a meaningful commitment. At proportionate silver prices, fractional ownership remains accessible. This retail rotation dynamic has preceded sharp silver appreciation in prior cycles and represents a demand catalyst that has not yet fully activated in the current environment.
The October 2024 London Silver Lease Rate Spike
In October 2024, London silver lease rates spiked to approximately 40% — an extreme reading that revealed the degree to which immediately deliverable silver had become scarce. Lease rates reflect the cost of borrowing physical metal for short-term delivery obligations; when they spike to those levels, it signals that the metal simply is not available at normal terms.
This event coincided with the beginning of a silver price run that carried the metal above $50 per ounce, where it has subsequently remained. The lease rate spike provided a rare moment of transparency about the physical availability constraints that derivatives-based pricing ordinarily obscures.
Physical vs. Paper Exposure: Understanding What You Actually Own
For investors seeking precious metals exposure, the distinction between physical ownership and paper instruments carries real-world consequences that are frequently underappreciated.
| Factor | Physical Gold and Silver | Futures and ETF Exposure |
|---|---|---|
| Counterparty risk | Minimal when self-custodied | Present in all paper forms |
| Price tracking | Direct | Generally close, but basis risk exists |
| Liquidity | Moderate | High |
| Storage cost | Required | No, but management fees apply |
| Delivery certainty | Guaranteed if held | Subject to contract terms and conditions |
| Manipulation exposure | Lower | Higher |
A critical observation from current market dynamics is that major financial institutions simultaneously publish bullish gold forecasts while their managed asset divisions hold virtually no physical gold on behalf of clients. The disconnect between stated analytical views and actual portfolio positioning suggests that retail and institutional investors navigating this environment independently may face a structural information asymmetry. Furthermore, the broader issue of gold and silver market manipulation and fiat currency collapse remains central to understanding why this disconnect persists.
Frequently Asked Questions: Gold, Silver, and Monetary System Risk
Has gold and silver market manipulation actually been proven?
Yes, in specific historical cases. Regulatory enforcement between 2008 and 2016 confirmed silver market manipulation through spoofing, resulting in approximately $1.27 billion in fines and criminal convictions. The CFTC has also investigated gold price-setting practices. However, claims of ongoing, systematic suppression as deliberate policy remain contested and have not been adjudicated.
Will fiat currencies collapse?
This is a forecast, not an established fact. While analysts point to mounting debt, declining purchasing power, and central bank gold accumulation as warning signals, mainstream economic institutions do not support the thesis of an imminent fiat collapse. The more defensible argument centres on gradual debasement, rising inflation risk, and long-term confidence erosion.
Why are COMEX open interest levels at multi-decade lows if gold and silver prices are high?
Multiple explanations exist. These include bullion bank risk aversion, widened bid-ask spreads deterring speculative participation, and a structural shift toward physical ownership over paper exposure. The divergence between high spot prices and low futures participation is analytically unusual and warrants careful monitoring.
Is silver a better investment than gold right now?
This depends on risk tolerance and time horizon. Silver carries greater price volatility, has significant industrial demand exposure, and currently trades at a historically wide ratio to gold — which some analysts interpret as undervaluation. However, silver’s smaller market size also makes it more susceptible to sharp price swings in both directions.
What does central bank gold buying actually signal?
At minimum, it signals portfolio diversification away from U.S. dollar-denominated assets. Whether it signals a deliberate exit from the fiat system or simply prudent reserve management is debated. The scale and consistency of central bank gold purchases since 2022 is, however, historically significant and documented by the World Gold Council.
Key Takeaways: Separating Confirmed Facts From Contested Forecasts
| Topic | What Is Confirmed | What Remains Speculative |
|---|---|---|
| Silver manipulation history | $1.27 billion in fines and criminal convictions | Ongoing suppression as deliberate policy |
| Gold price trajectory | Central bank demand is structurally supportive | Specific price targets |
| Fiat currency risk | Debasement and debt stress are measurable | Timeline and severity of any collapse |
| COMEX open interest | At multi-decade lows across both metals | Whether this signals imminent price dislocation |
| Physical vs. paper divergence | Metal flows suggest systematic underpricing | Whether a formal repricing event is imminent |
| Silver industrial demand | Growing structurally across solar, defence, and electronics | Exact demand-supply inflection timing |
This article is intended for educational and informational purposes only. It does not constitute financial advice. All references to price forecasts, scenario projections, and speculative analytical frameworks should be understood as opinion rather than prediction. Investors should conduct independent research and consult qualified financial advisers before making investment decisions.
Discovery Alert’s proprietary Discovery IQ model delivers real-time alerts on significant ASX mineral discoveries, instantly transforming complex geological and commodity data into actionable investment insights — giving subscribers a decisive edge in fast-moving markets. Explore how historic mineral discoveries have generated extraordinary returns on Discovery Alert’s dedicated discoveries page, and begin your 14-day free trial today to position yourself ahead of the broader market.


Leave a comment