

Buyers supported the lower-$58 price zone, boosting silver off its previous intraday low to settle just under $59.16.
The rebound has lifted immediate downside pressure, but the charts are not yet giving a clear indication of a complete trend reversal.
Price continues to be held back by a number of wider resistance levels, while momentum in its short-term timeframes is starting to fade after the bounce from Wednesday’s decline.
Silver Recovers From $58.60 Intraday Low
Silver was up 0.70% to about $59.16 an ounce in trading from Trading Economics market data. The price started around $59.20 and fluctuated throughout the day, hitting a high of nearly $59.55 on the charts.

As indicated in the chart, later, selling worked to the disadvantage of the metal, pushing it closer to $58.60. Buyers rallied back to near those levels, with back-to-back strong late rallies that lifted silver above $59.
This reaction forms a support zone near $58.55 to $58.65. A long break below could uncover the $58 area, followed by a broader technical area around $56.50.
Early buying pressure has weakened at $59.40 to $59.60, around which the entire transaction went sideways. The immediate buying pressure is around $59.40 to $59.60, where the entire transaction goes sideways. Silver would have to pass through that before retesting the psychological $60 mark.
Technical Indicators Show Mixed Momentum
Silver has stabilized on the 30-minute chart following a downward trend from above $65 during the week. The price bounced off the June 25 low, moved up to the upper $59 level, and stayed range-bound around $59.13.

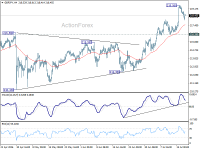
TradingView data shows that Chaikin Money Flow was 0.19. Over the time period covered by the indicator, the flow of capital was in favor of the buyers.
But the MACD did not provide as unambiguous a signal. The MACD line remained close to 0.02, with the histogram line remaining around 0.03, slightly below the signal line.
That suggests that the bullish momentum is weakening, though sellers still haven’t gained significant control. If the MACD crosses over the signal line again, then another push towards $60 is favored.
Elliott Wave Chart Leaves Another Low Possible
Notably, the Elliott Wave chart posted on X shows that silver is engulfed in a larger corrective pattern. Price has bounced off from the 78.6% retracement level around $58.46, which is now a significant support level. A possible recovery zone near $63.71, $66.47, and $69.34 is also marked on the chart.

However, the same set-up allows for a further pullback to $50.98 in the event the bounce proves to be unsuccessful and the larger corrective wave re-initiates.
For now, the focus of the area is between $58.46 and $60. A bounce-off from above would keep the rebound going, and a break below would bring a return to the lower targets and hamper the recovery further.
Even so, Silver has stabilized for now, though it lacks confirmation. If the price breaks down from the $58.50 level, the sellers would regain control, and the buyers would have to recoup $59.60 and then $60.


Leave a comment