
Why this matters: When real estate agents check out readily available market data, their ability to advise clients improves. Today’s increased deepening of uncertainty about all factors driving California property values is best tackled by continuously reviewing information for insight into the non-stop change in human behavior affecting real estate transactions.
The cyclical rise in mortgage rates bent by wars
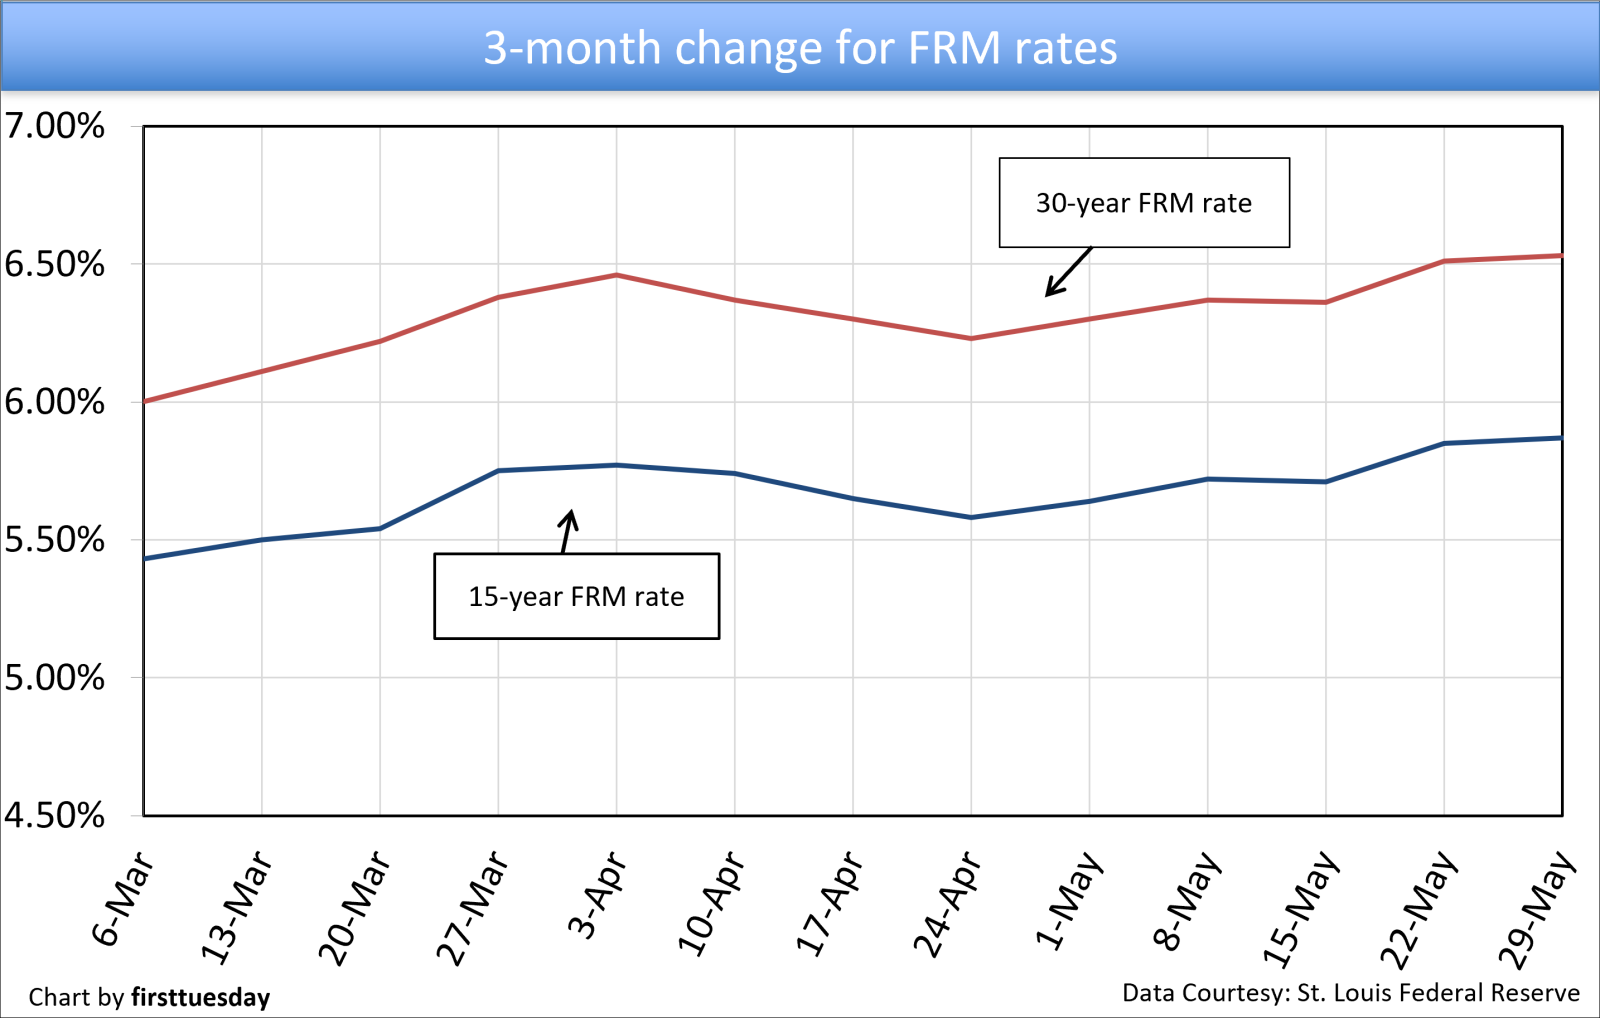
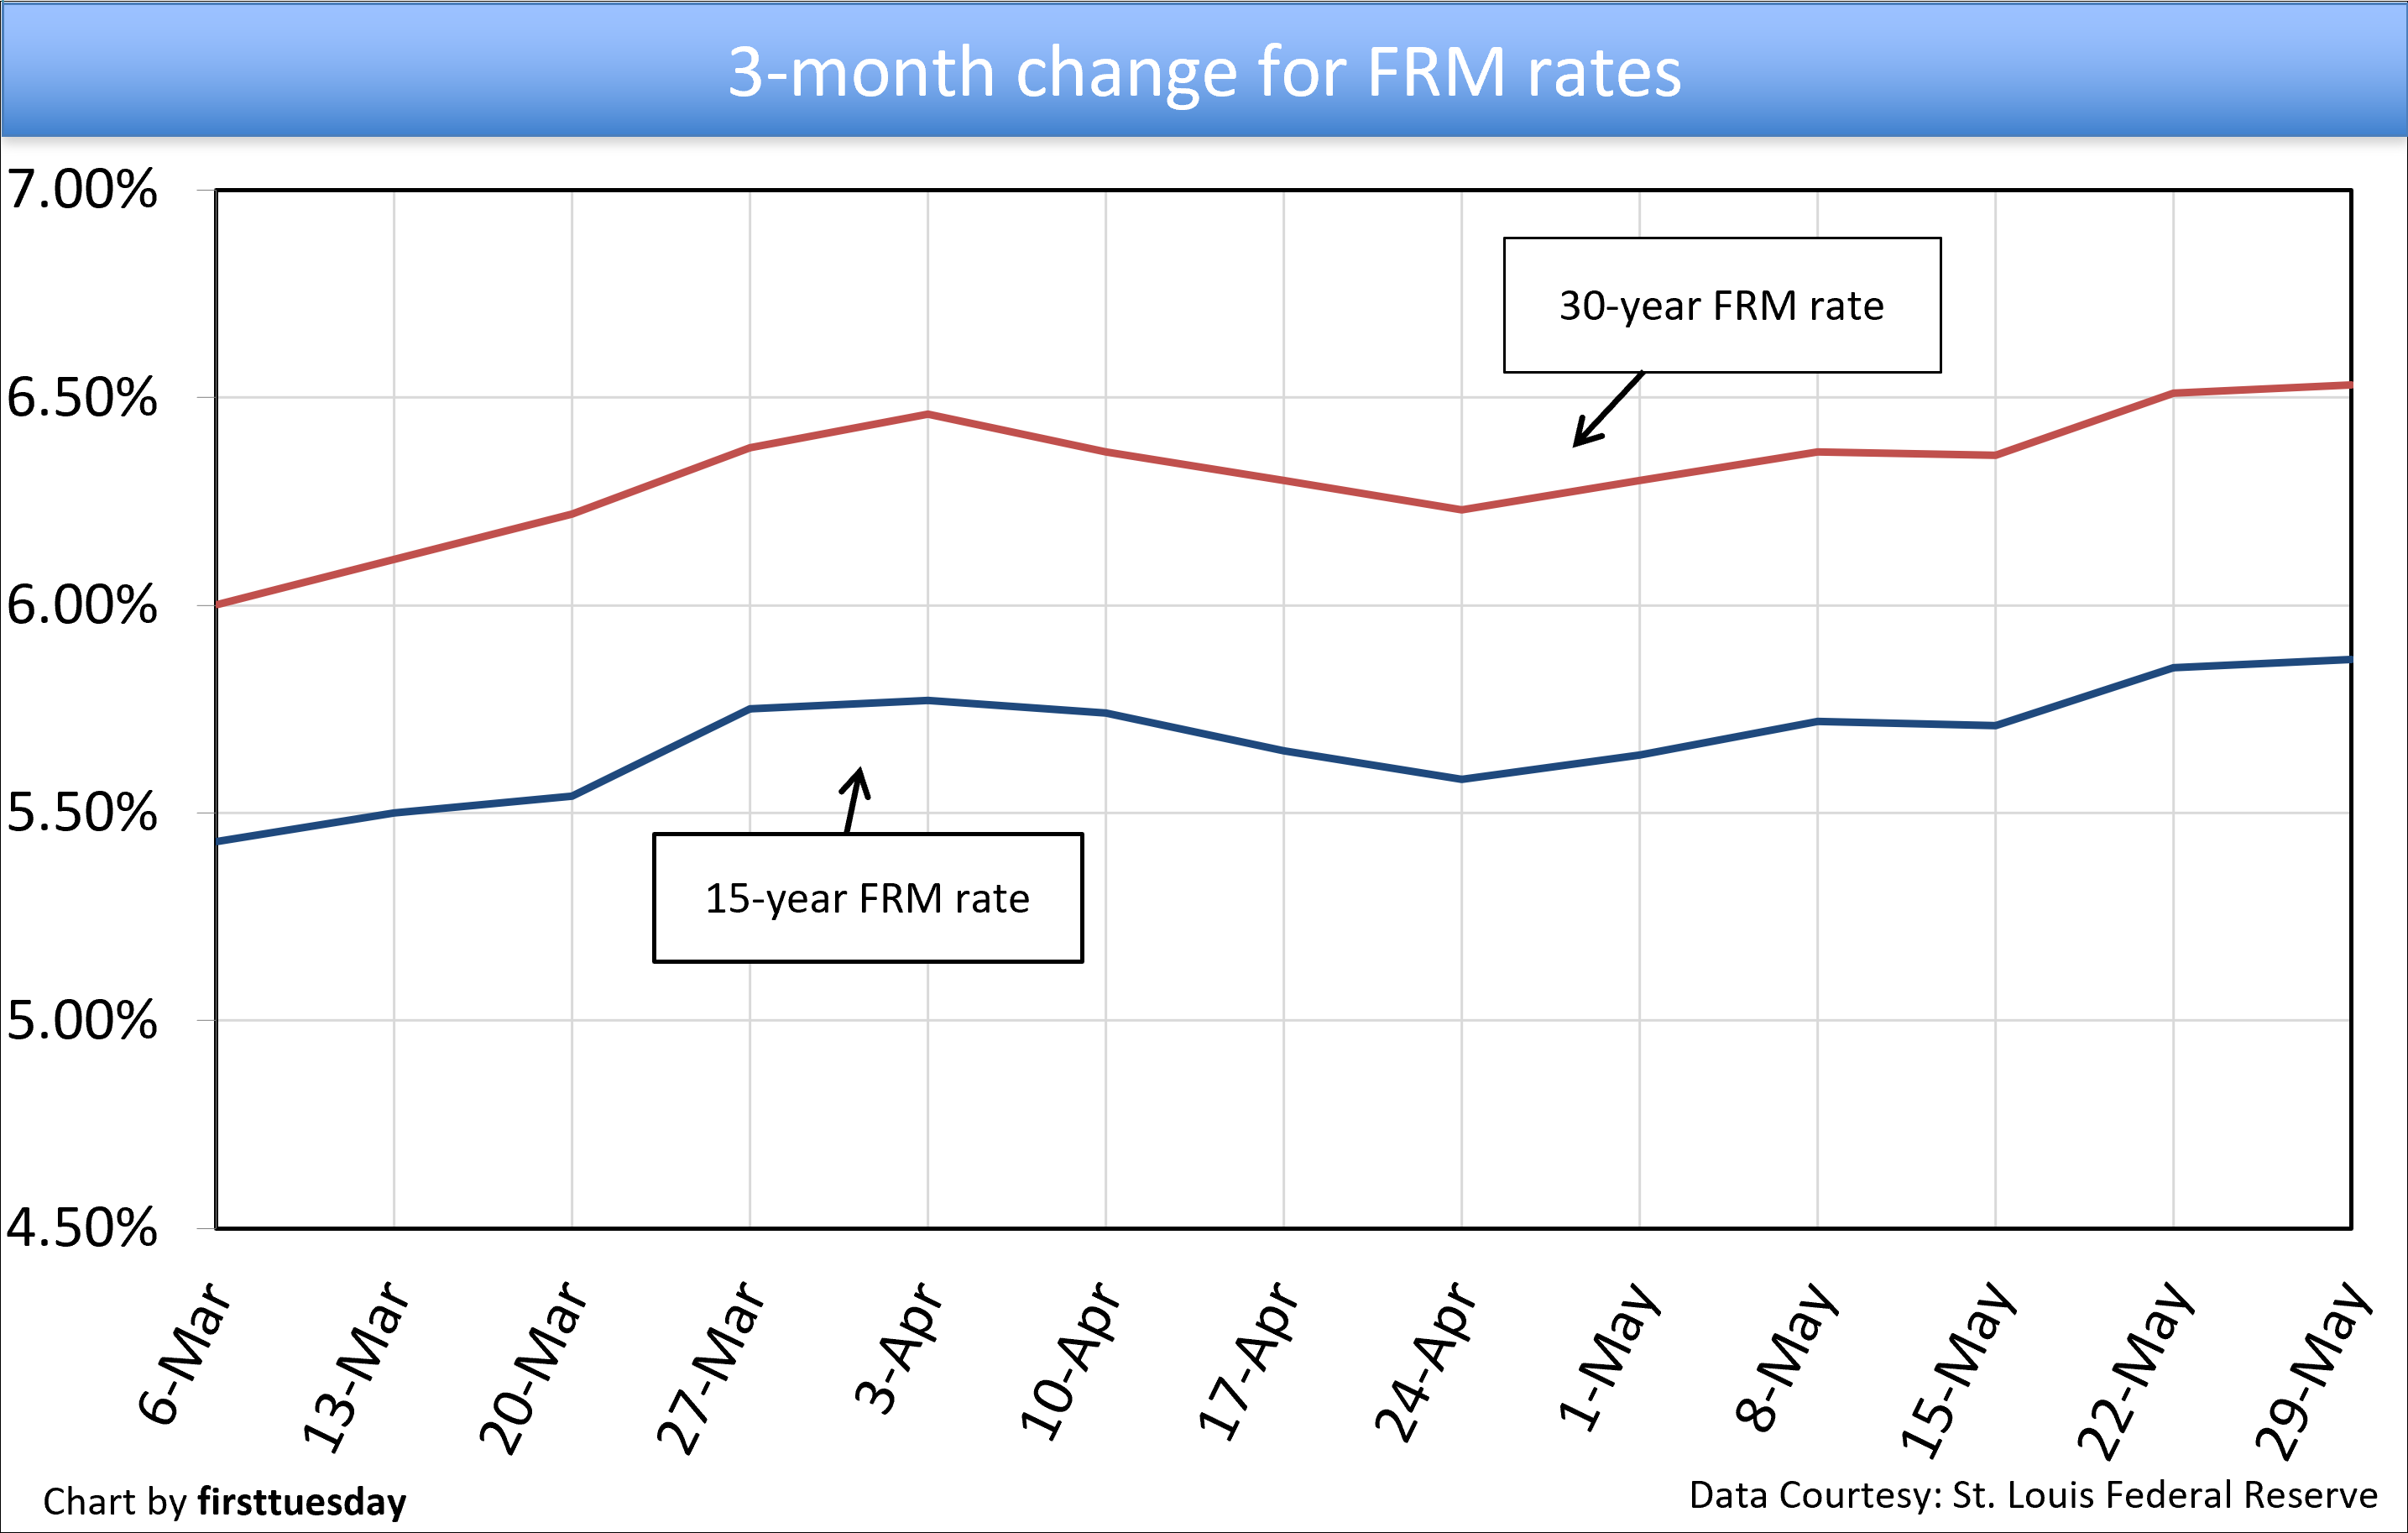
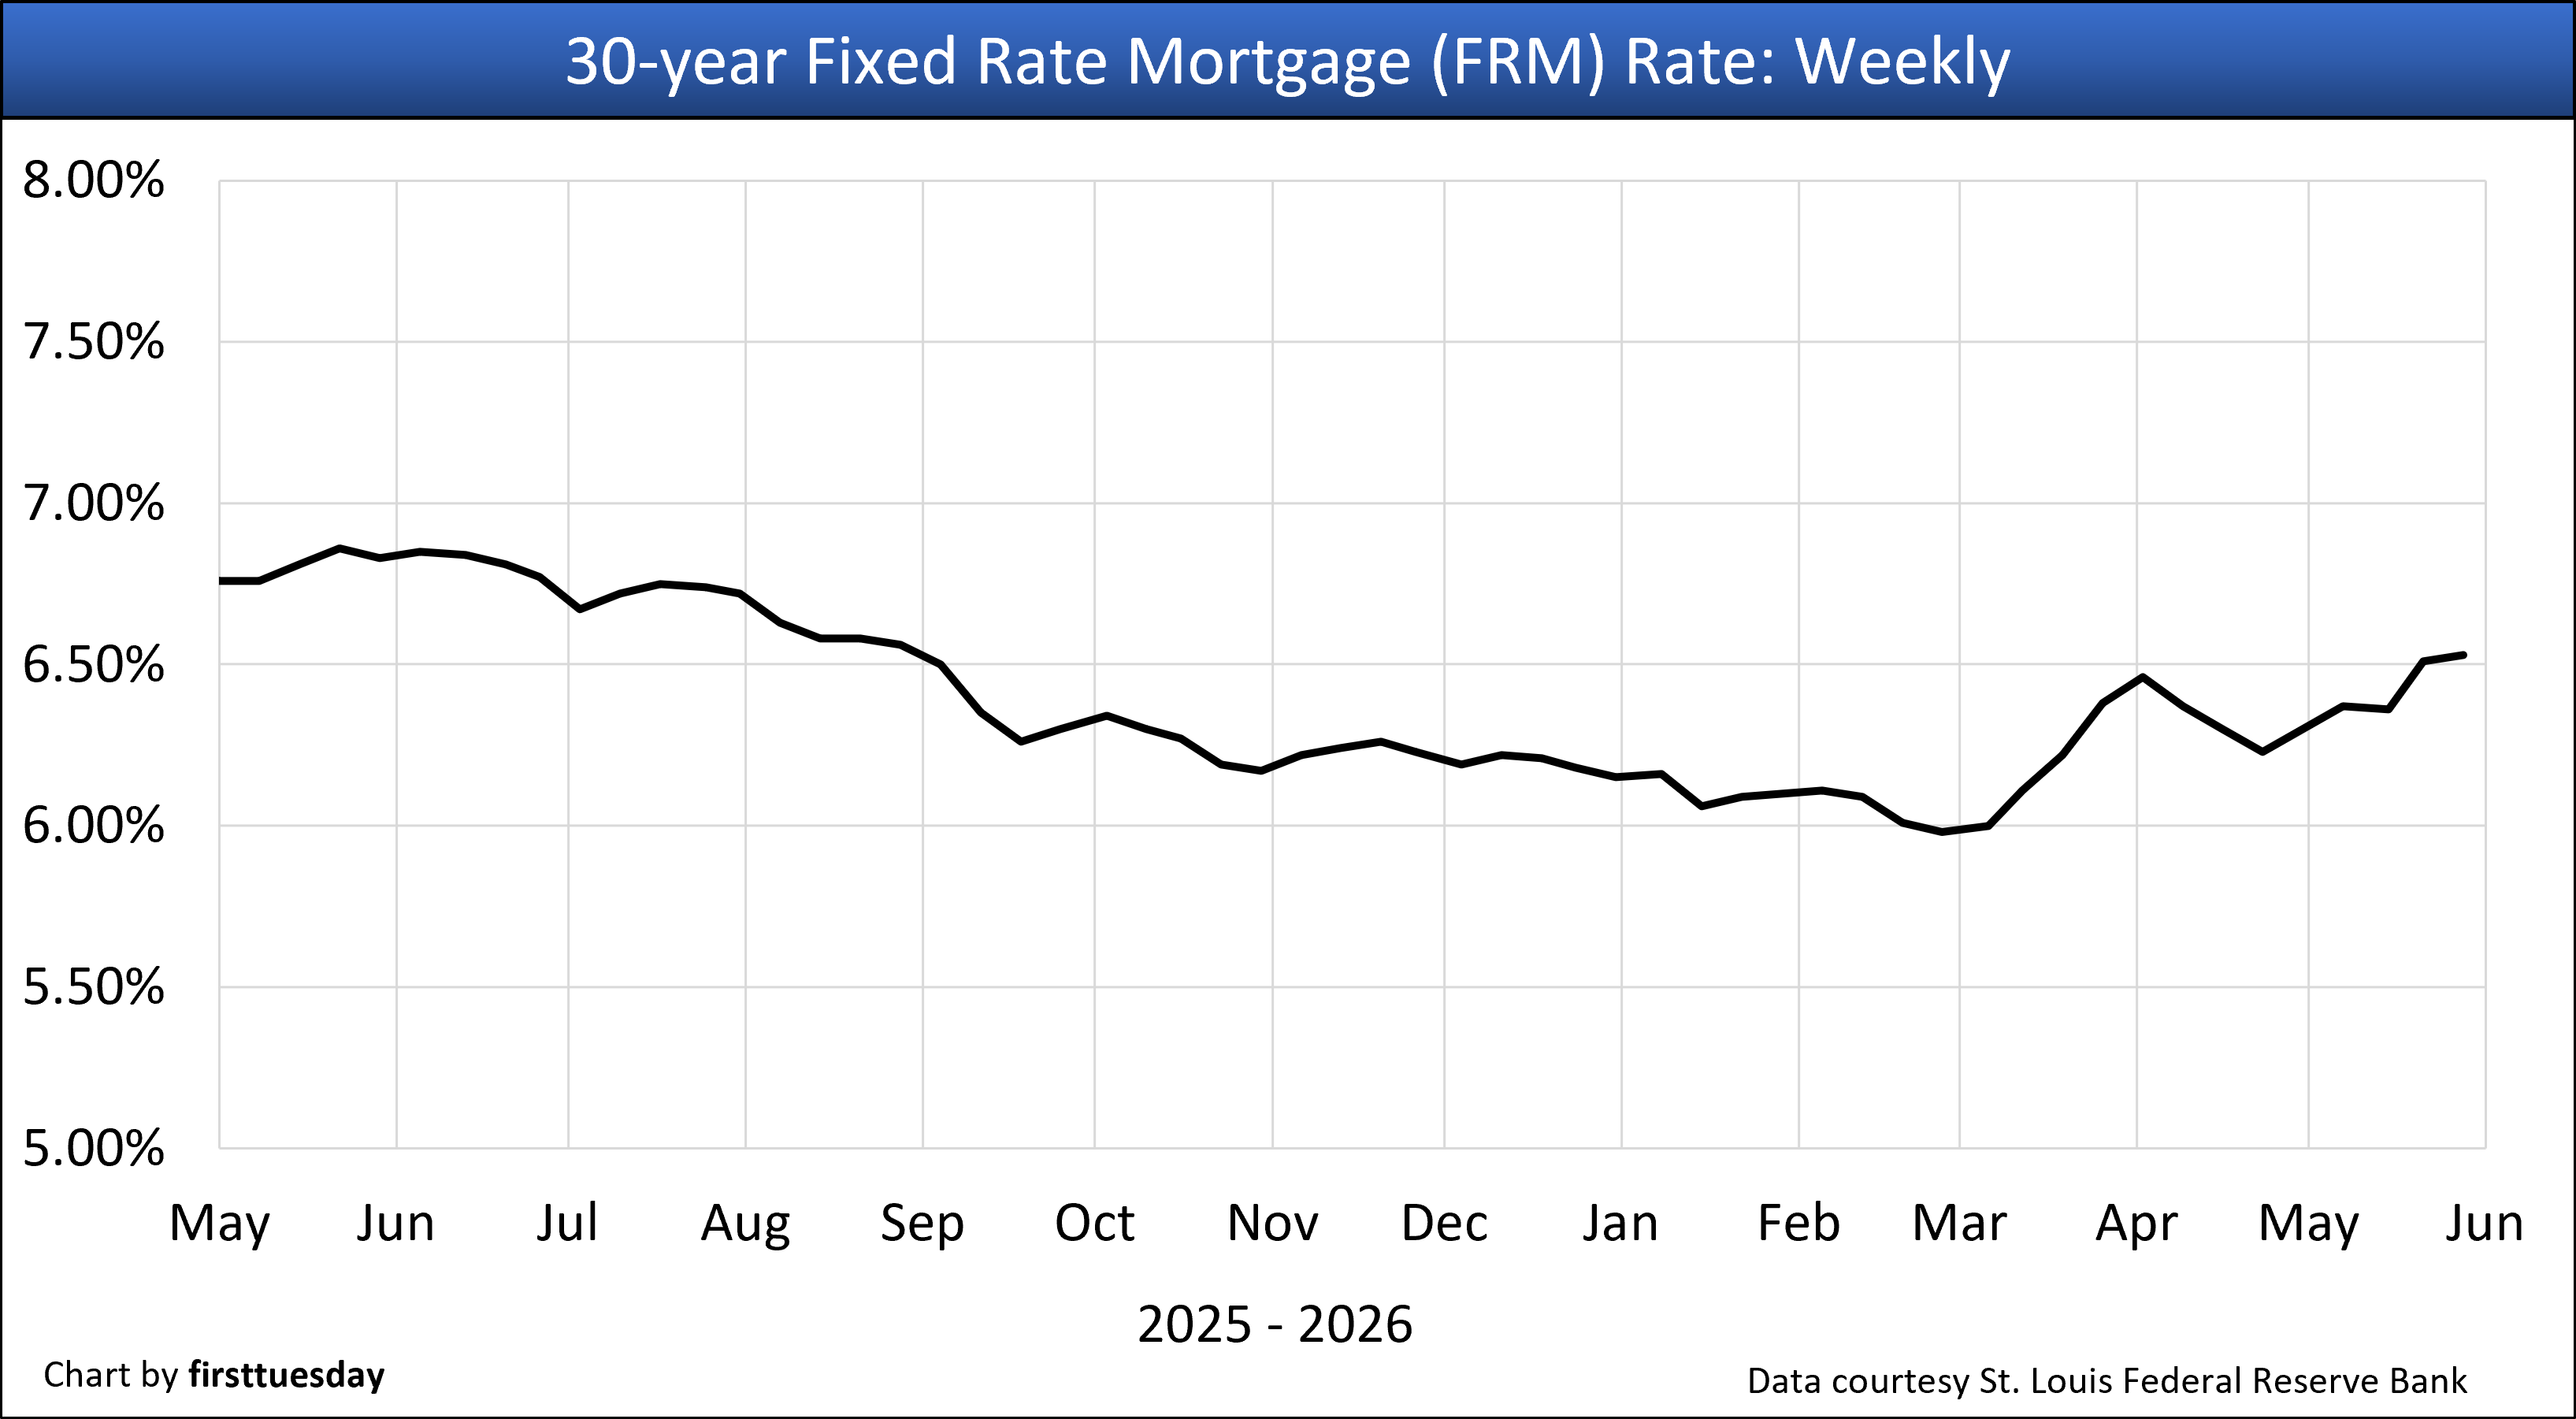
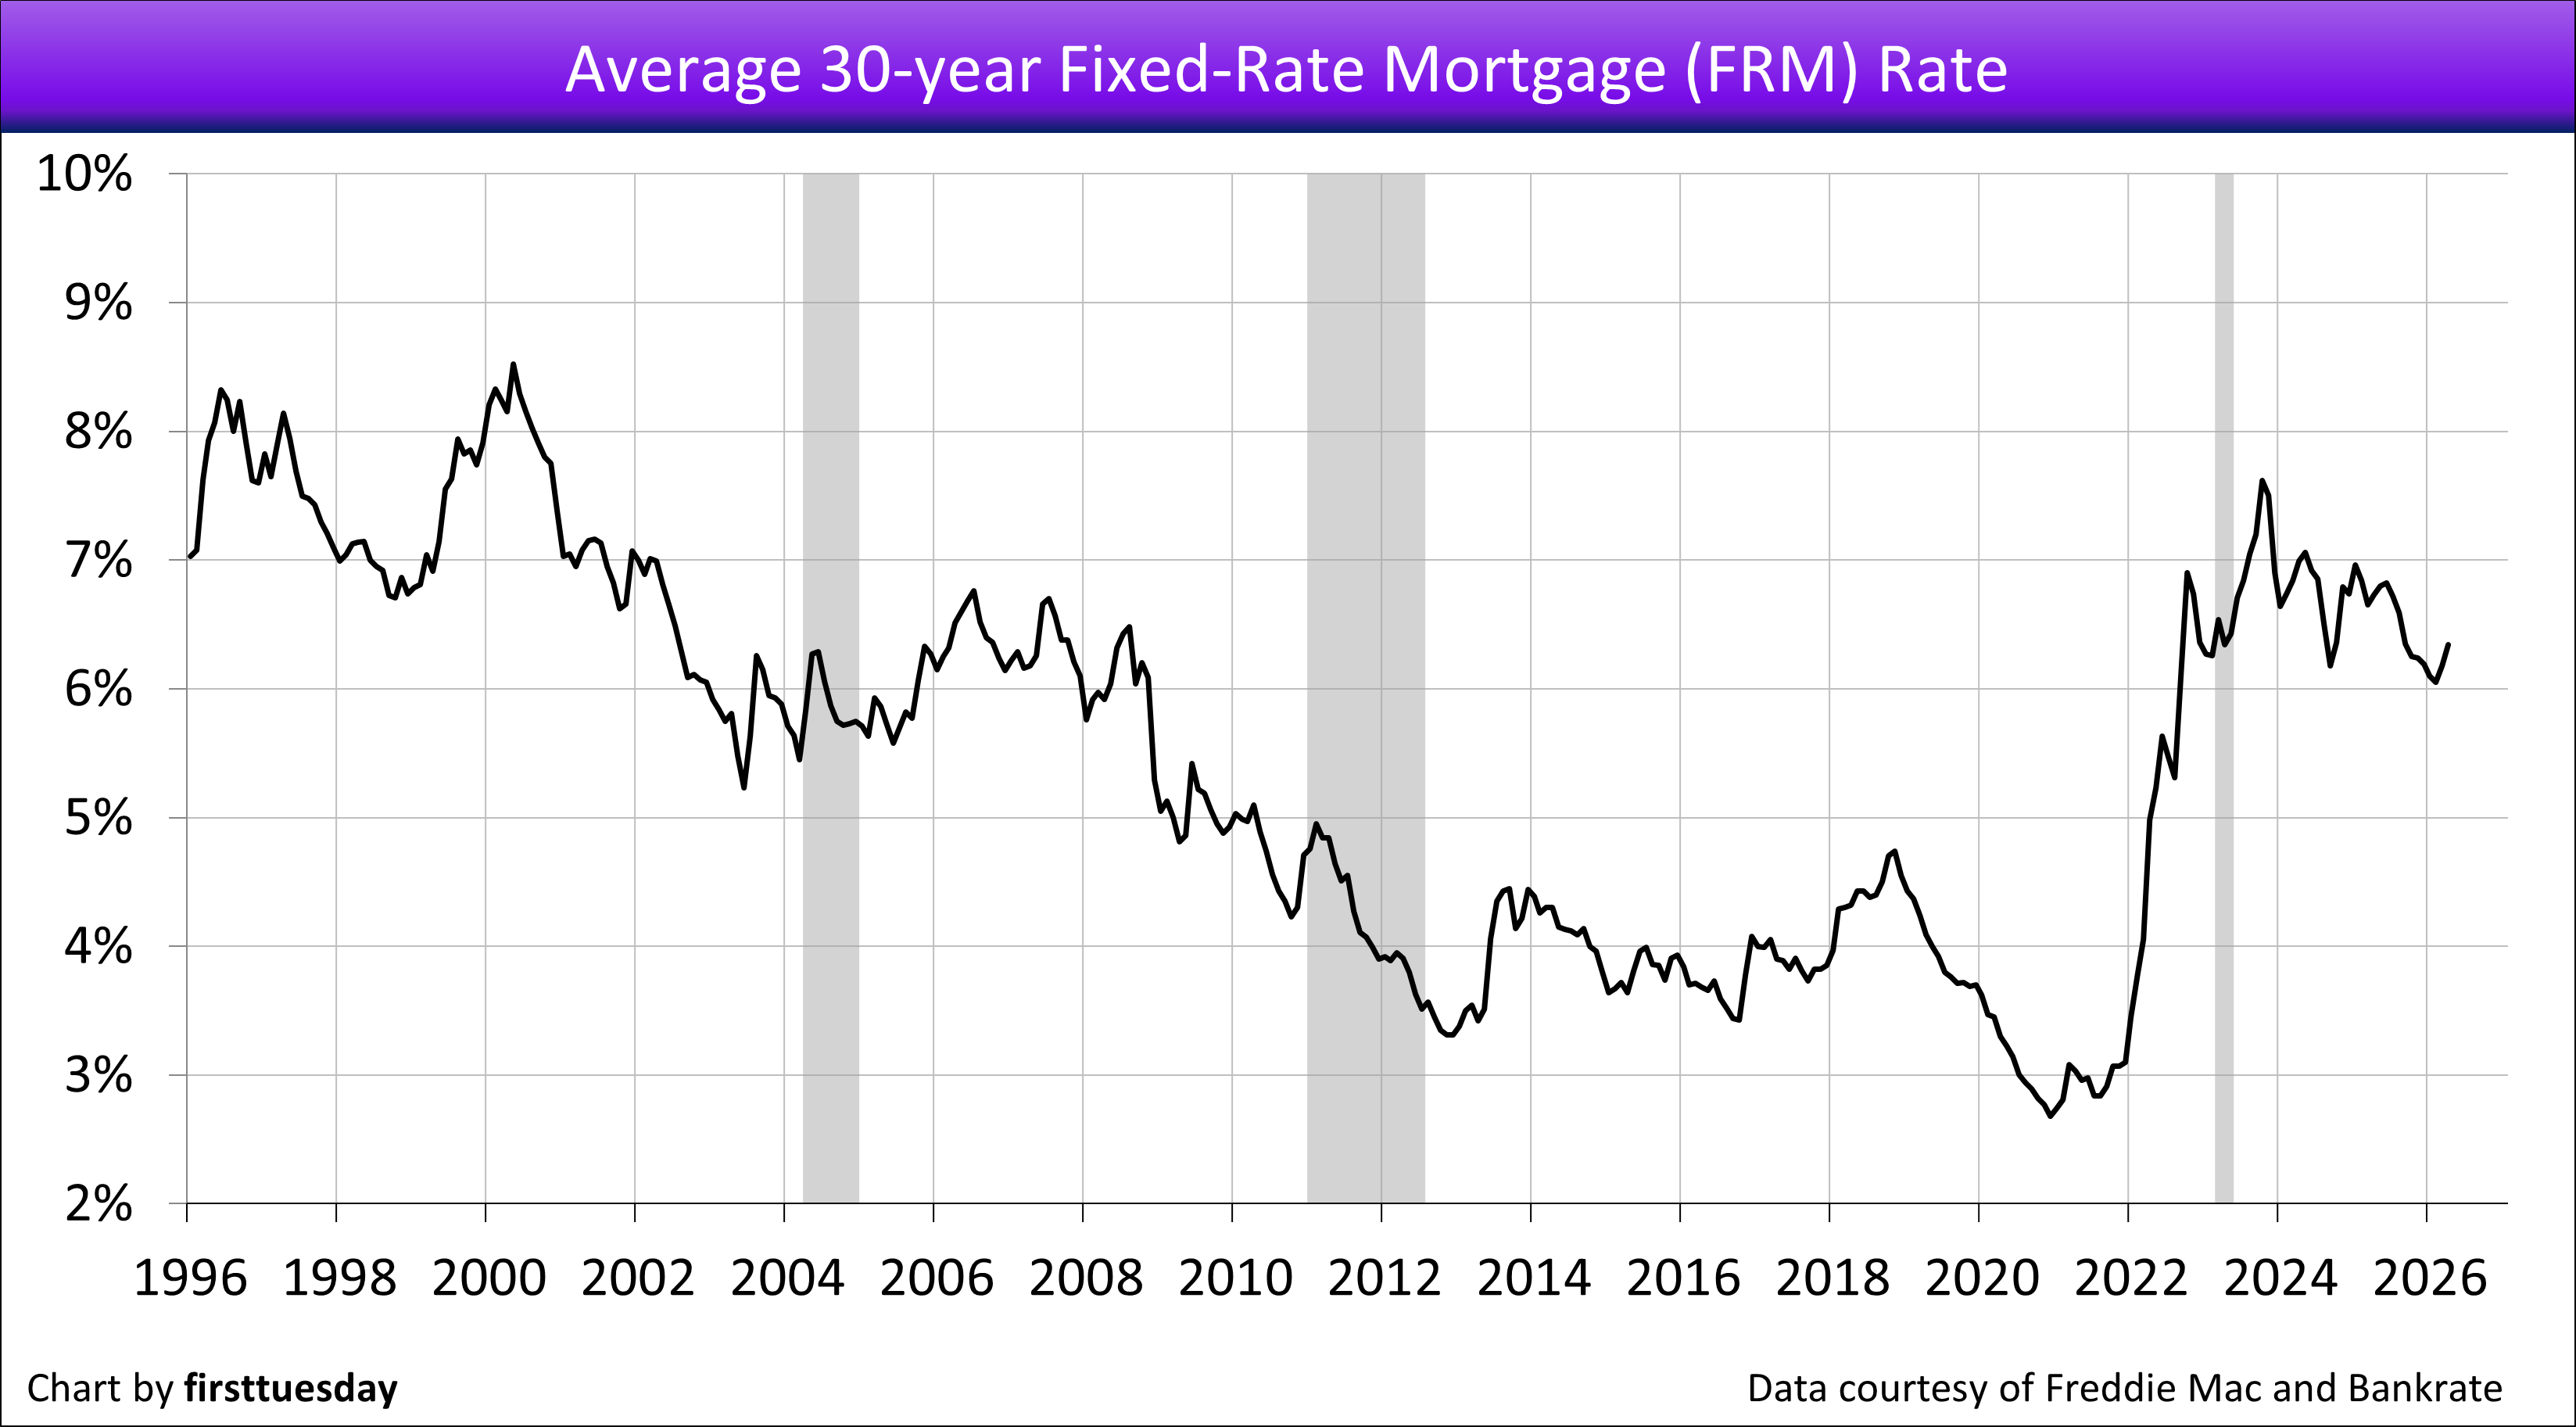
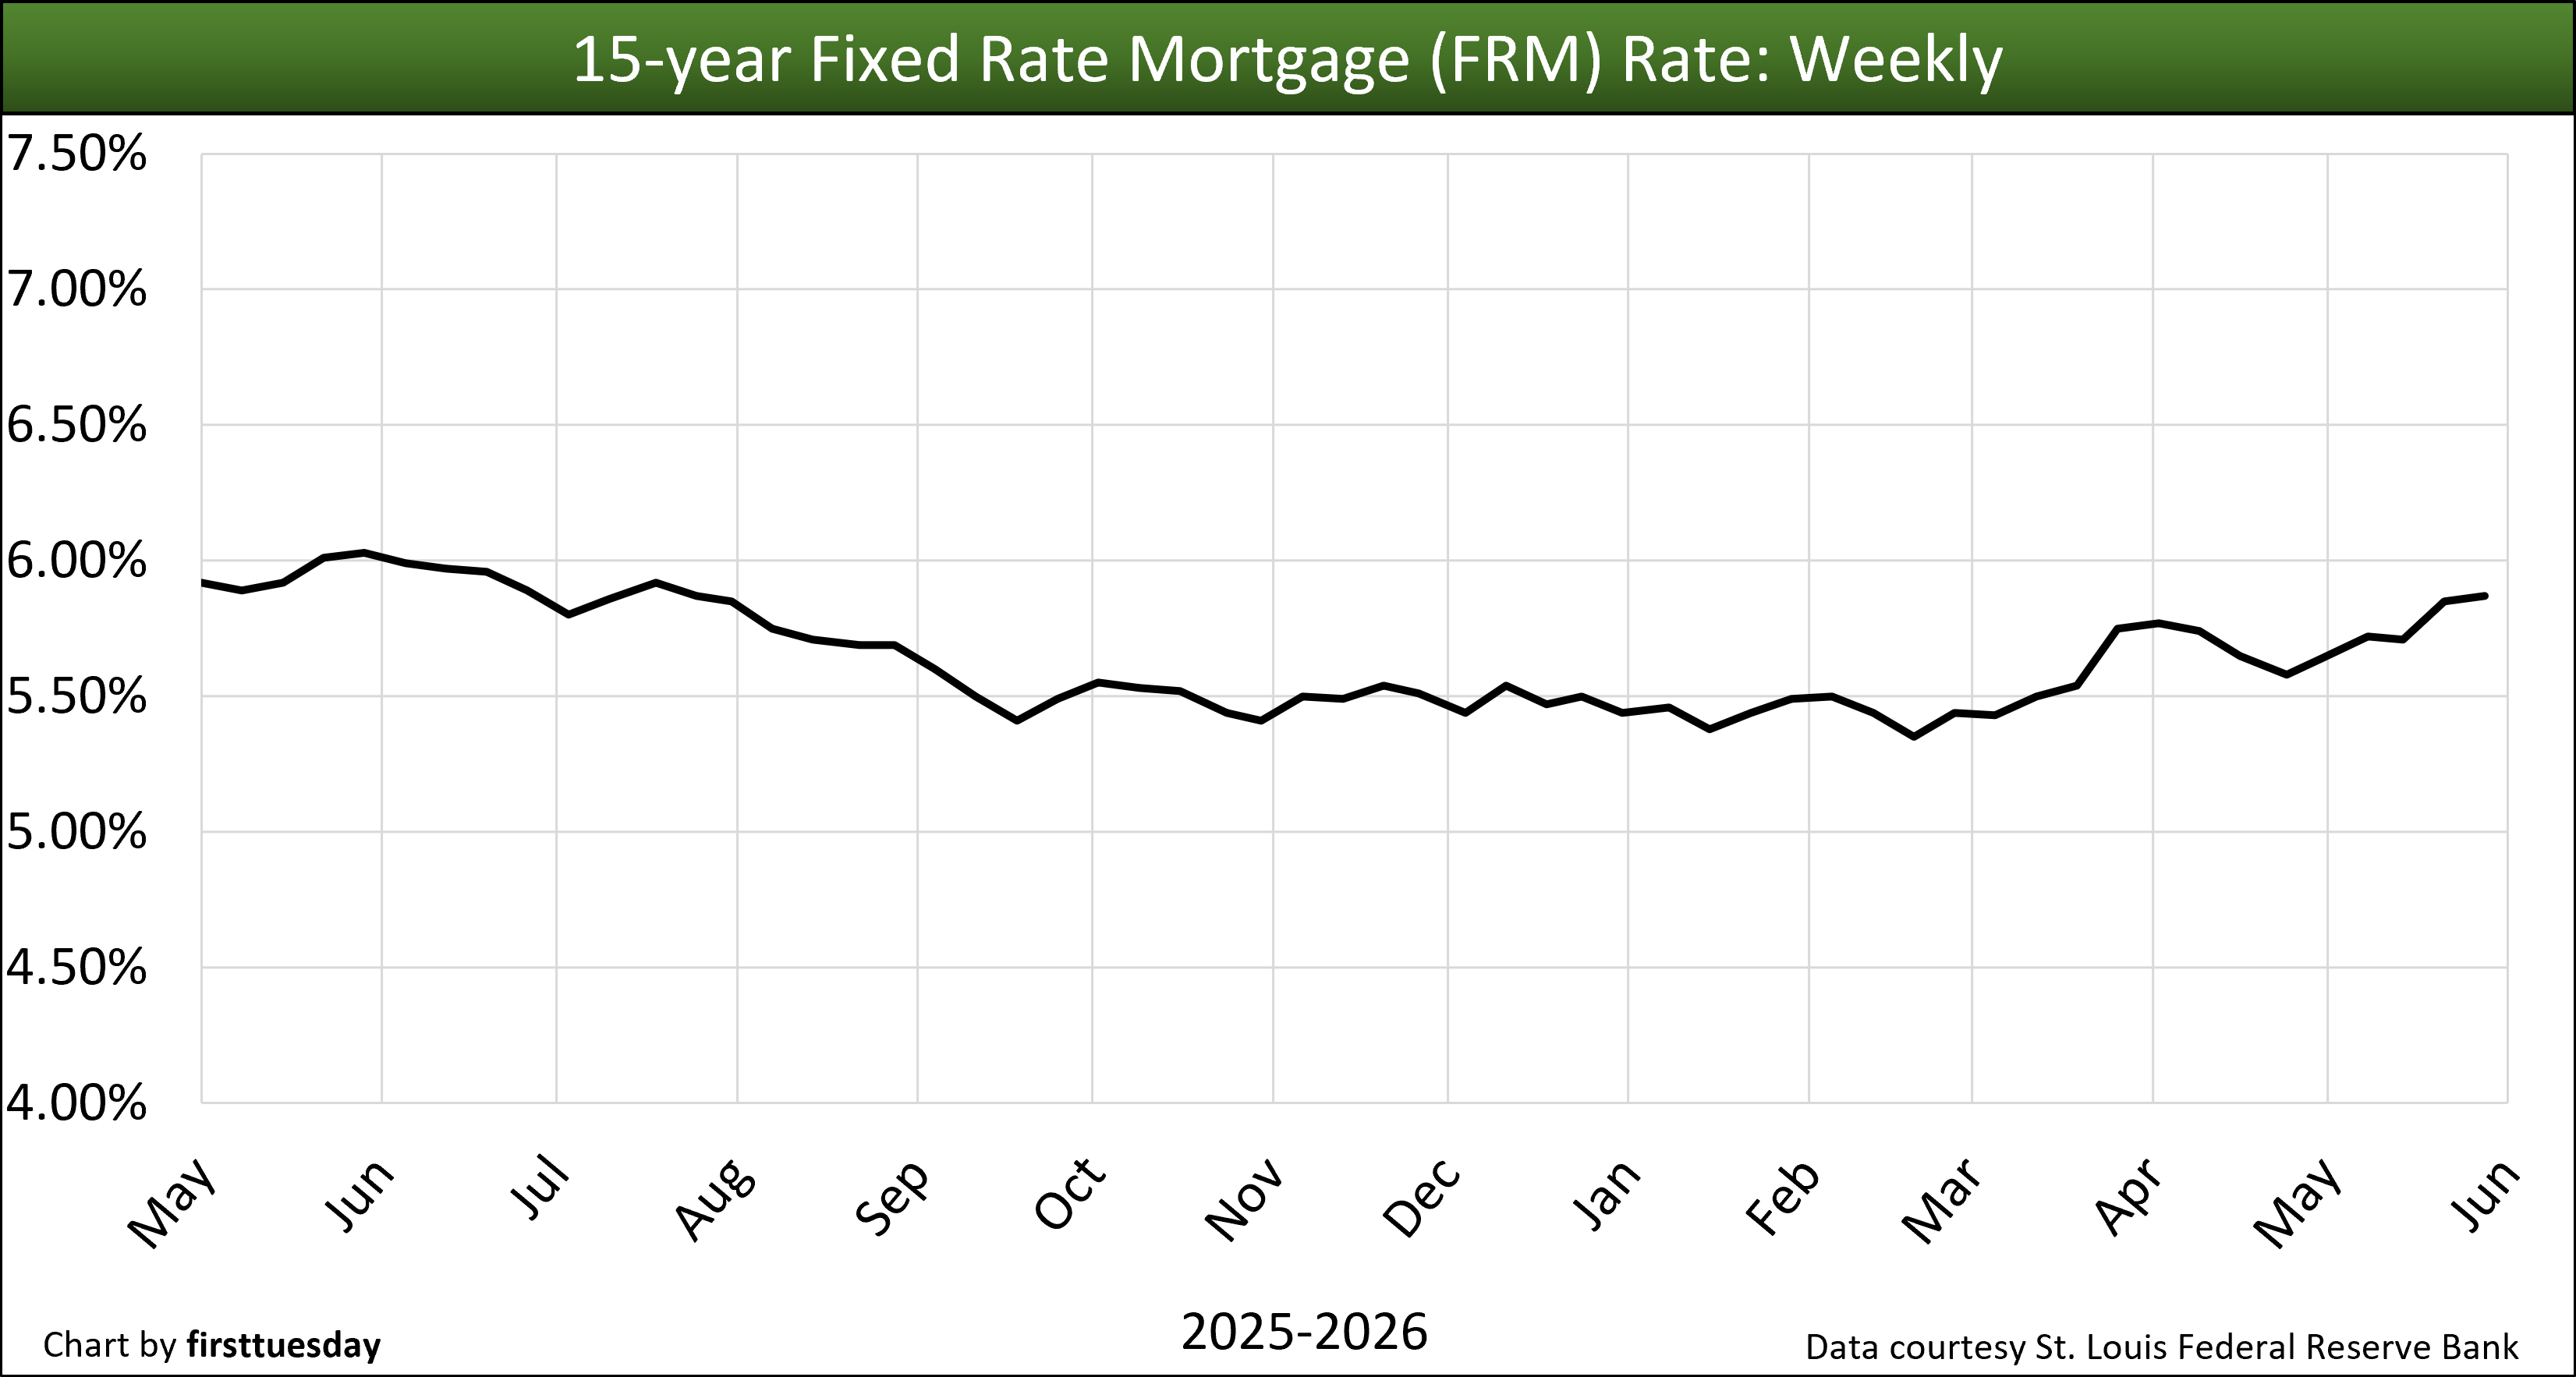
The rate on an average 30-year fixed rate mortgage (FRM) inched up to 6.53% in the week ending May 29, 2026. The average 15-year FRM rose to 5.87%. For those able to switch, the lower 15-year FRM delivers a huge increase in wealth due to the significant decrease in the amount of interest paid over the life of a 15-year mortgage.
In addition to the annual interest rate being one-tenth less expensive than the 30-year FRM, the 15-year FRM also pays off the principal more quickly through amortization as monthly payments are larger. Originating a 15-year FRM, rather than a 30-year FRM, saves around 60% on the total interest paid on a 30-year FRM with a principal amount of $500,000. Meaning a 30-year mortgage requires payments of more than double the interest, an avoidable expense that drastically reduces the homeowner’s standard of living after 15 years.
The war in the Middle East initiated February 28, 2026, instantly and adversely altered the California real estate economy. For 2026, you may well see FRM rates work their way higher then lower, or, lower then higher. The bond market bet is the Fed will put up a marginal fight to cut the current severe 6% to 8% annualized forward rate of consumer inflation underway today. Tariff wars in 2025 and now miliary wars in 2026 destabilized job growth and increased consumer inflation which will not end quickly.
The Fed task for setting short-term interest rates is today disrupted by the fast-rippling effects on all products made from oil — plastics for construction and consumer stuff, fertilizer for grocery products, fuel for transportation. And, meanwhile, the effects remain from the covid pandemic and current government-administrated interference with necessary trade and migratory labor. The environment of existing wars drives hording precious metals — or cash positions — but not the acquisition of real estate interests. Not yet, but certain to come.
Until rapid upward consumer inflation decelerates to the 2% range, increased short-term interest rates — or a reduction in jobs, or both — will reduce consumer spending and household debt. As always, future pricing of consumer goods will rise but at an accommodating slower rate. Meanwhile asset prices (read: real estate, bonds, etc.) decline and wages for the employed increase to match recent consumer inflation, the COLA effect.
However, it is the dramatic increase in long-term rates for mortgages, which have not yet peaked, that has brought mortgage-funded real estate transactions to a serious slowdown until the interferences recede. The 2026 annual cycle for the spring bounce in sales volume and pricing was going nowhere before the Iran War. The conflict put an end to typical deal making for buyers dependent on mortgage funding — until the war ends and time passes for a perceptible calm to set in.
Regardless of FRM rate movement in the continuing real estate recessionary period remaining in 2026, expect a long-term upward trend in mortgage rates to follow. The trend commenced in 2013 with the onset of a half-cycle of rising rates on all borrowing and is likely to run for around two more decades.
That said, current government interference with the economy is spilling over into real estate by adversely affecting homebuyer willingness, user turnover rate, and costs of residential construction. Thus, a rigor mortis environment has settled in for real estate.
An increase in federal tax revenues — or Federal Reserve bond buying — will soon be needed to offset an insatiable government demand for cash, unless the people who pay income taxes pay more. The result: expect long-term interest rates to remain high, and in sympathy, mortgage rates.
Two further situations will cause mortgage rates to stay high and tend to rise. Privatizing quasi-government mortgage agencies, like Freddie Mac, will enhance mortgage lender profit-sharing as reduced oversight increases mortgage lender risk of loss but provides greater short-term profits. The tandem follow on is that the resulting mortgage lender losses are socialized by government mortgage guarantees and not borne by the lenders.
Remember the rule: All financial deregulation goes up in flames. Our last reminder was 2005 which did not go well, but we forget.
Buyers increasingly stay away, until when?
In the longer term, today’s property prices are undermined by high FRM rates and buyer caution. Likewise, all income property values decline as capitalization rates do rise in sympathy with long-term interest rates, a yield-spread cost borne as wealth lost by current owners of real estate, not mathematically inclined buyers. High FRM rates and cap rates reflect the pattern of rising long-term interest rates that took root in 2013.
In application, property pricing is primarily supported by the amount a buyer can borrow to fund a purchase. Higher and higher mortgage rates translate into reduced ability to pay yesterday’s prices.
The annual increases in FRM rates experienced since 2013 force sellers to eventually drop prices or exit the for-sale market when for-sale and for-lease inventories rise. An exception is the annual spring bounce in sales volume, which weakened each year since 2021.
As for homebuyers dependent on purchase-money mortgage funding, and particularly first-time buyers under the age of 35, they either:
- reduce their standard of living and acquire property priced in a lower tier, a less likely choice going forward; or
- wait out dropping or static property prices until pricing matches their reduced buyer purchasing power brought on by high mortgage rates, a match now well on its way since property pricing peaked in mid-2022 and remains flat.
Buyers dependent on mortgage funding increasingly sense property acquisition today is incompatible with the double whammy of purchasing an over-priced property with mortgage funding at high FRM rates. Rational potential buyers increasingly remain on the sidelines — ready and able, but less willing to borrow and buy.
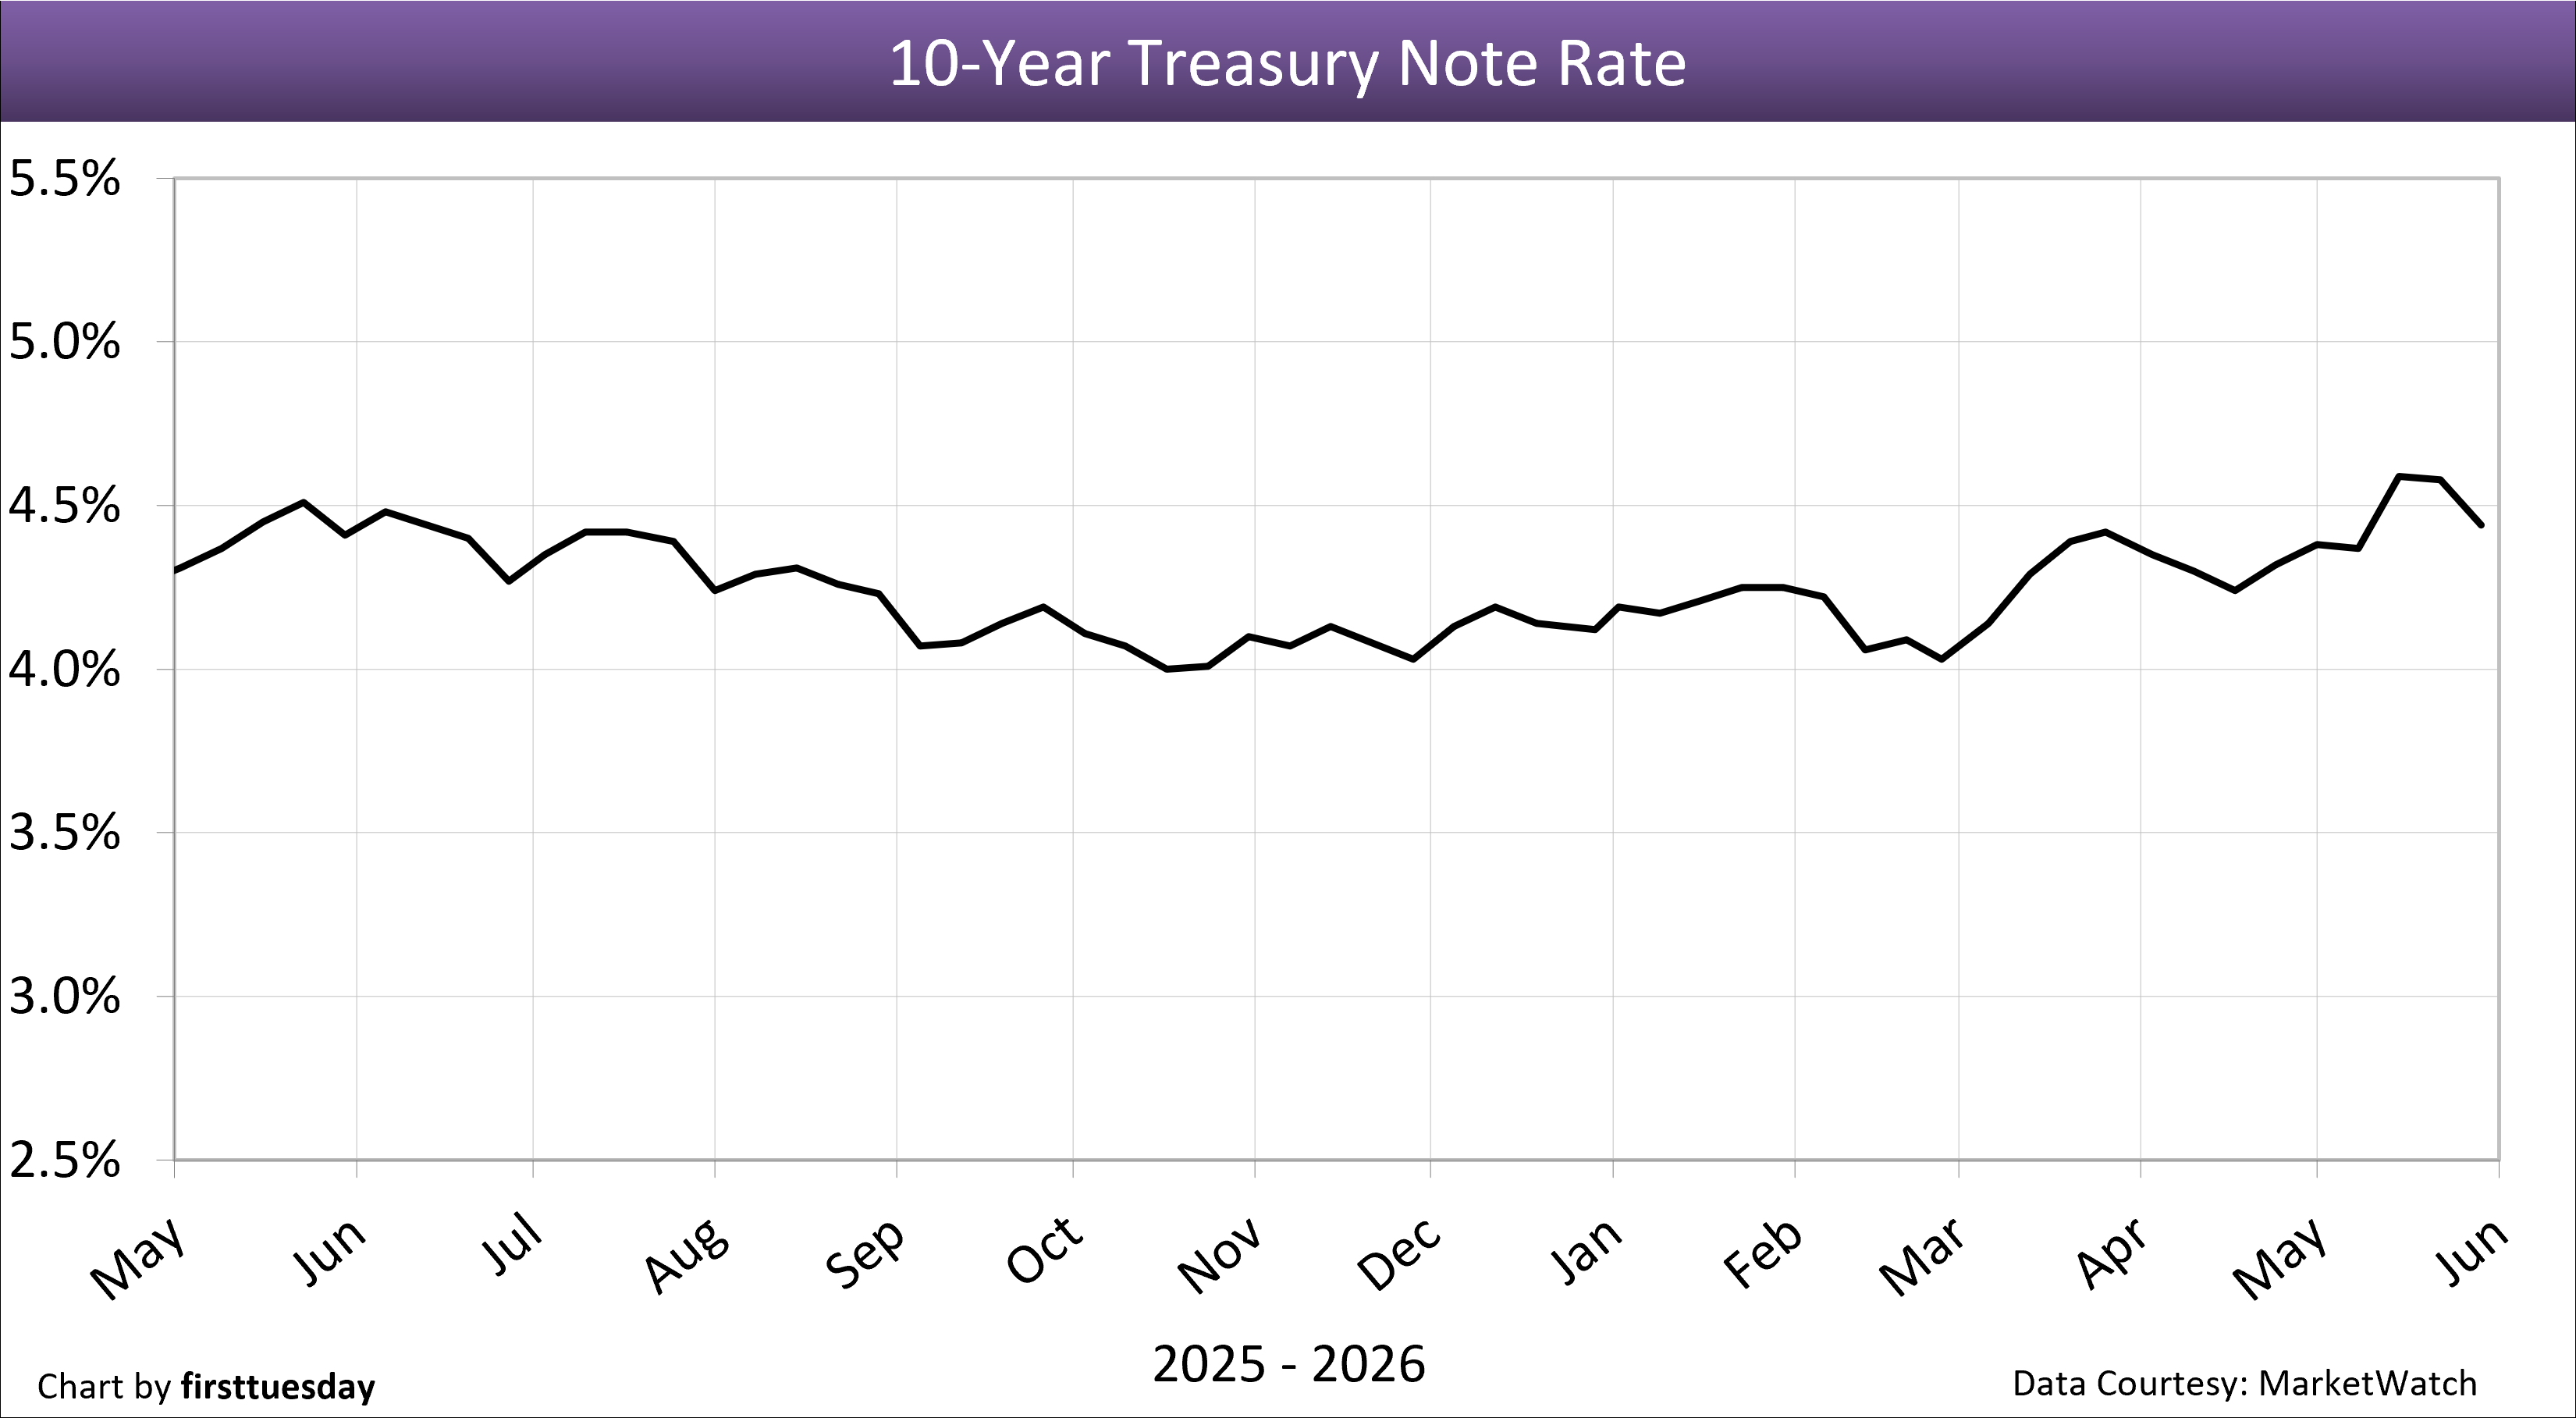
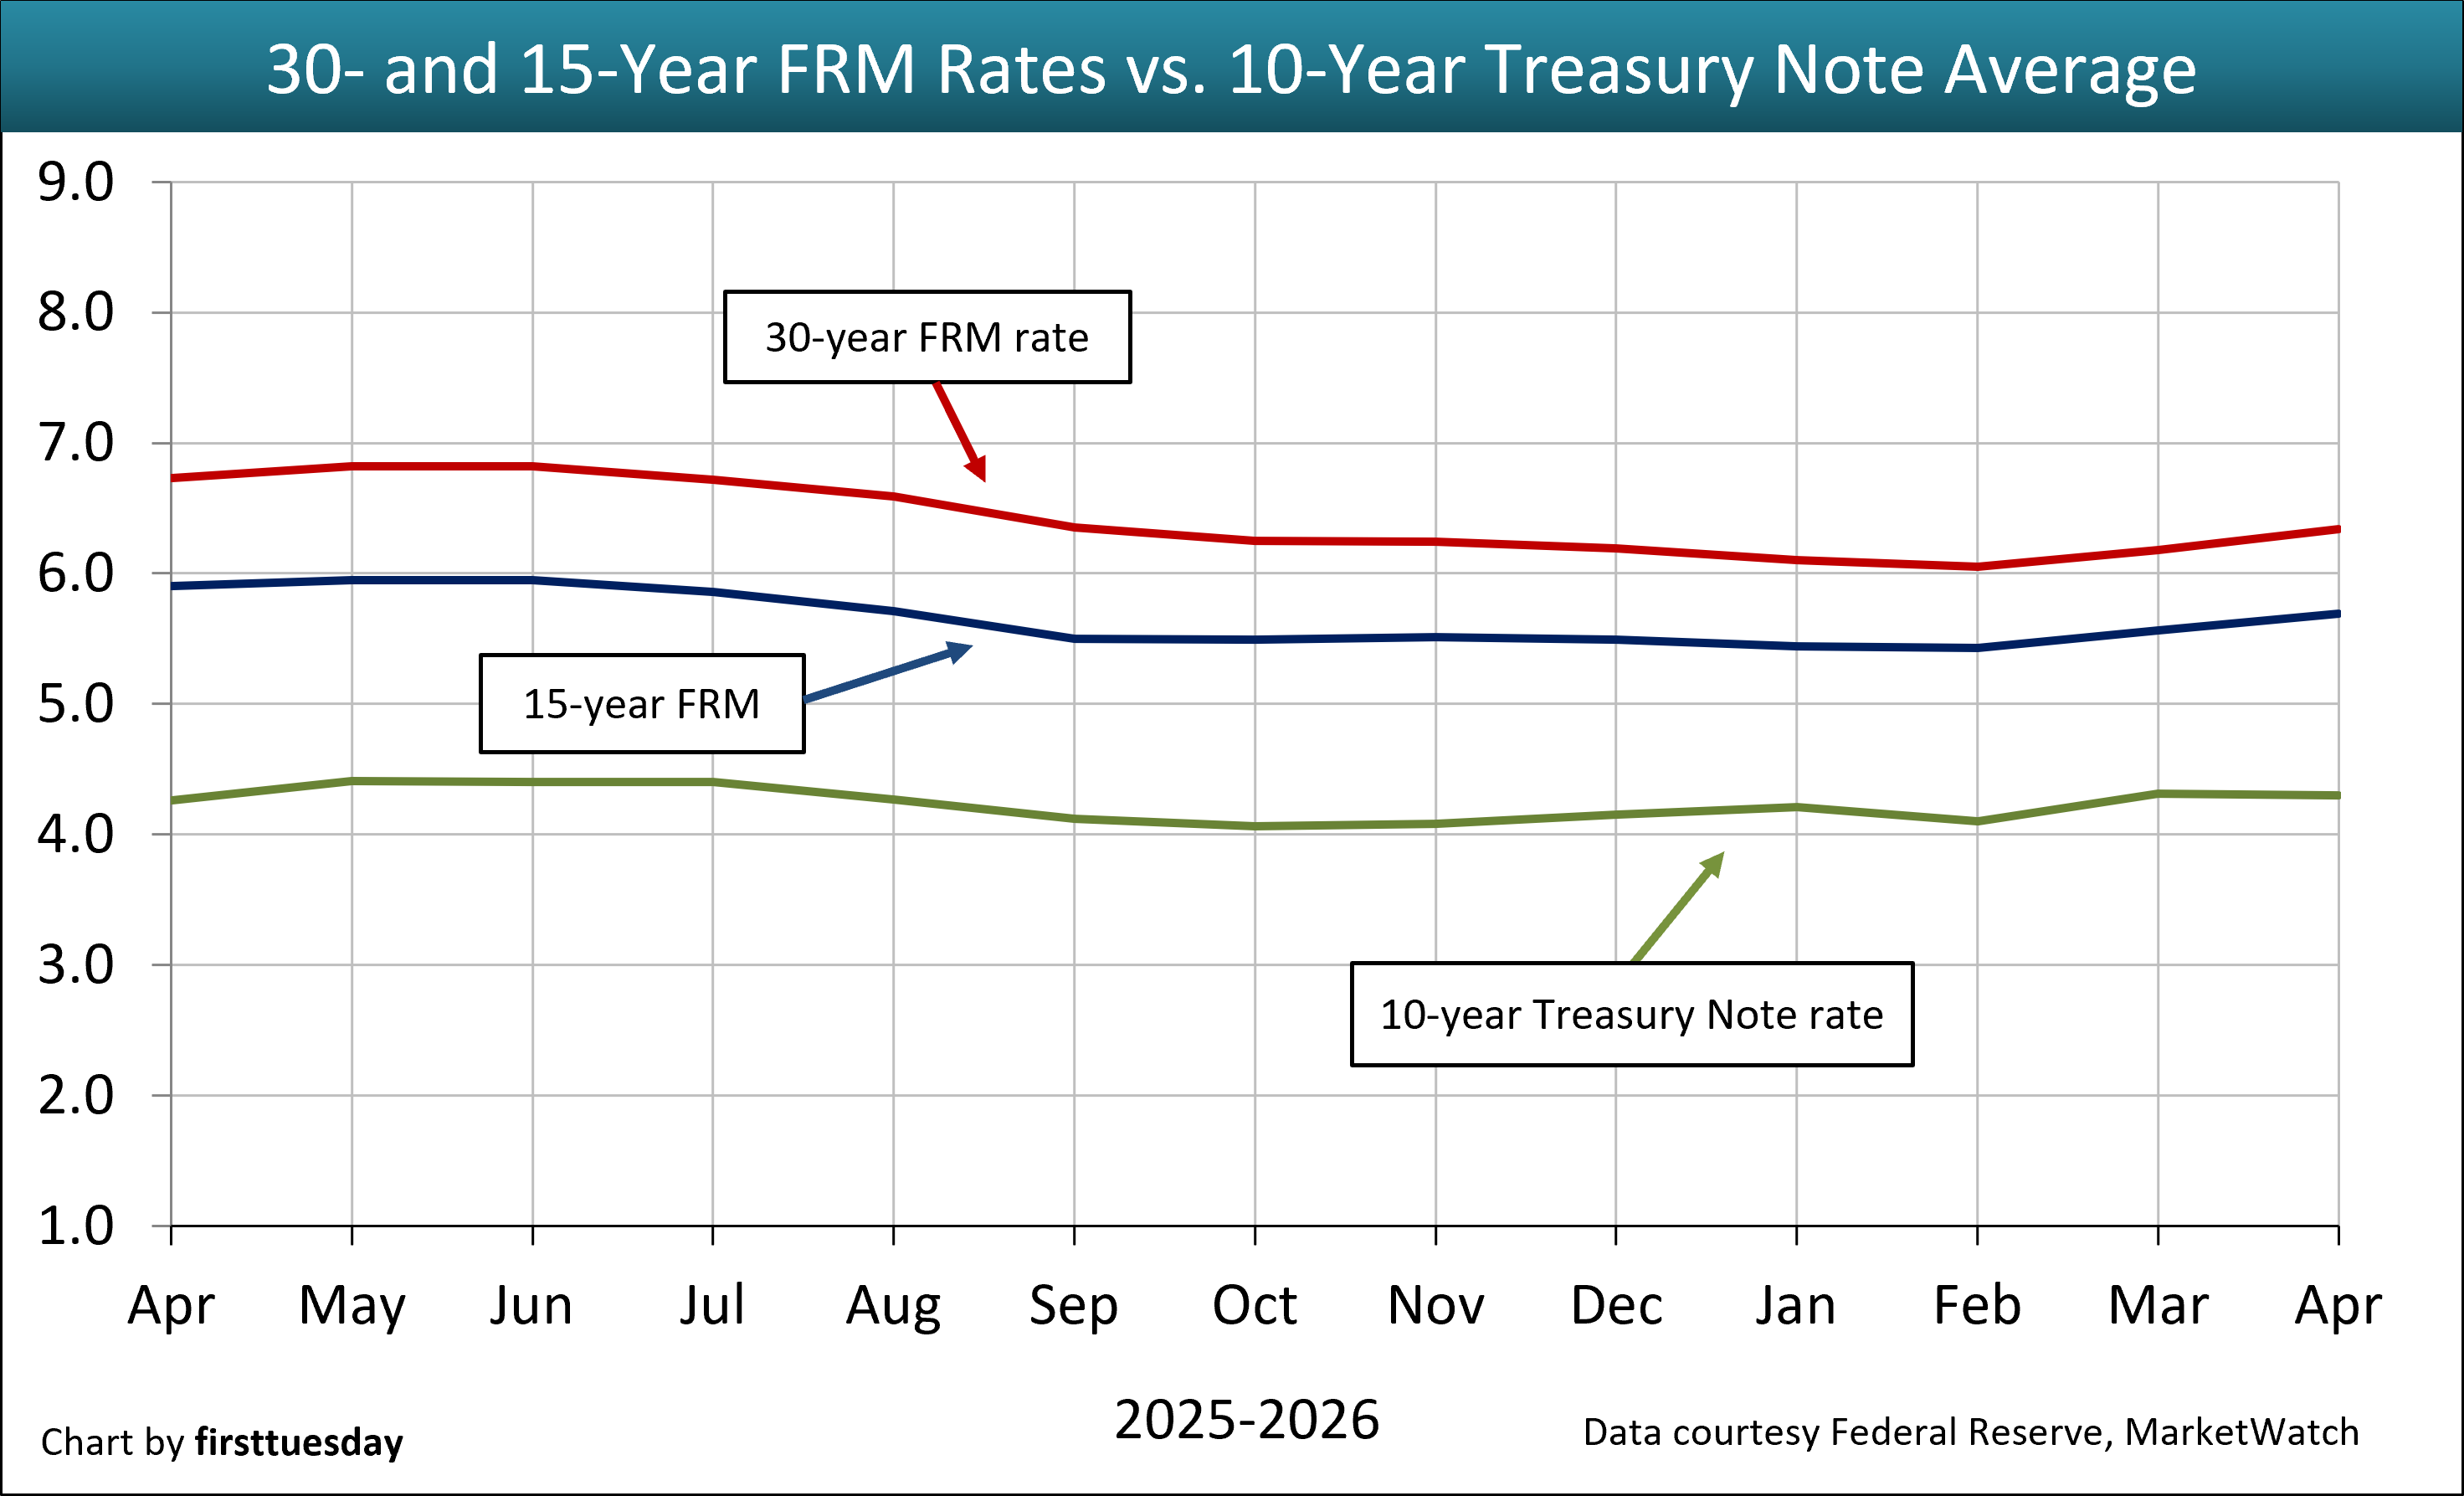
Fundamentally, FRM rates are tied to the 10-year Treasury note market, as are capitalization (cap) rates for setting income property prices. The 30-year FRM rate moves in tandem with the 10-year Treasury note rate, to which MLOs add a risk premium of between 1.5% and 3.0% based on a perceived risk of loss on mortgage defaults. Historically, the risk premium spread between the 10-year T-Note rate and the 30-year FRM rate in normal times is 1.5%. The spread is far greater for property investor cap rates to set property value.
The 10-year T-Note dropped to 4.44% on May 29, 2026. The spread between the 10-year T-Note and 30-year FRM rate is 2.09%, gradually returning to the historical risk premium spread of 1.5%.
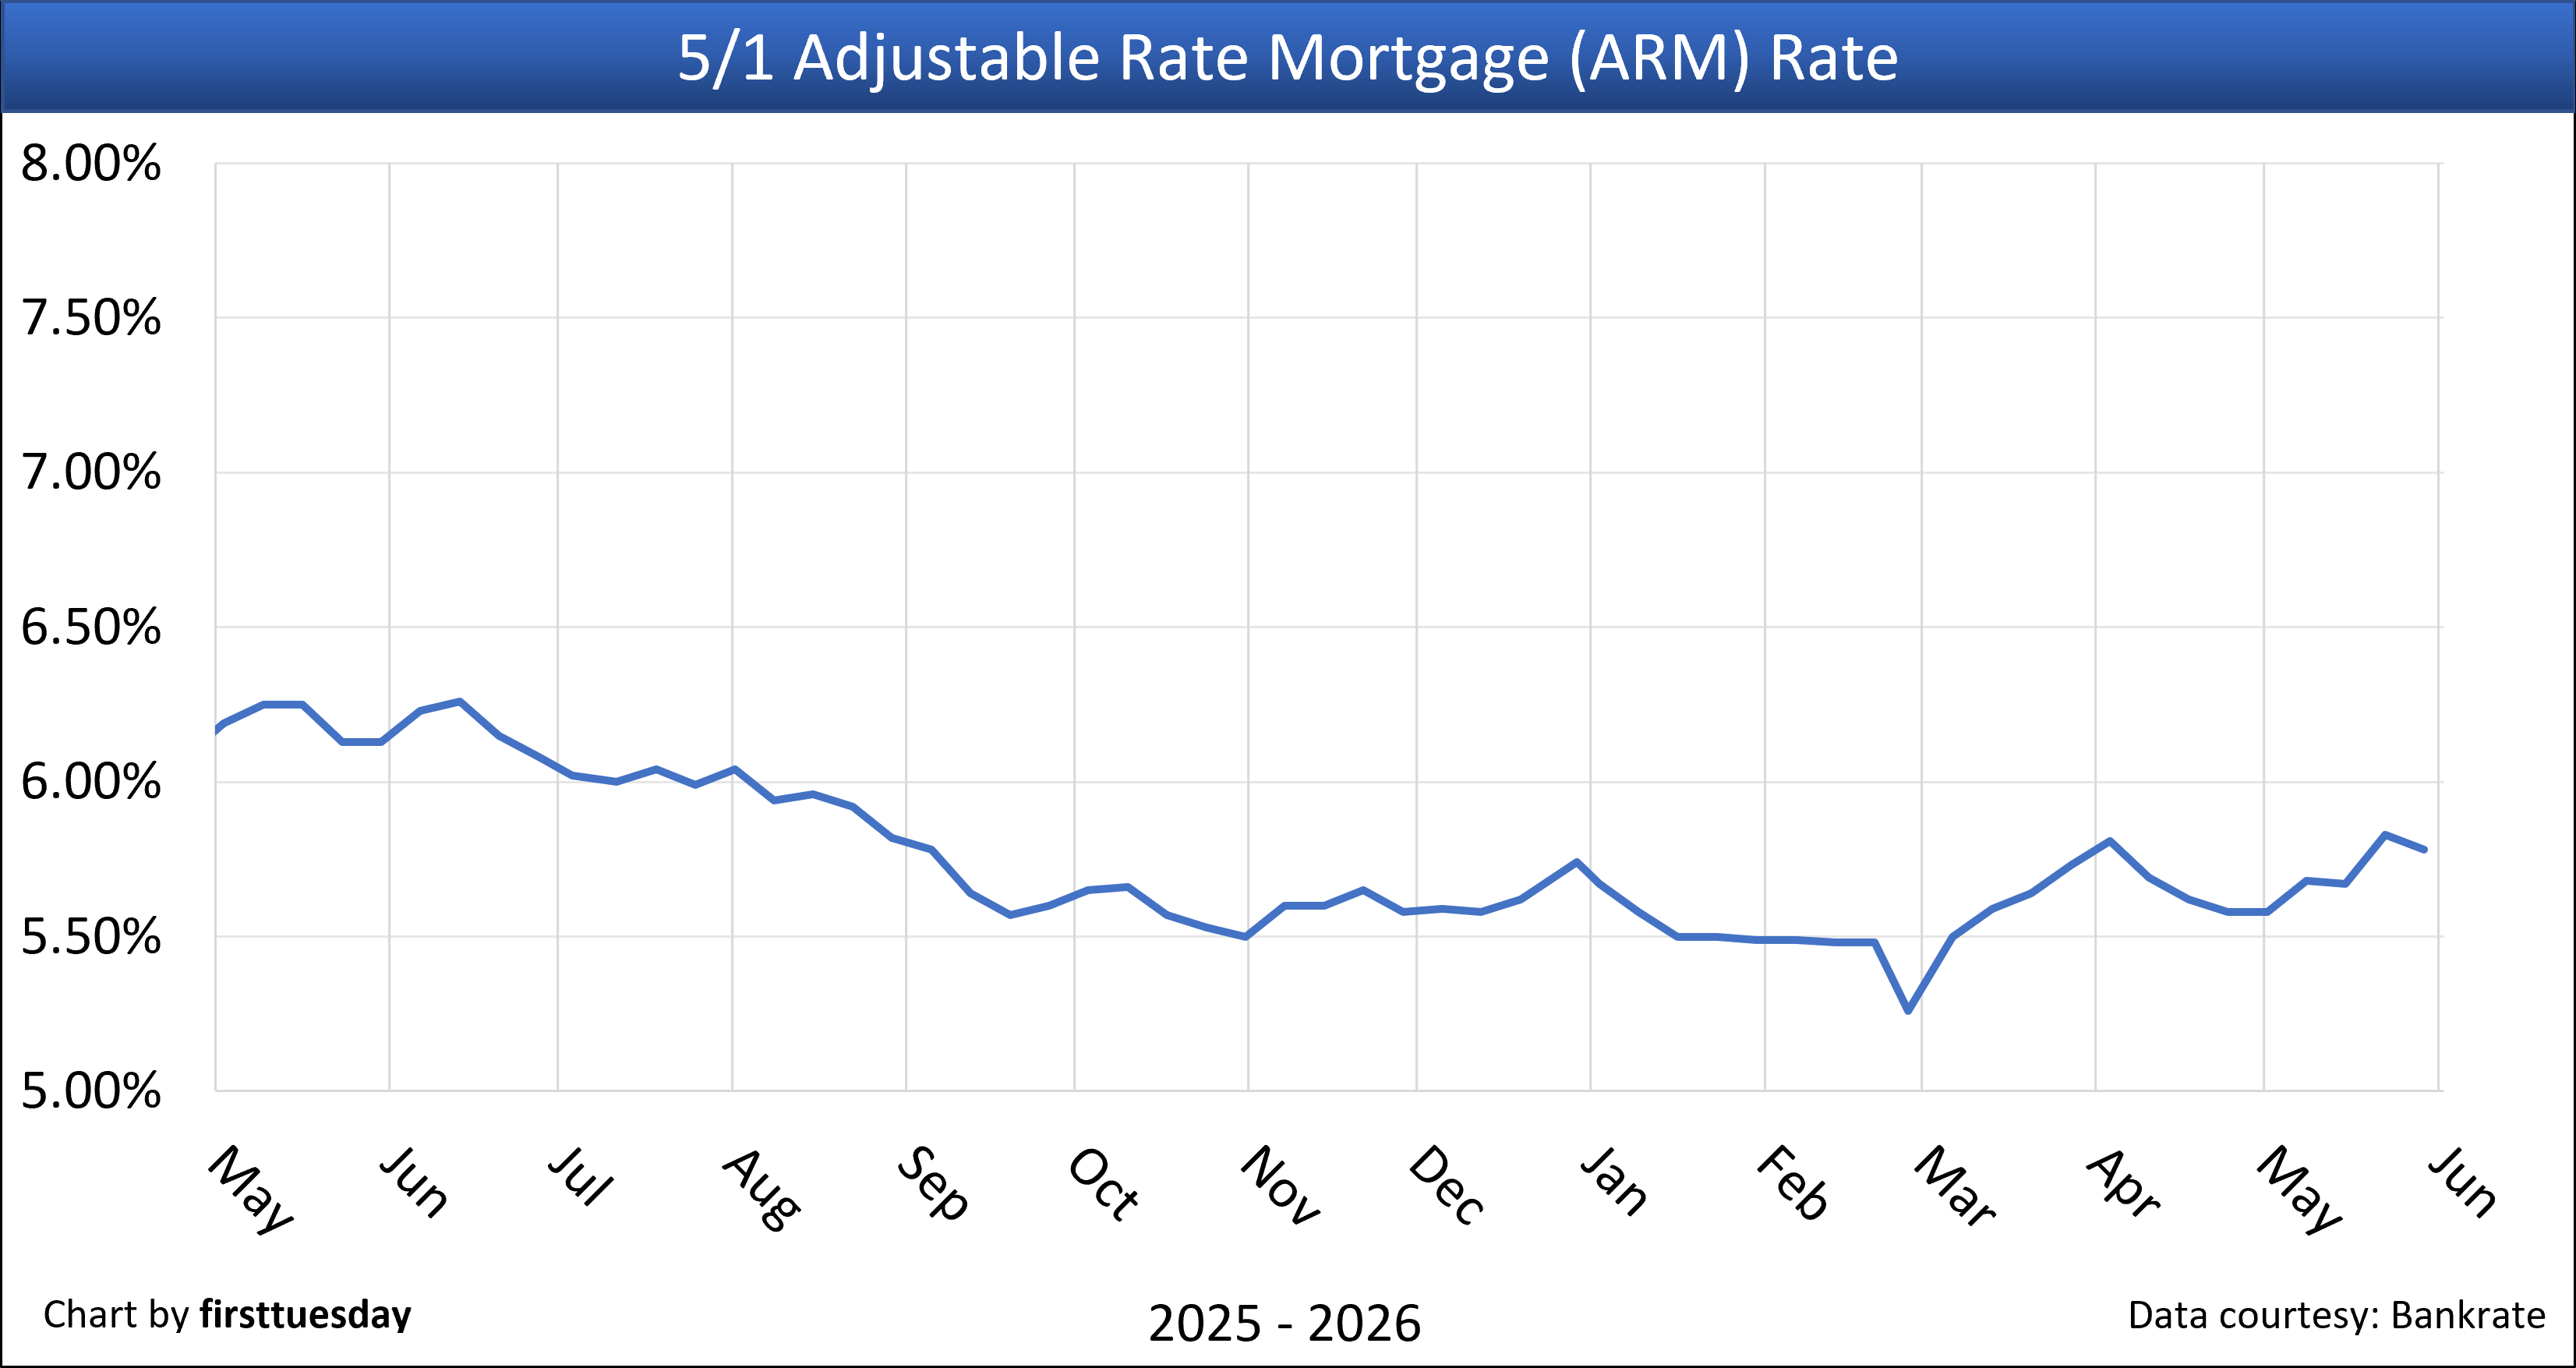
The average monthly rate on adjustable rate mortgages (ARMs) slipped to 5.78% on May 29, 2026.
The interest rate on the ARM is slightly below the 15-year FRM and 75 percentage points lower than the 30-year FRM rate. A positive 30-year ARM-to-FRM spread gives a homebuyer or owner a bump in the amount they can borrow by taking out an ARM.
The downside in this reach for more funding through a non-conventional (predatory) mortgage is the significant forward risks of loss-by-foreclosure inherent in ARMs when rates trend higher or an employment recession sets in. Unchanged, an ARM is the mortgage available to finance the risk-tolerant cohort of high-tier housing and commercial property buyers and owners.
The following was updated May 29, 2026.
Click the link to go directly to a chart, or browse the charts by scrolling below.
1. 30-year fixed rate mortgage (FRM) rate, weekly— Chart update 5/29/2026
2. 30-year FRM rate, monthly — Chart update 5/1/2026
3. 15-year FRM rate — Chart update 5/29/2026
4. 5/1 adjustable rate mortgage (ARM) rate, monthly — Chart update 5/1/2026
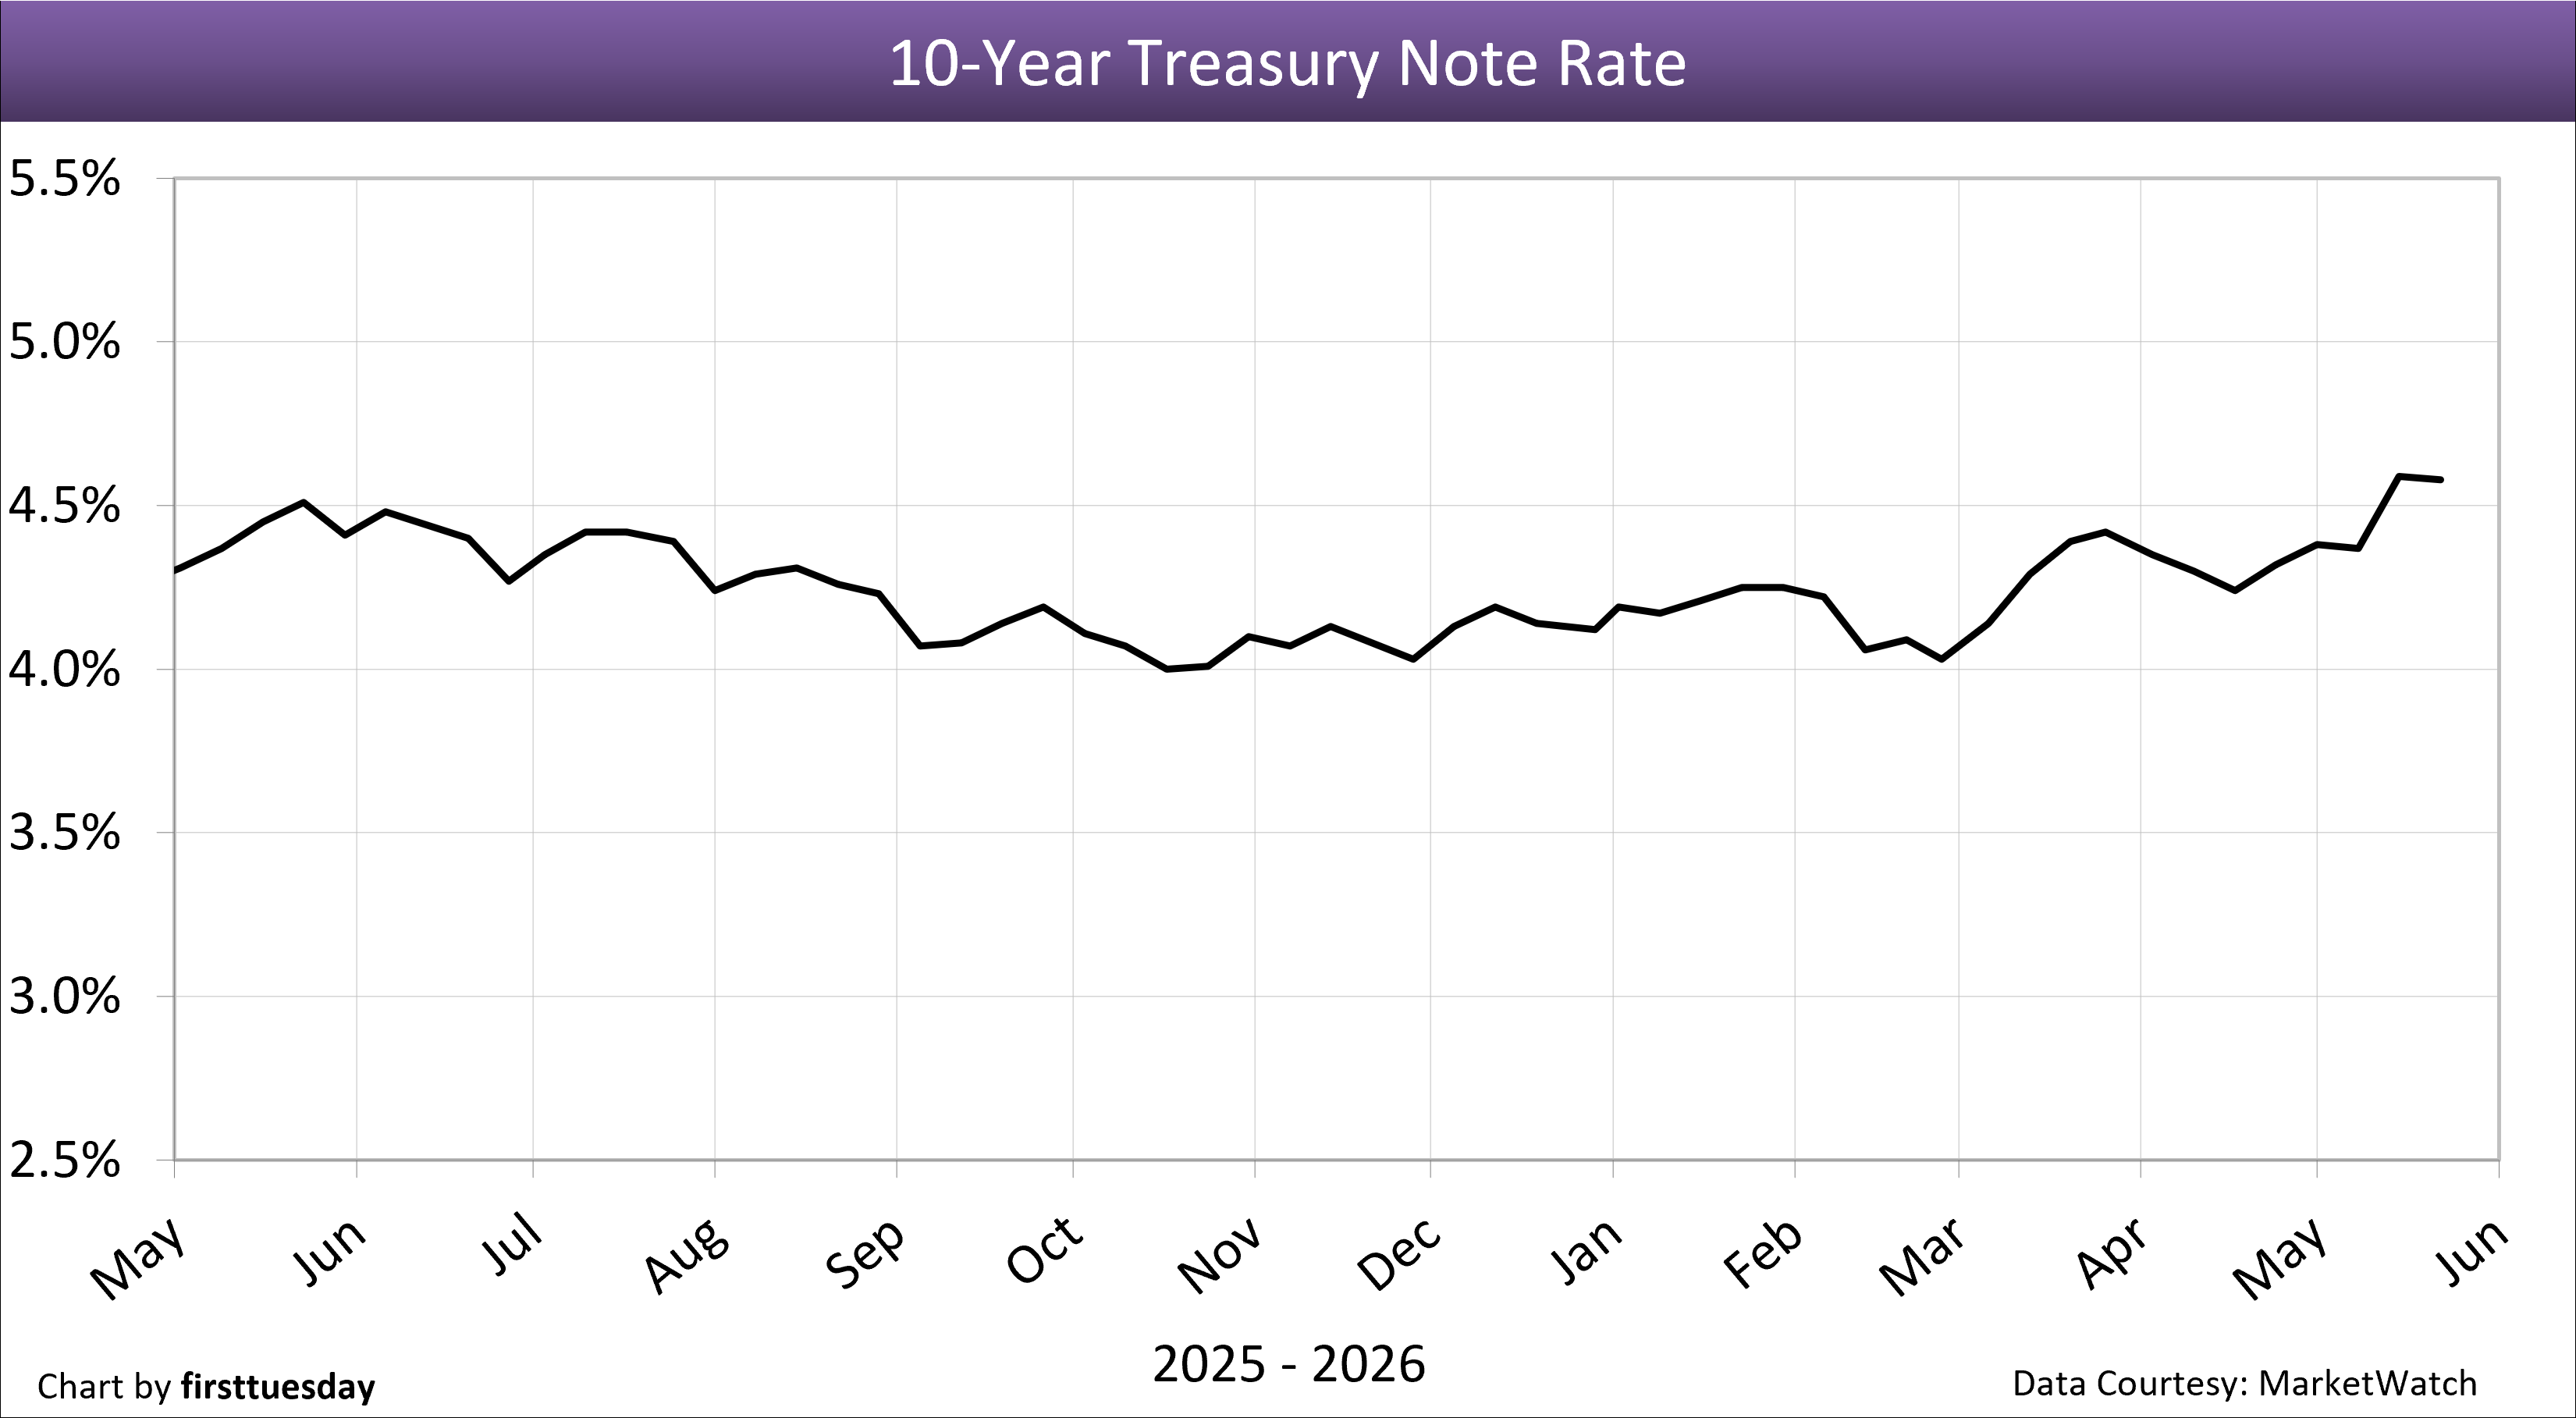
5. 10-year Treasury note rate — Chart update 5/29/2026
6. Combined FRM and 10-year Treasury note rates — Chart update 5/1/2026
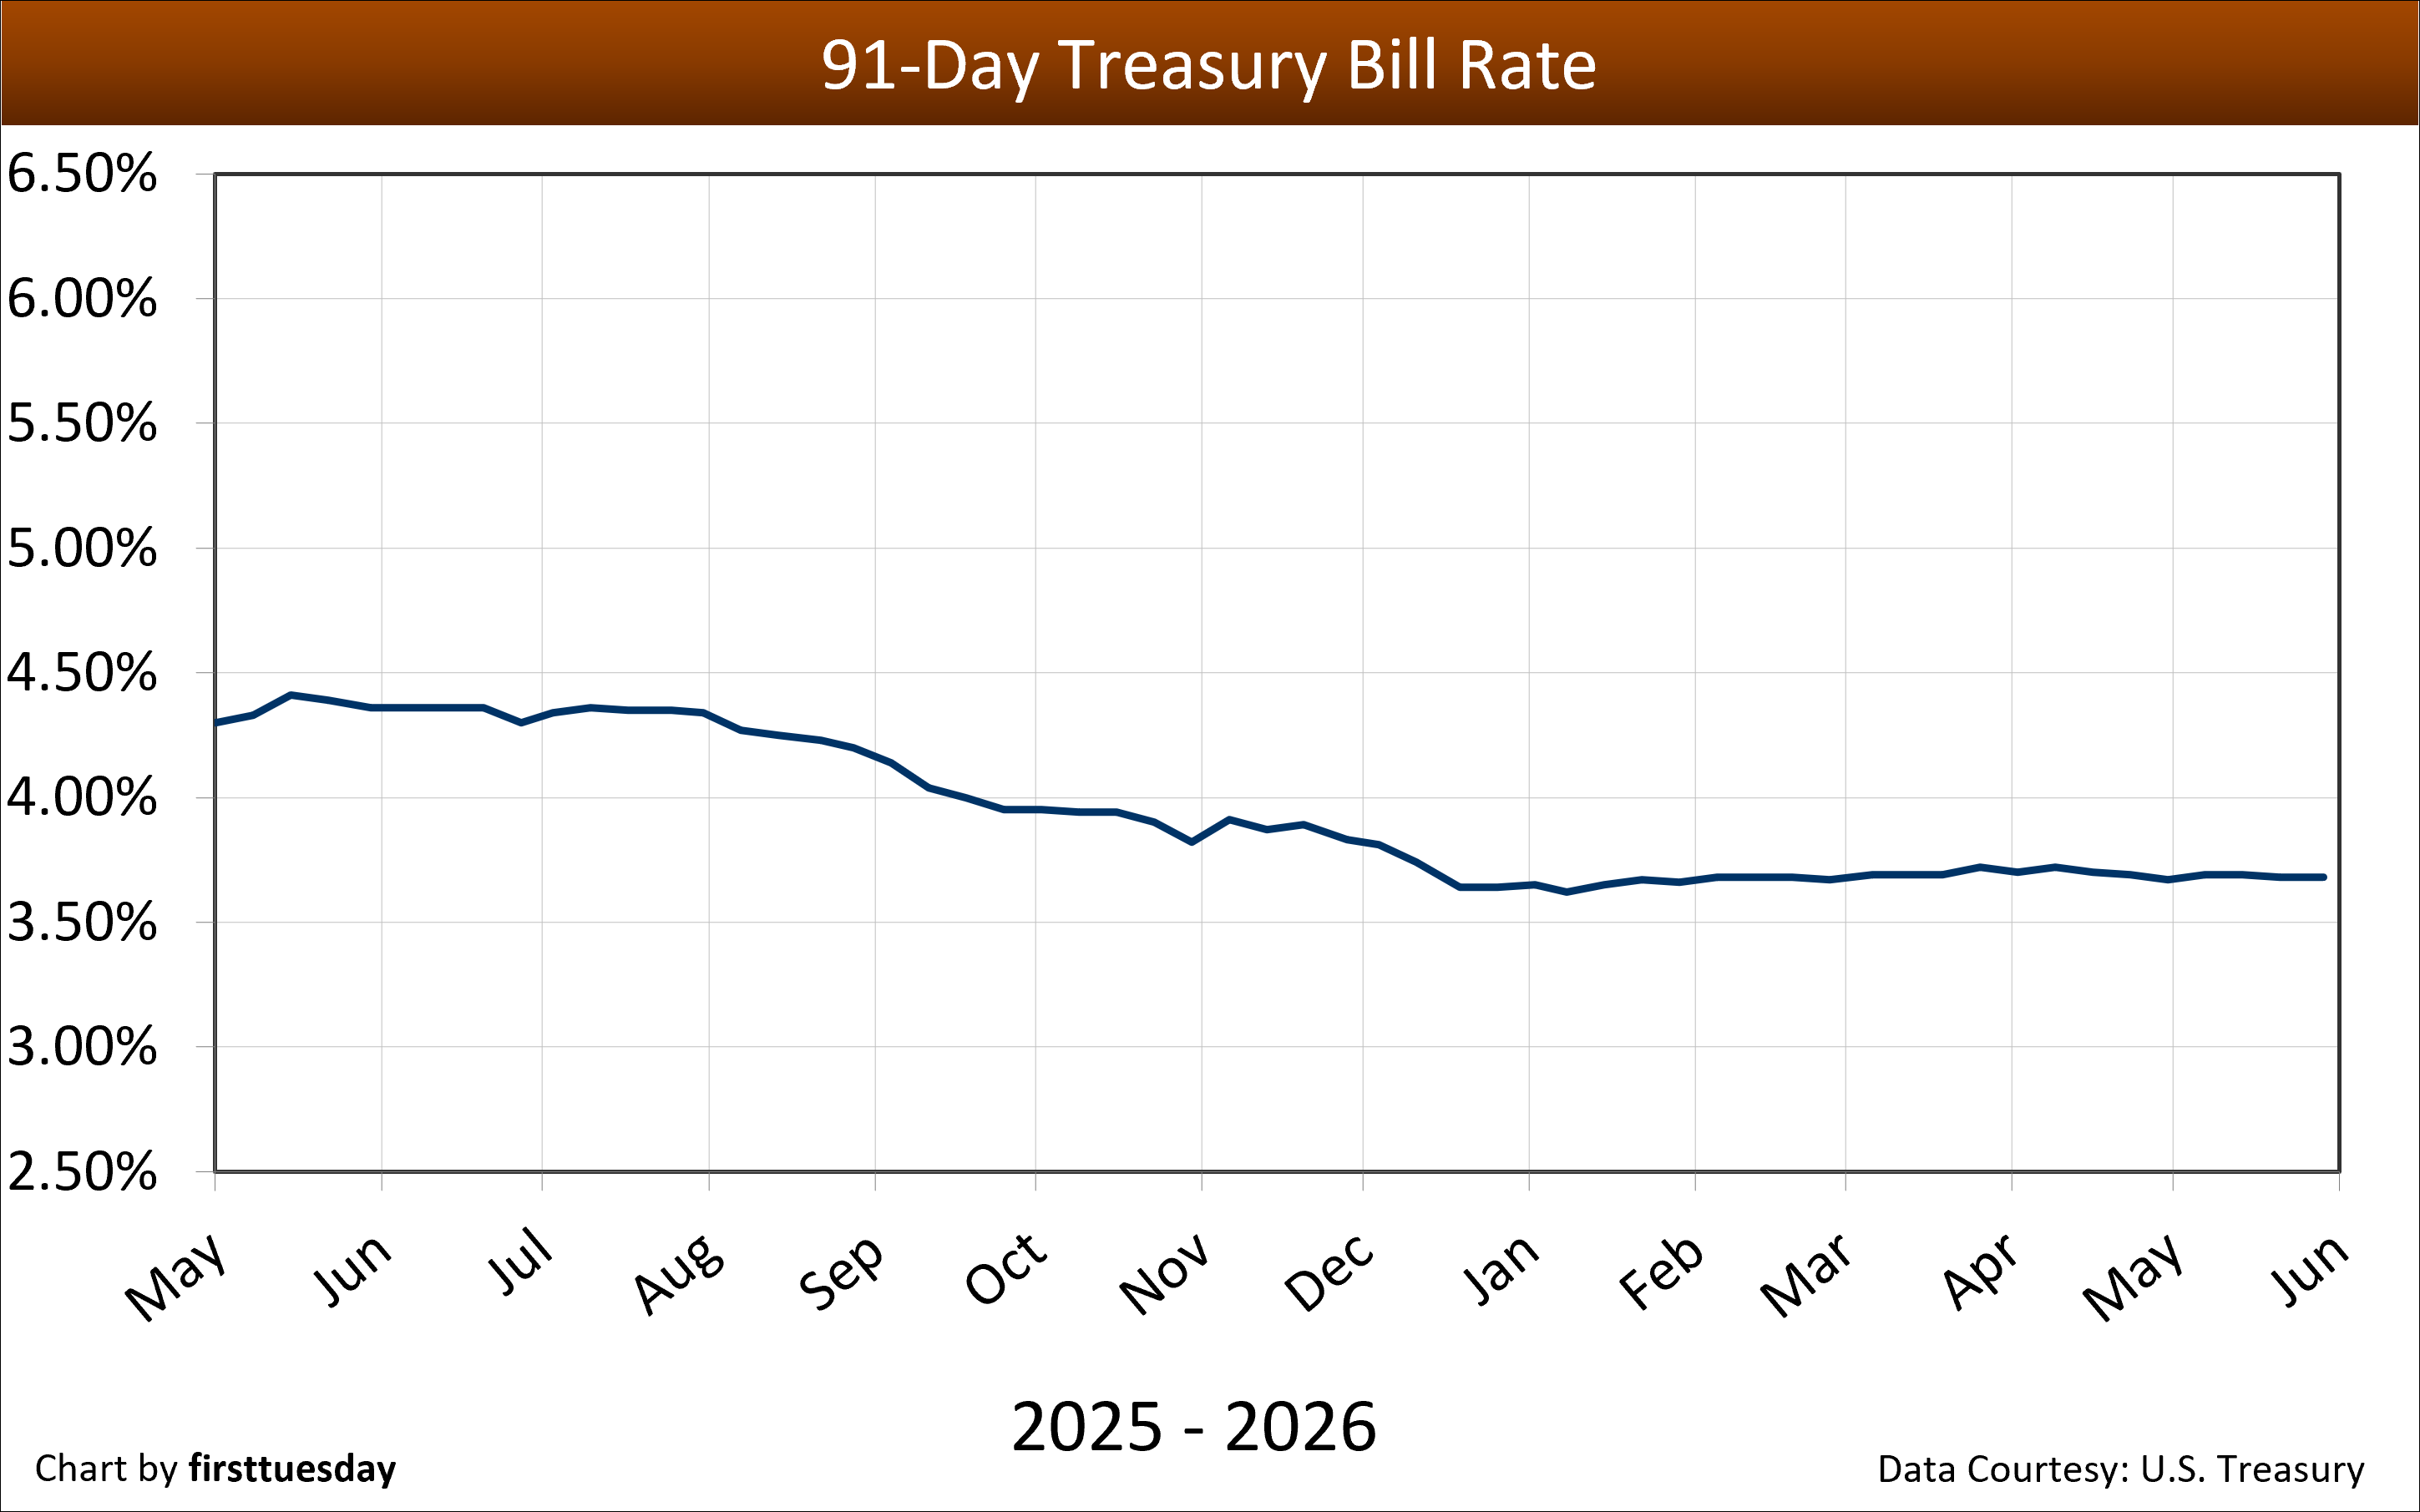
7. 91-day Treasury bill rate — Chart update 5/29/2026
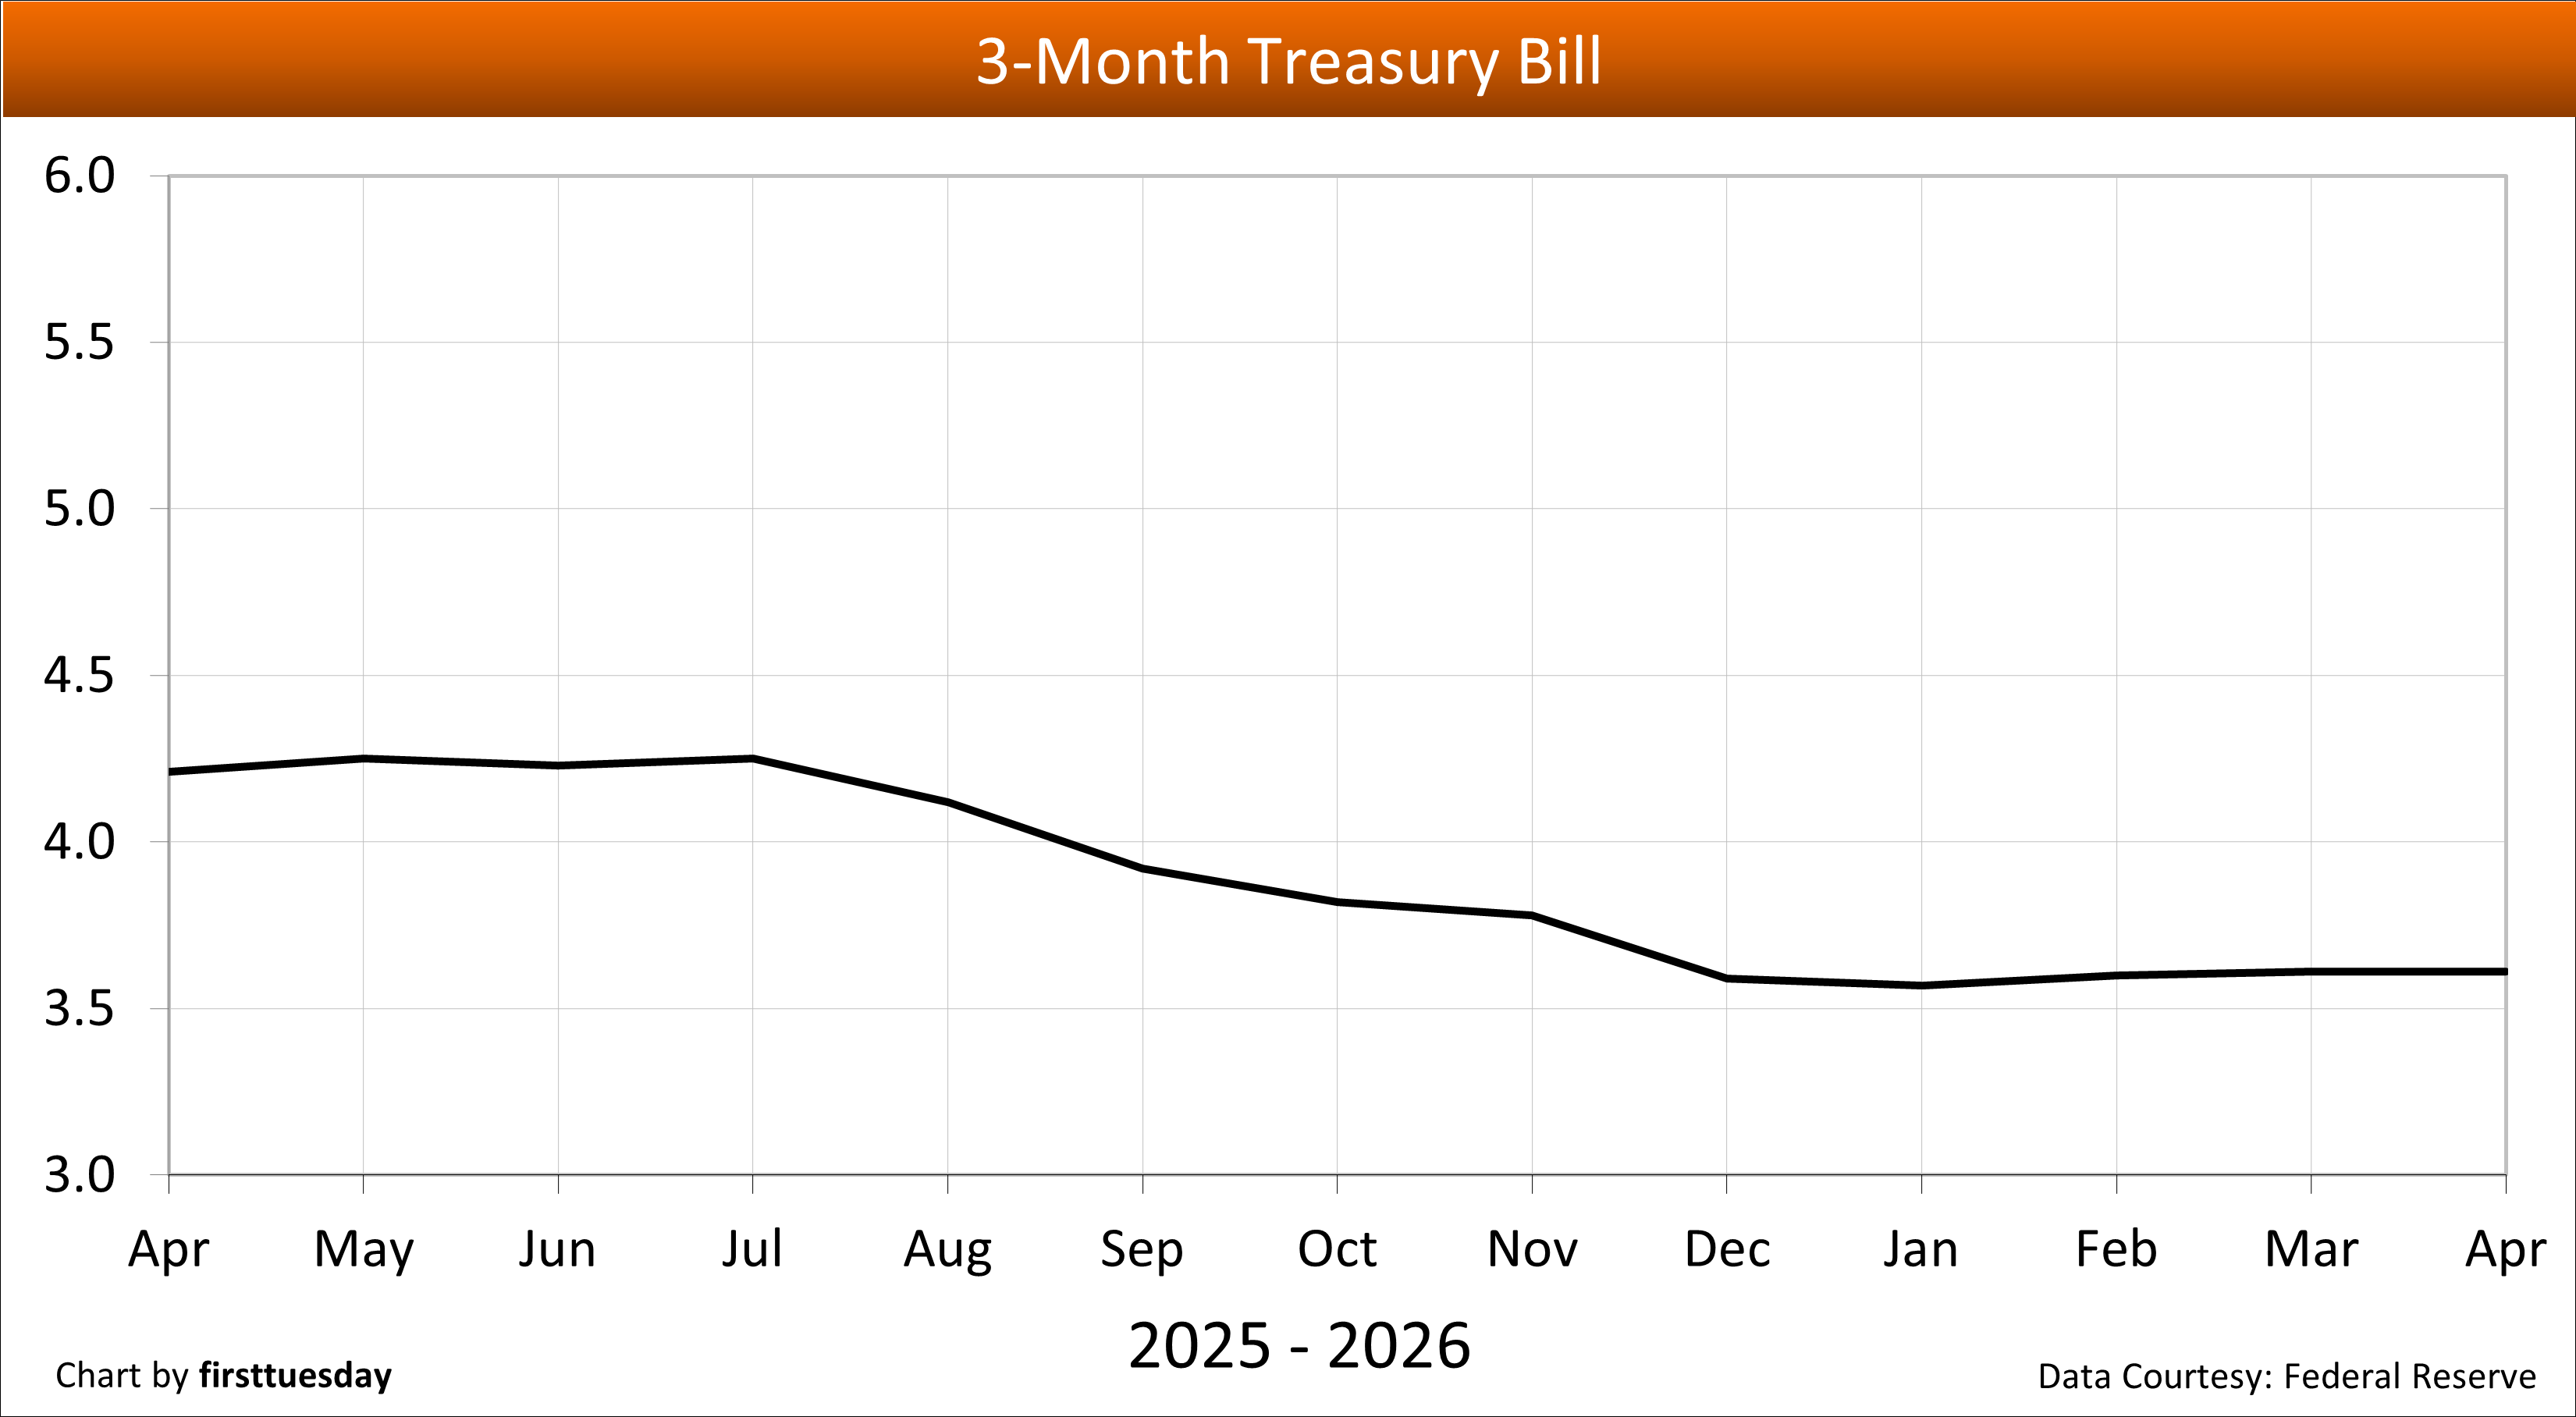
8. 3-month Treasury bill — Chart update 5/8/2026
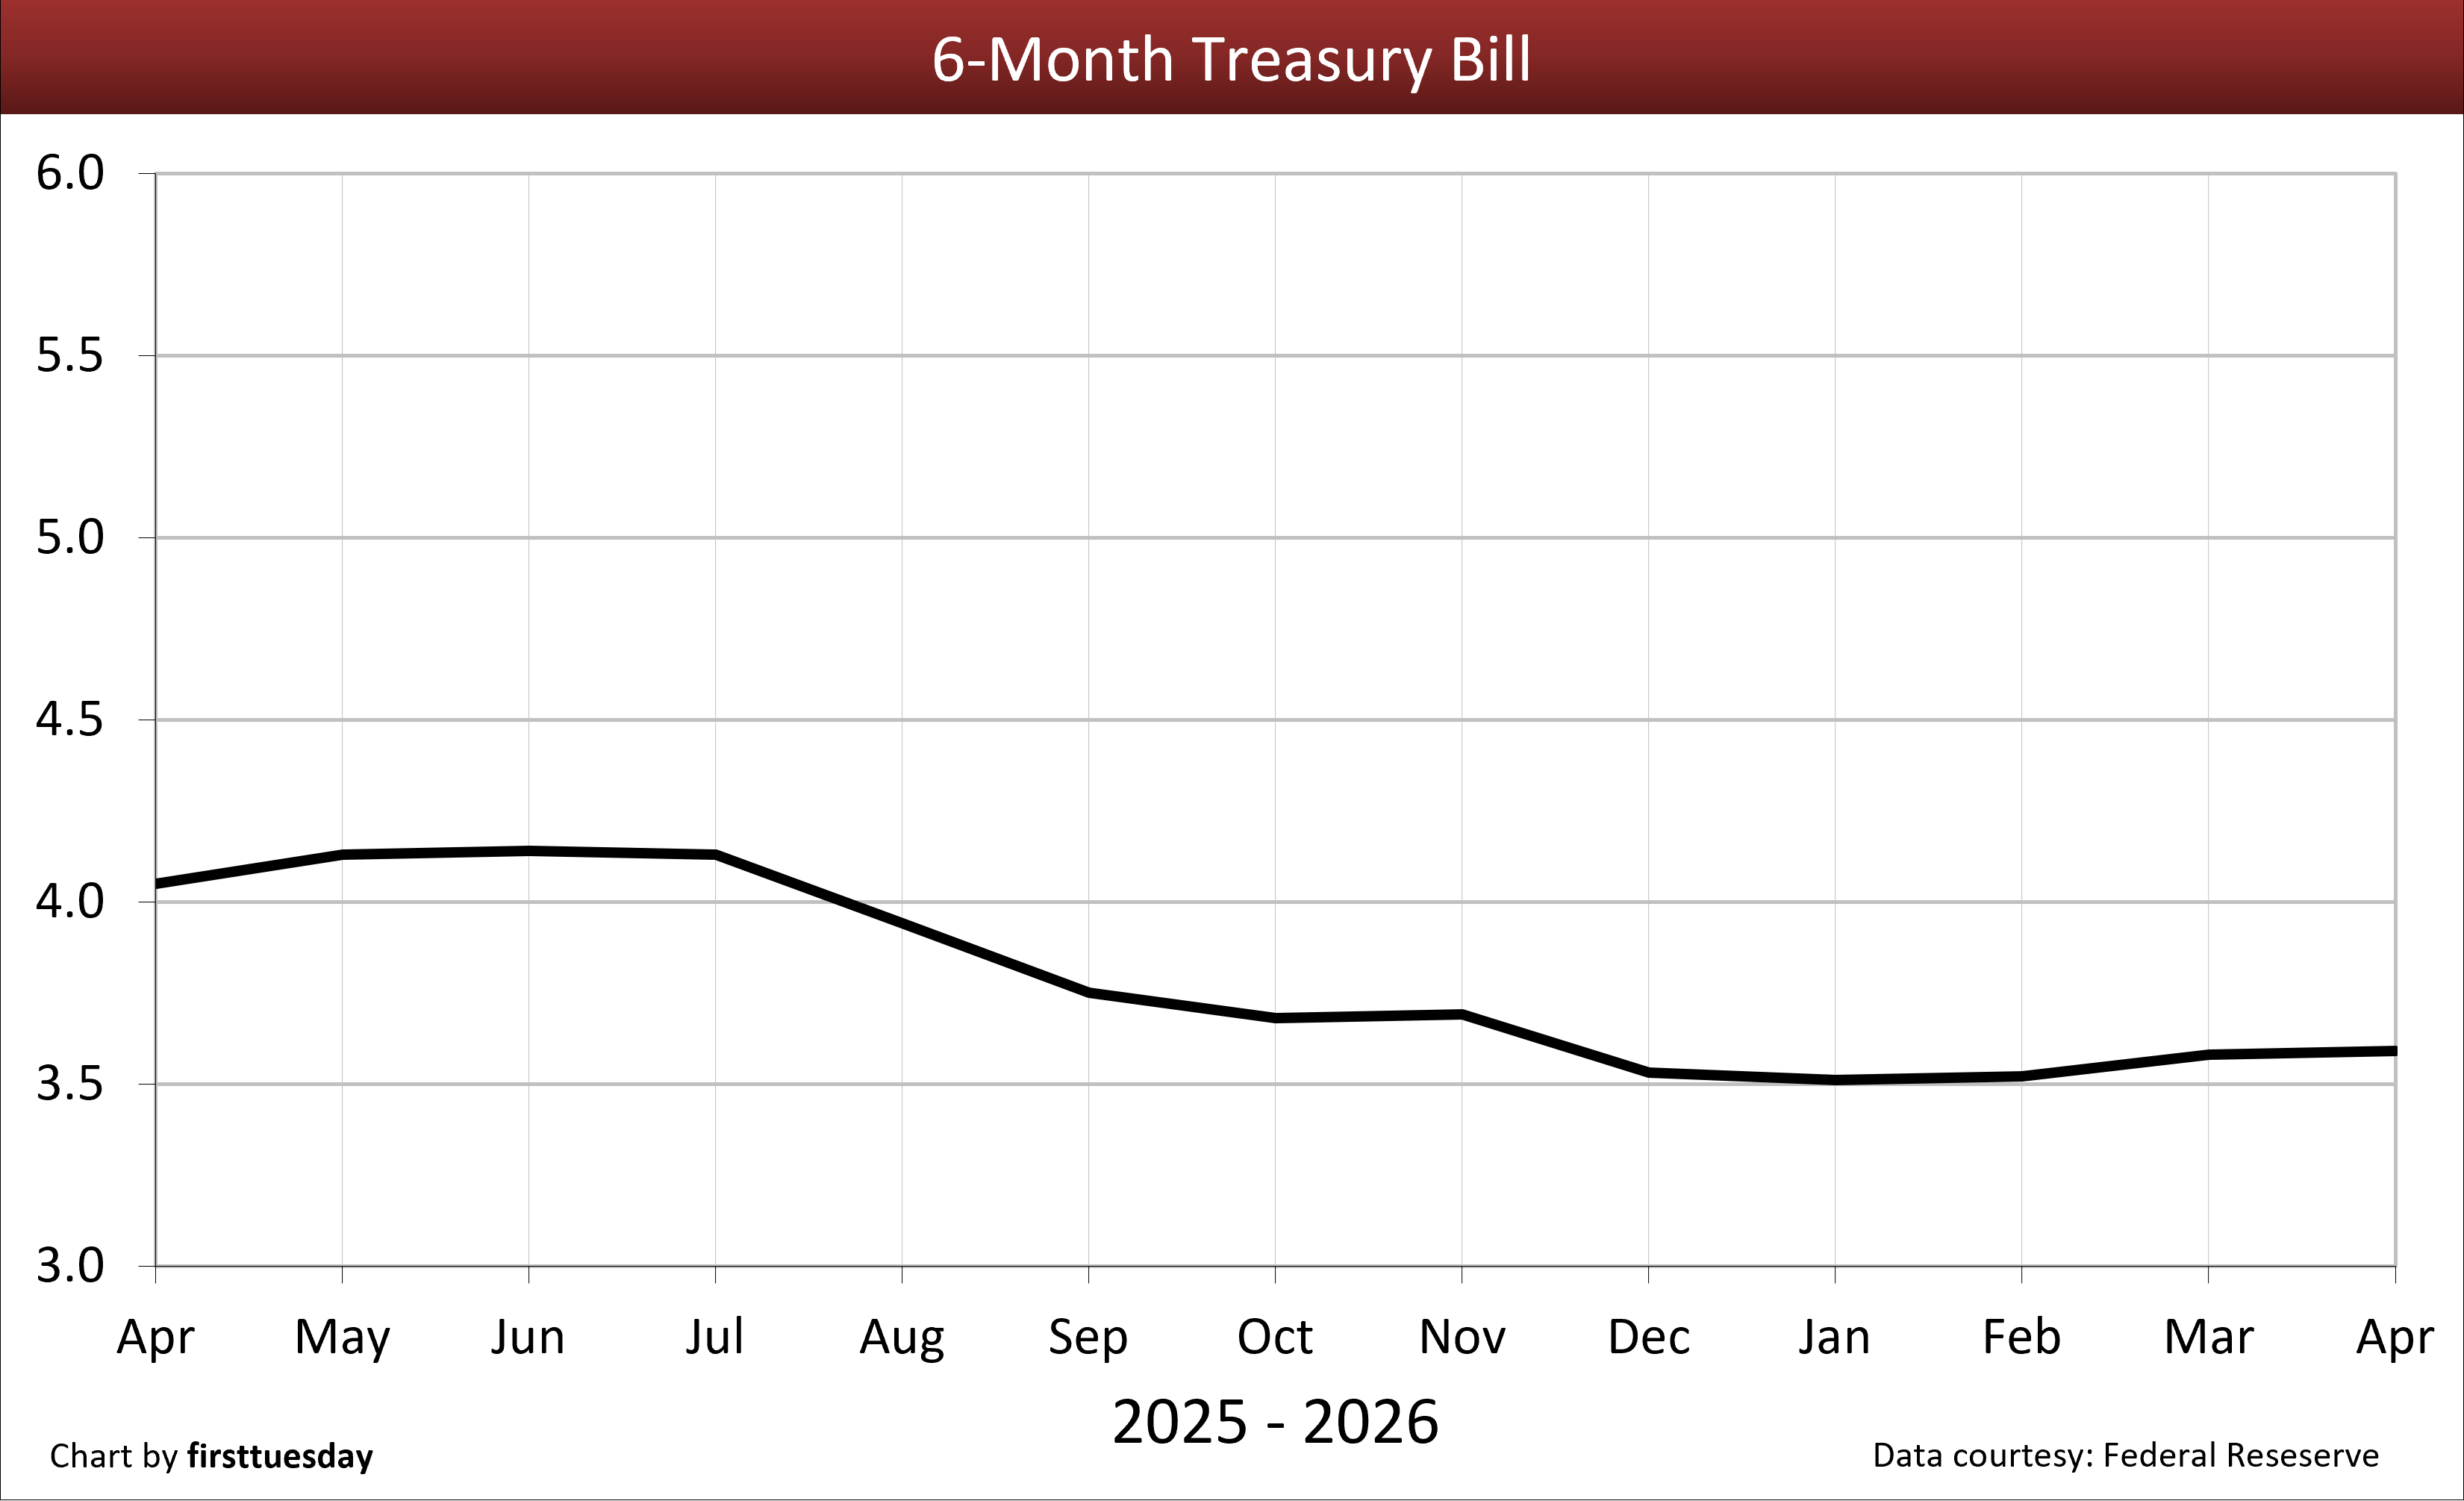
9. 6-month Treasury bill — Chart update 5/8/2026
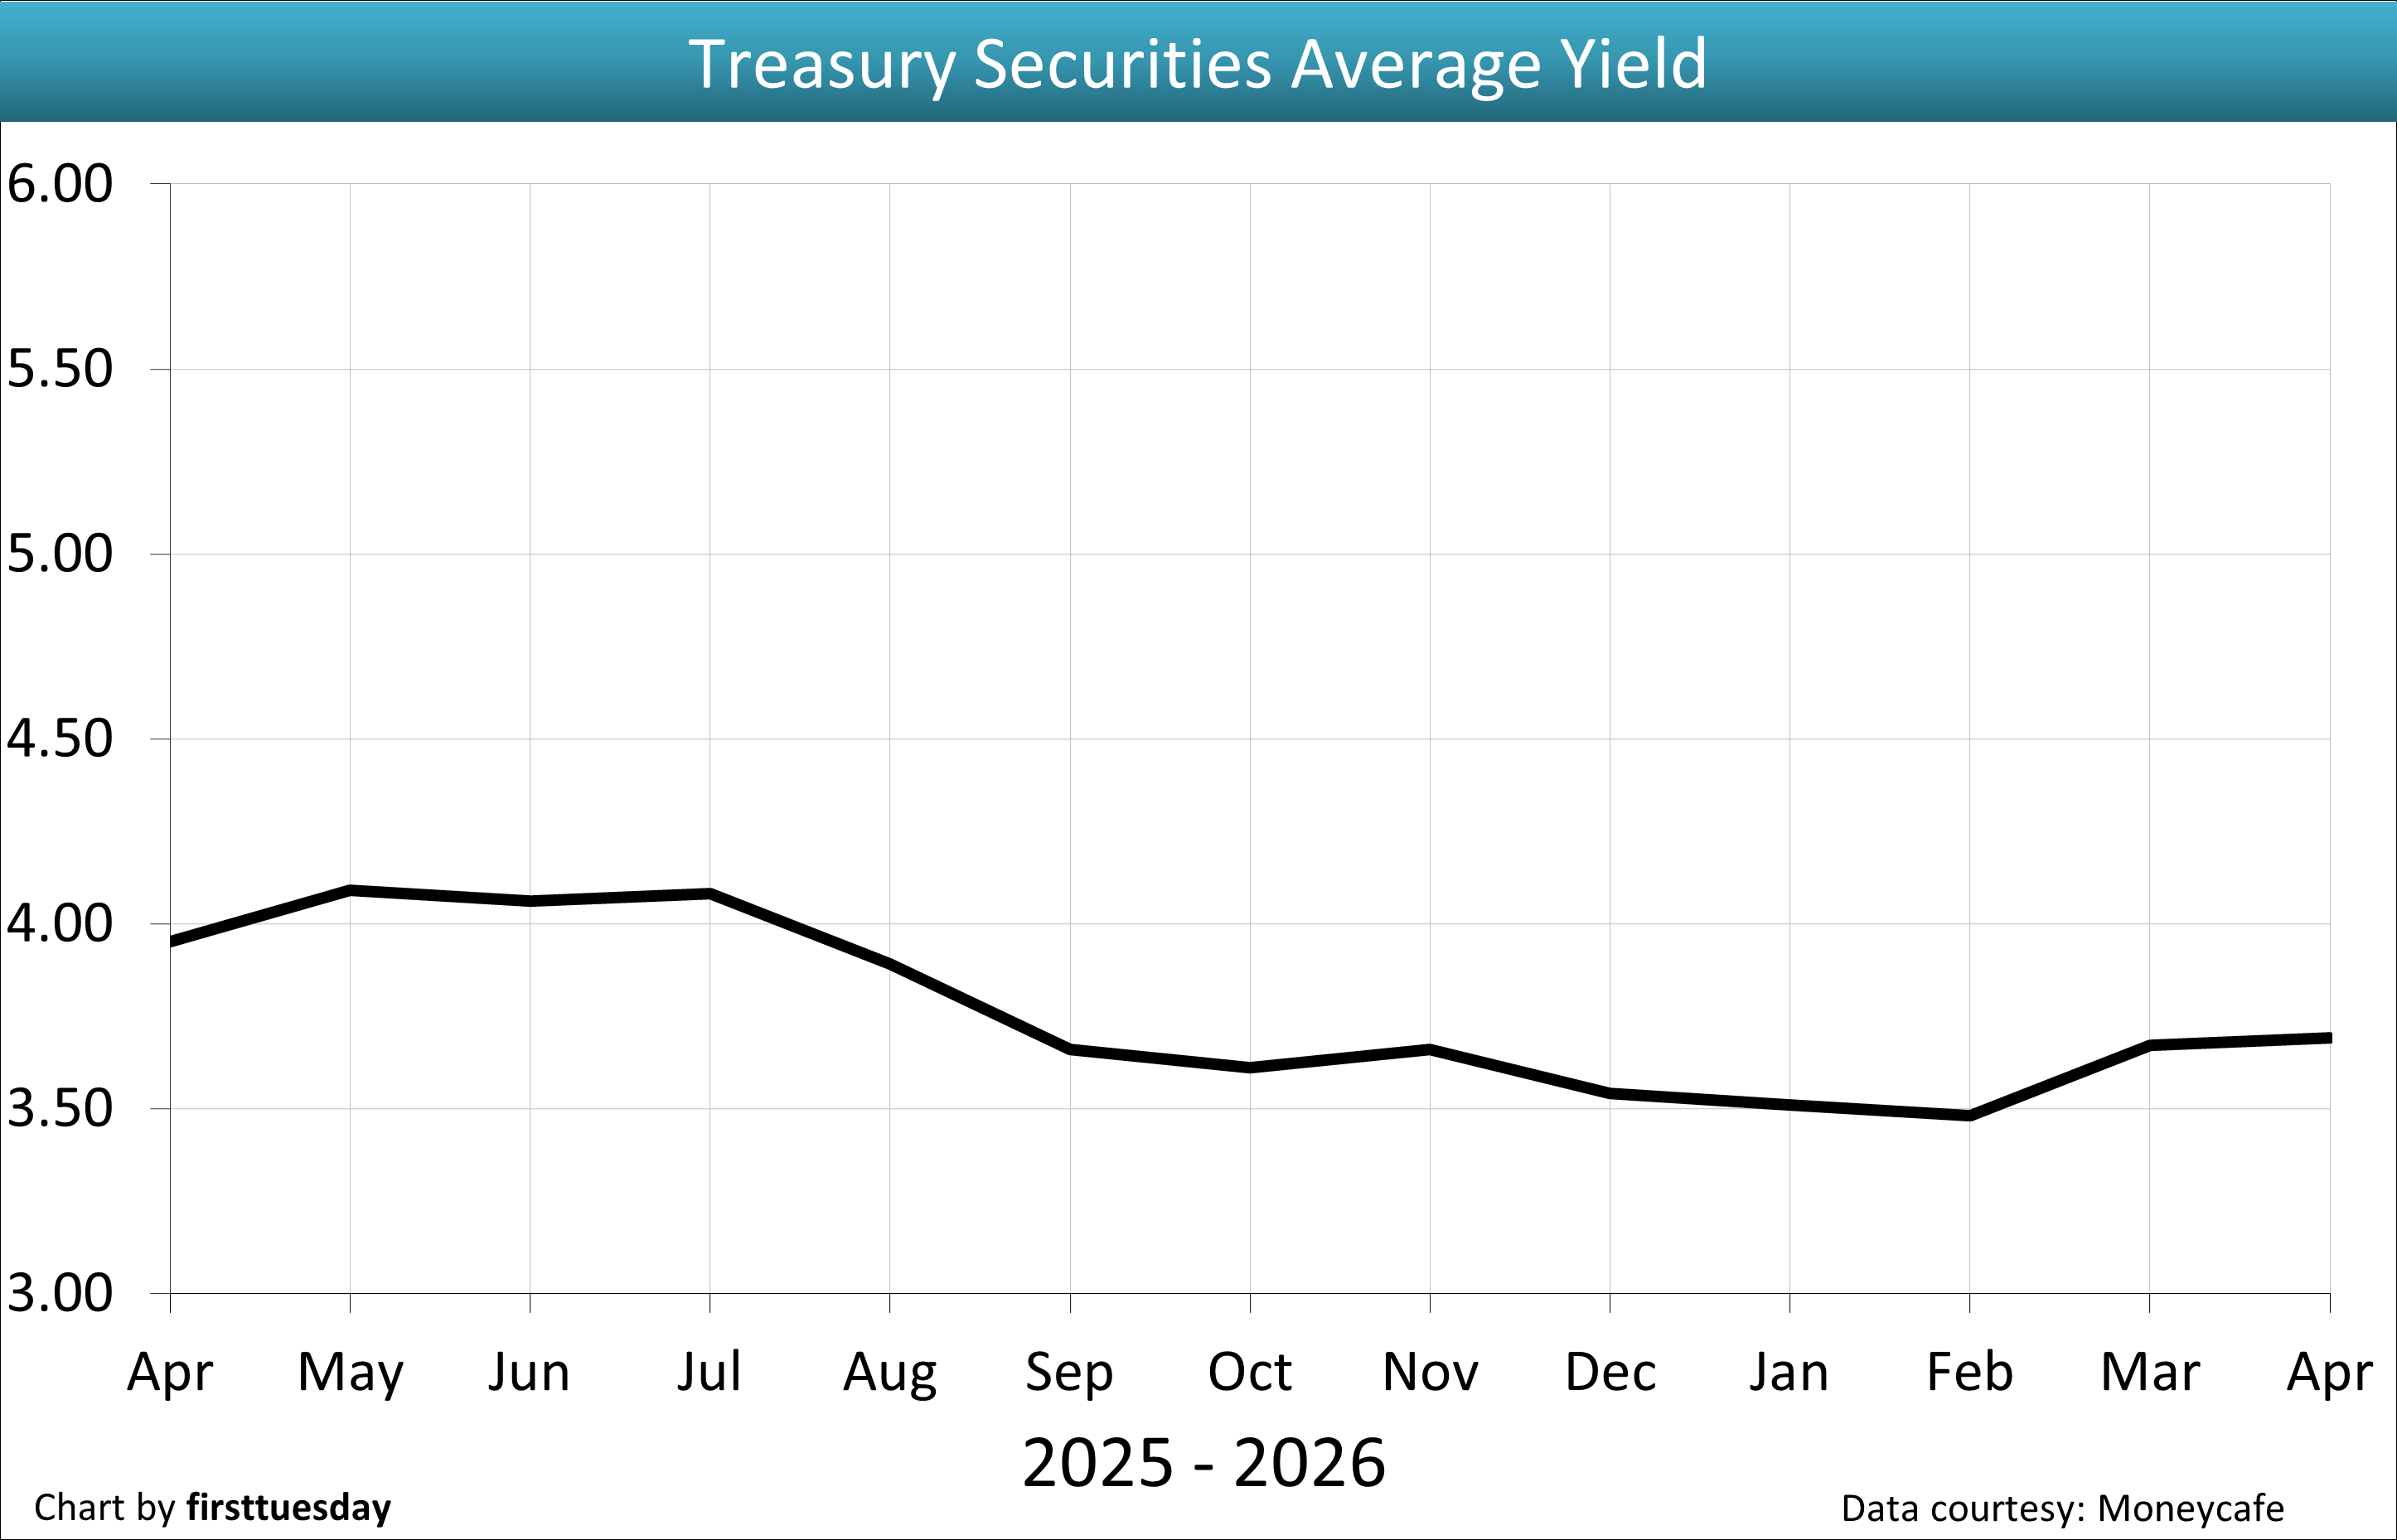
10. Treasury Securities average yield (CMT) — Chart update 5/8/2026
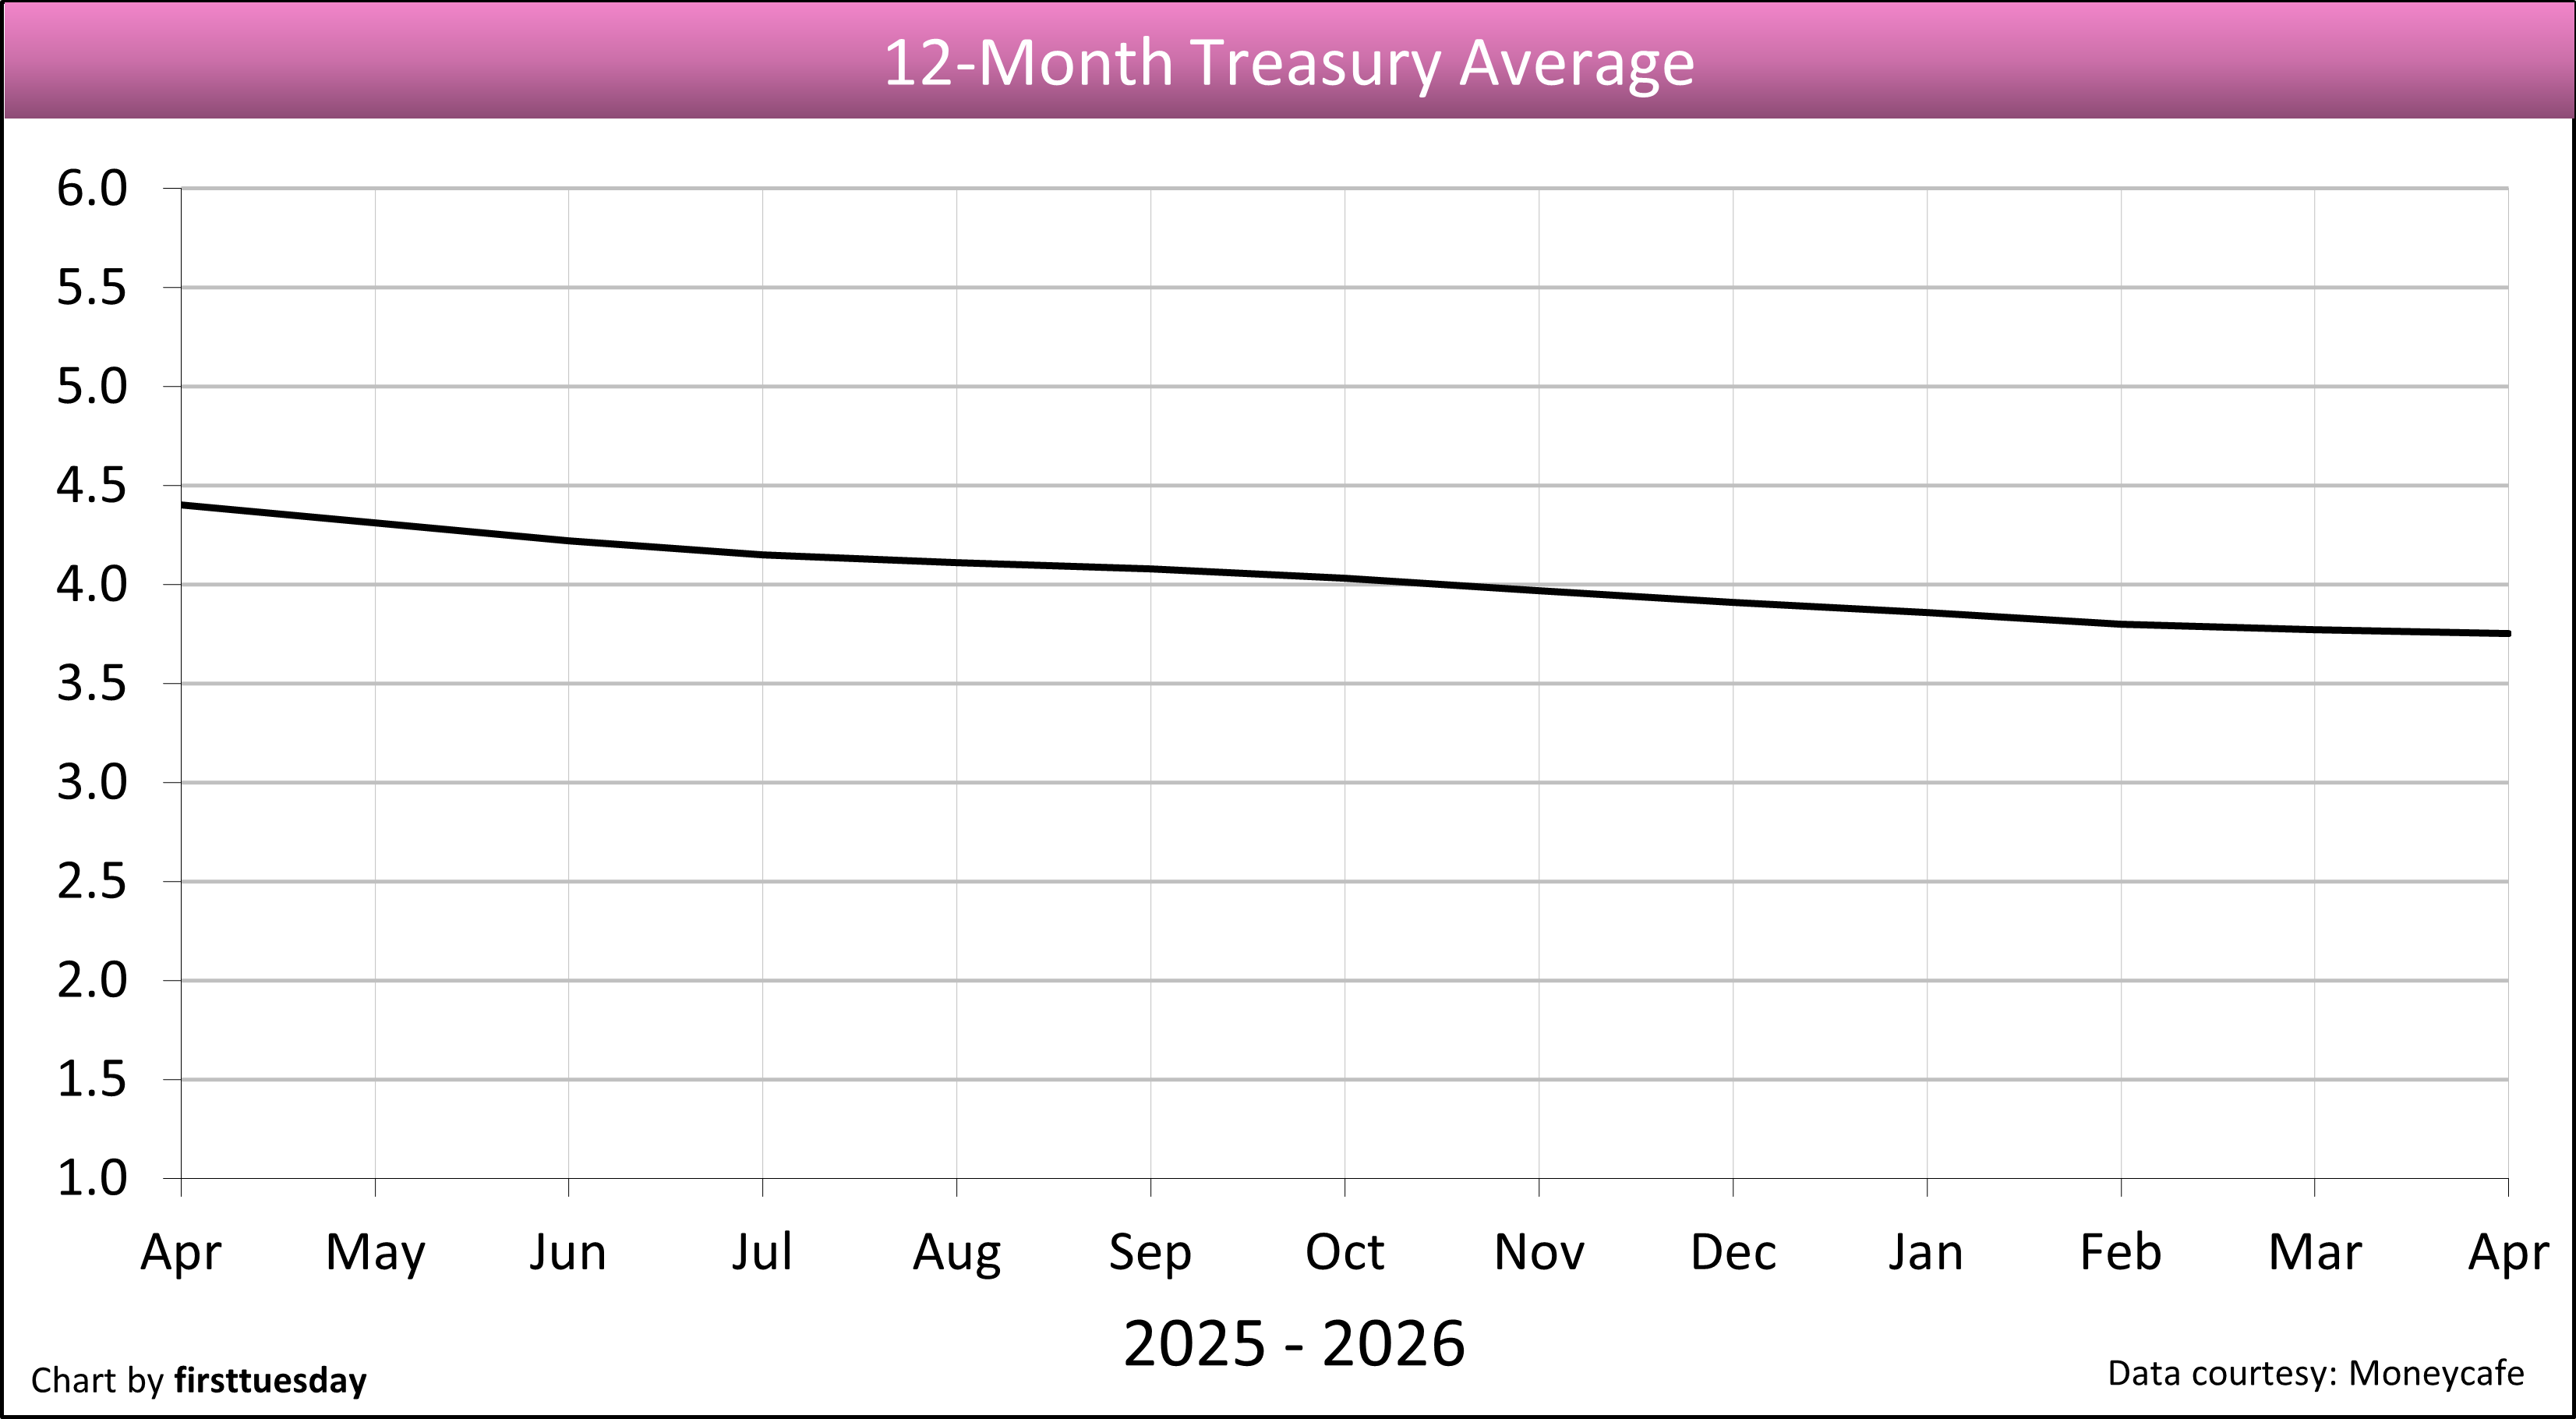
11. 12-month Treasury average — Chart update 5/8/2026
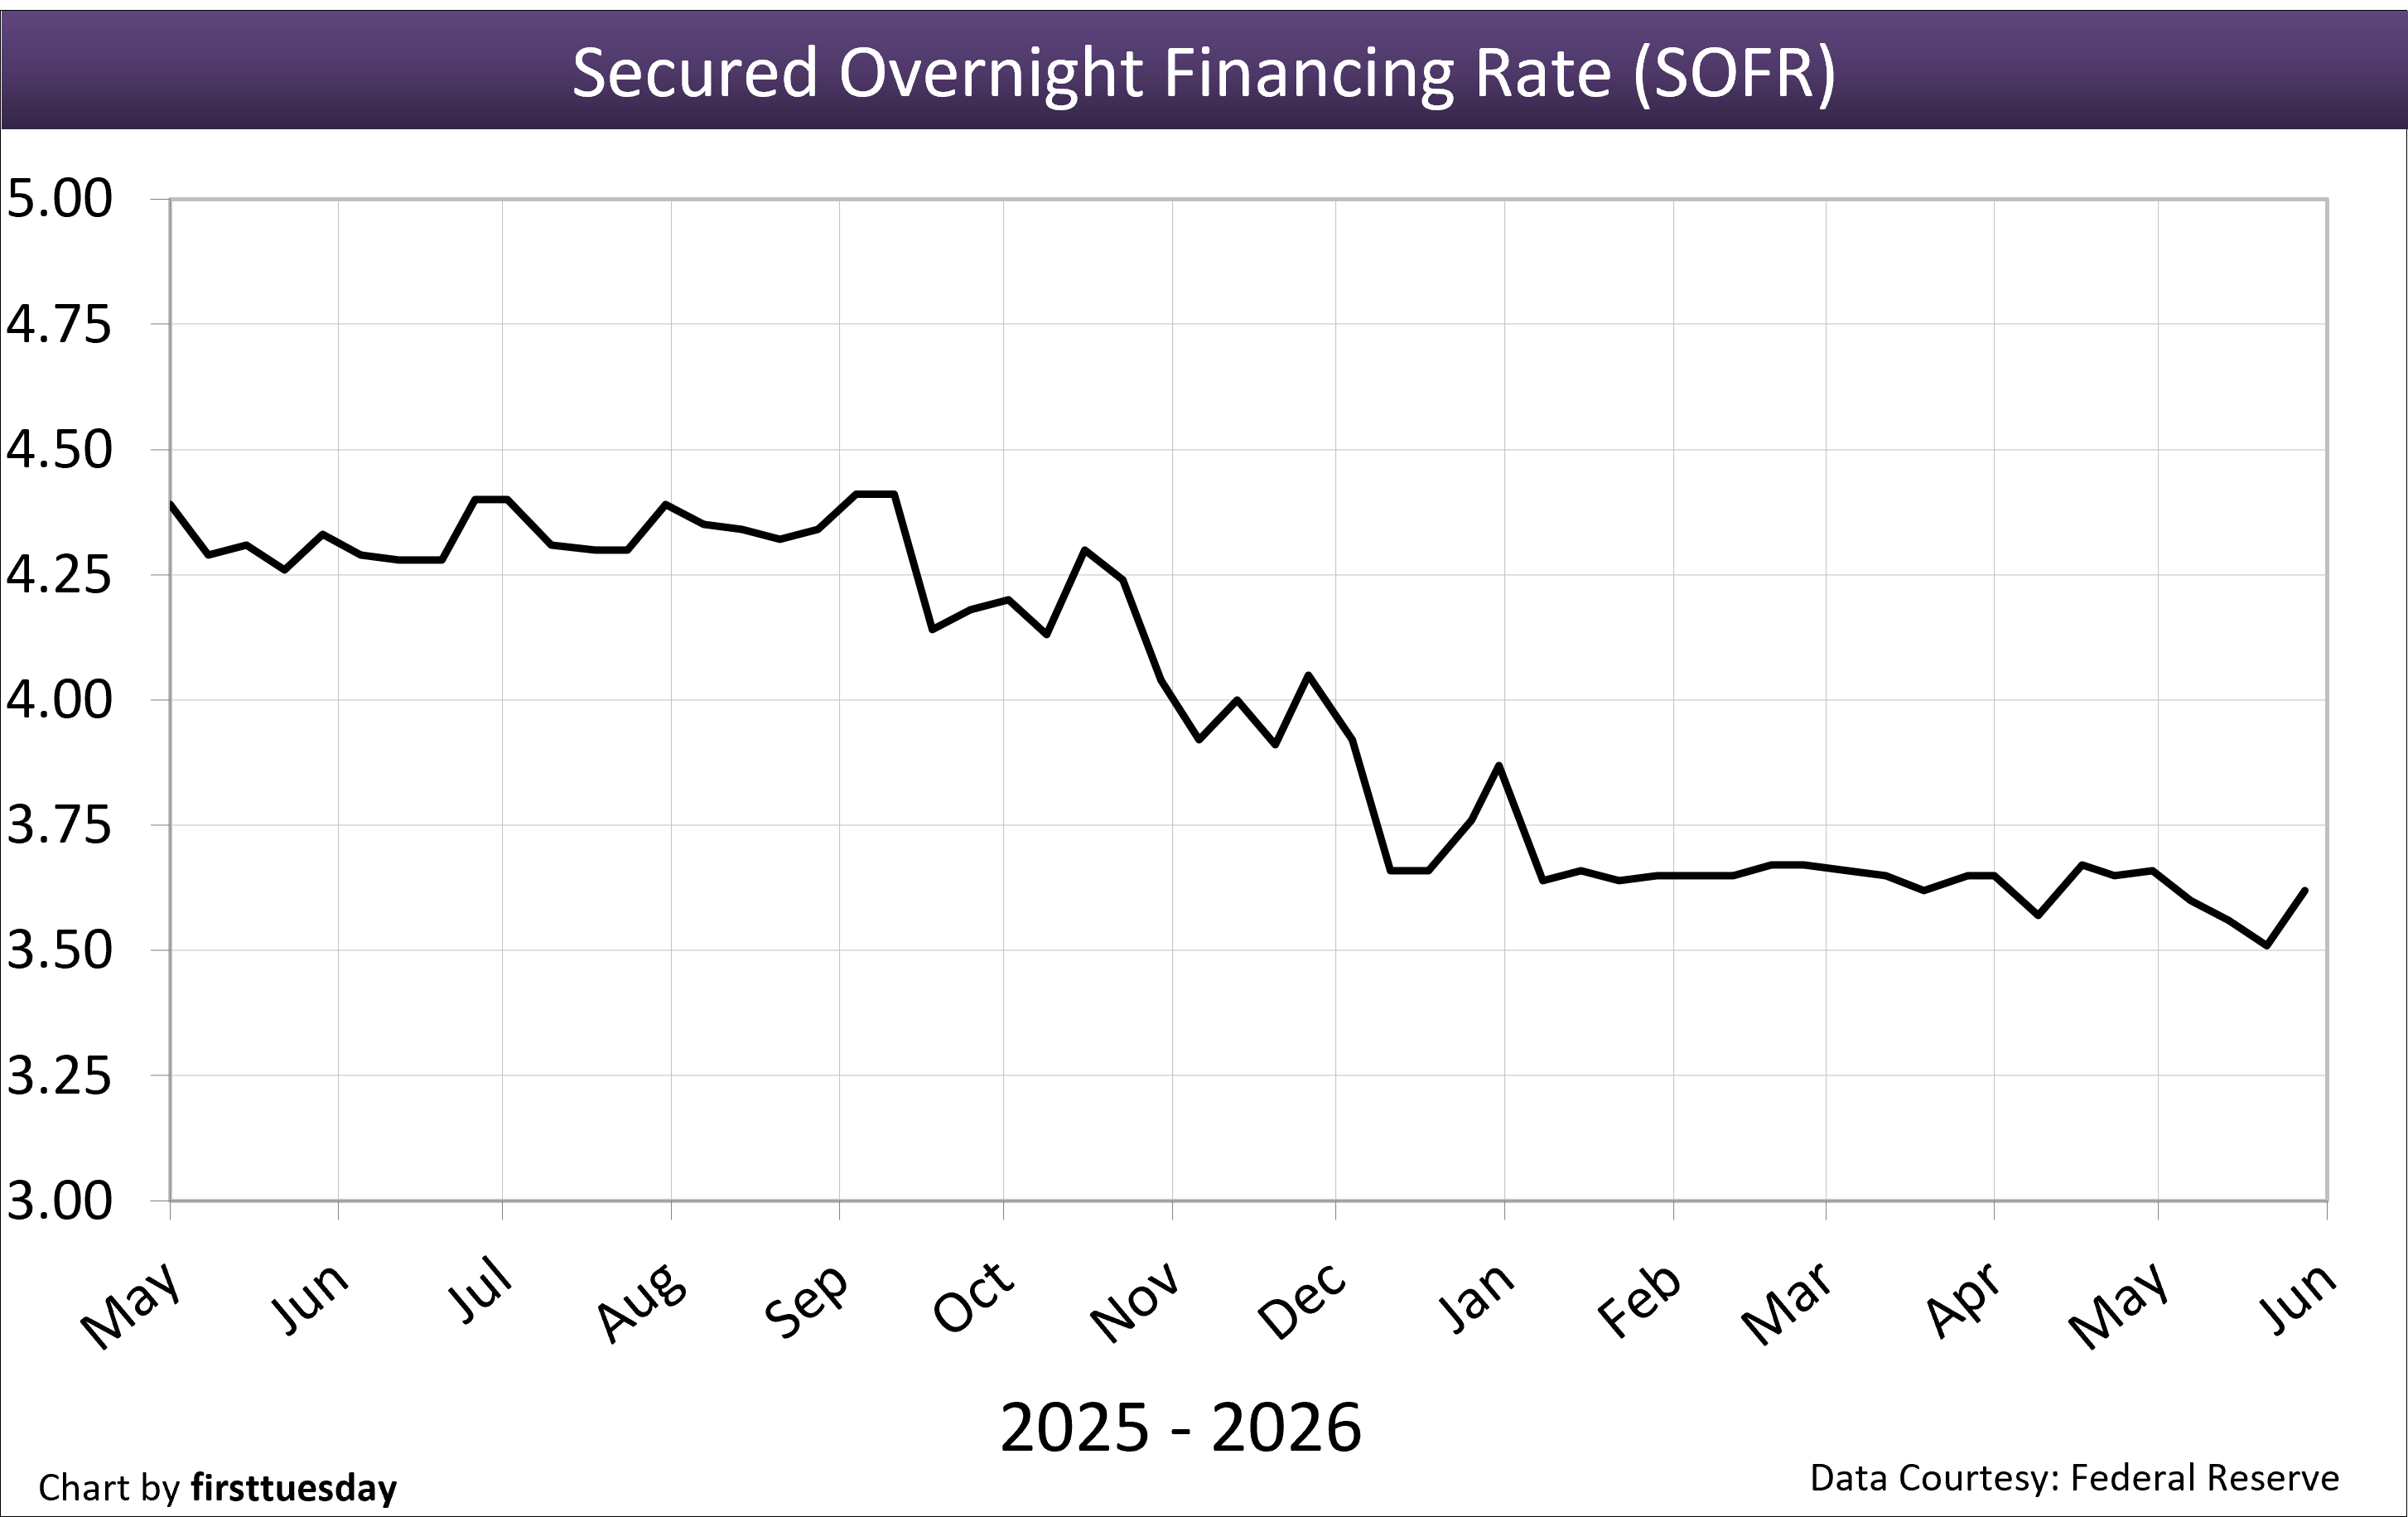
12. Secured Overnight Financing Rate (SOFR) — Chart update 5/29/2026
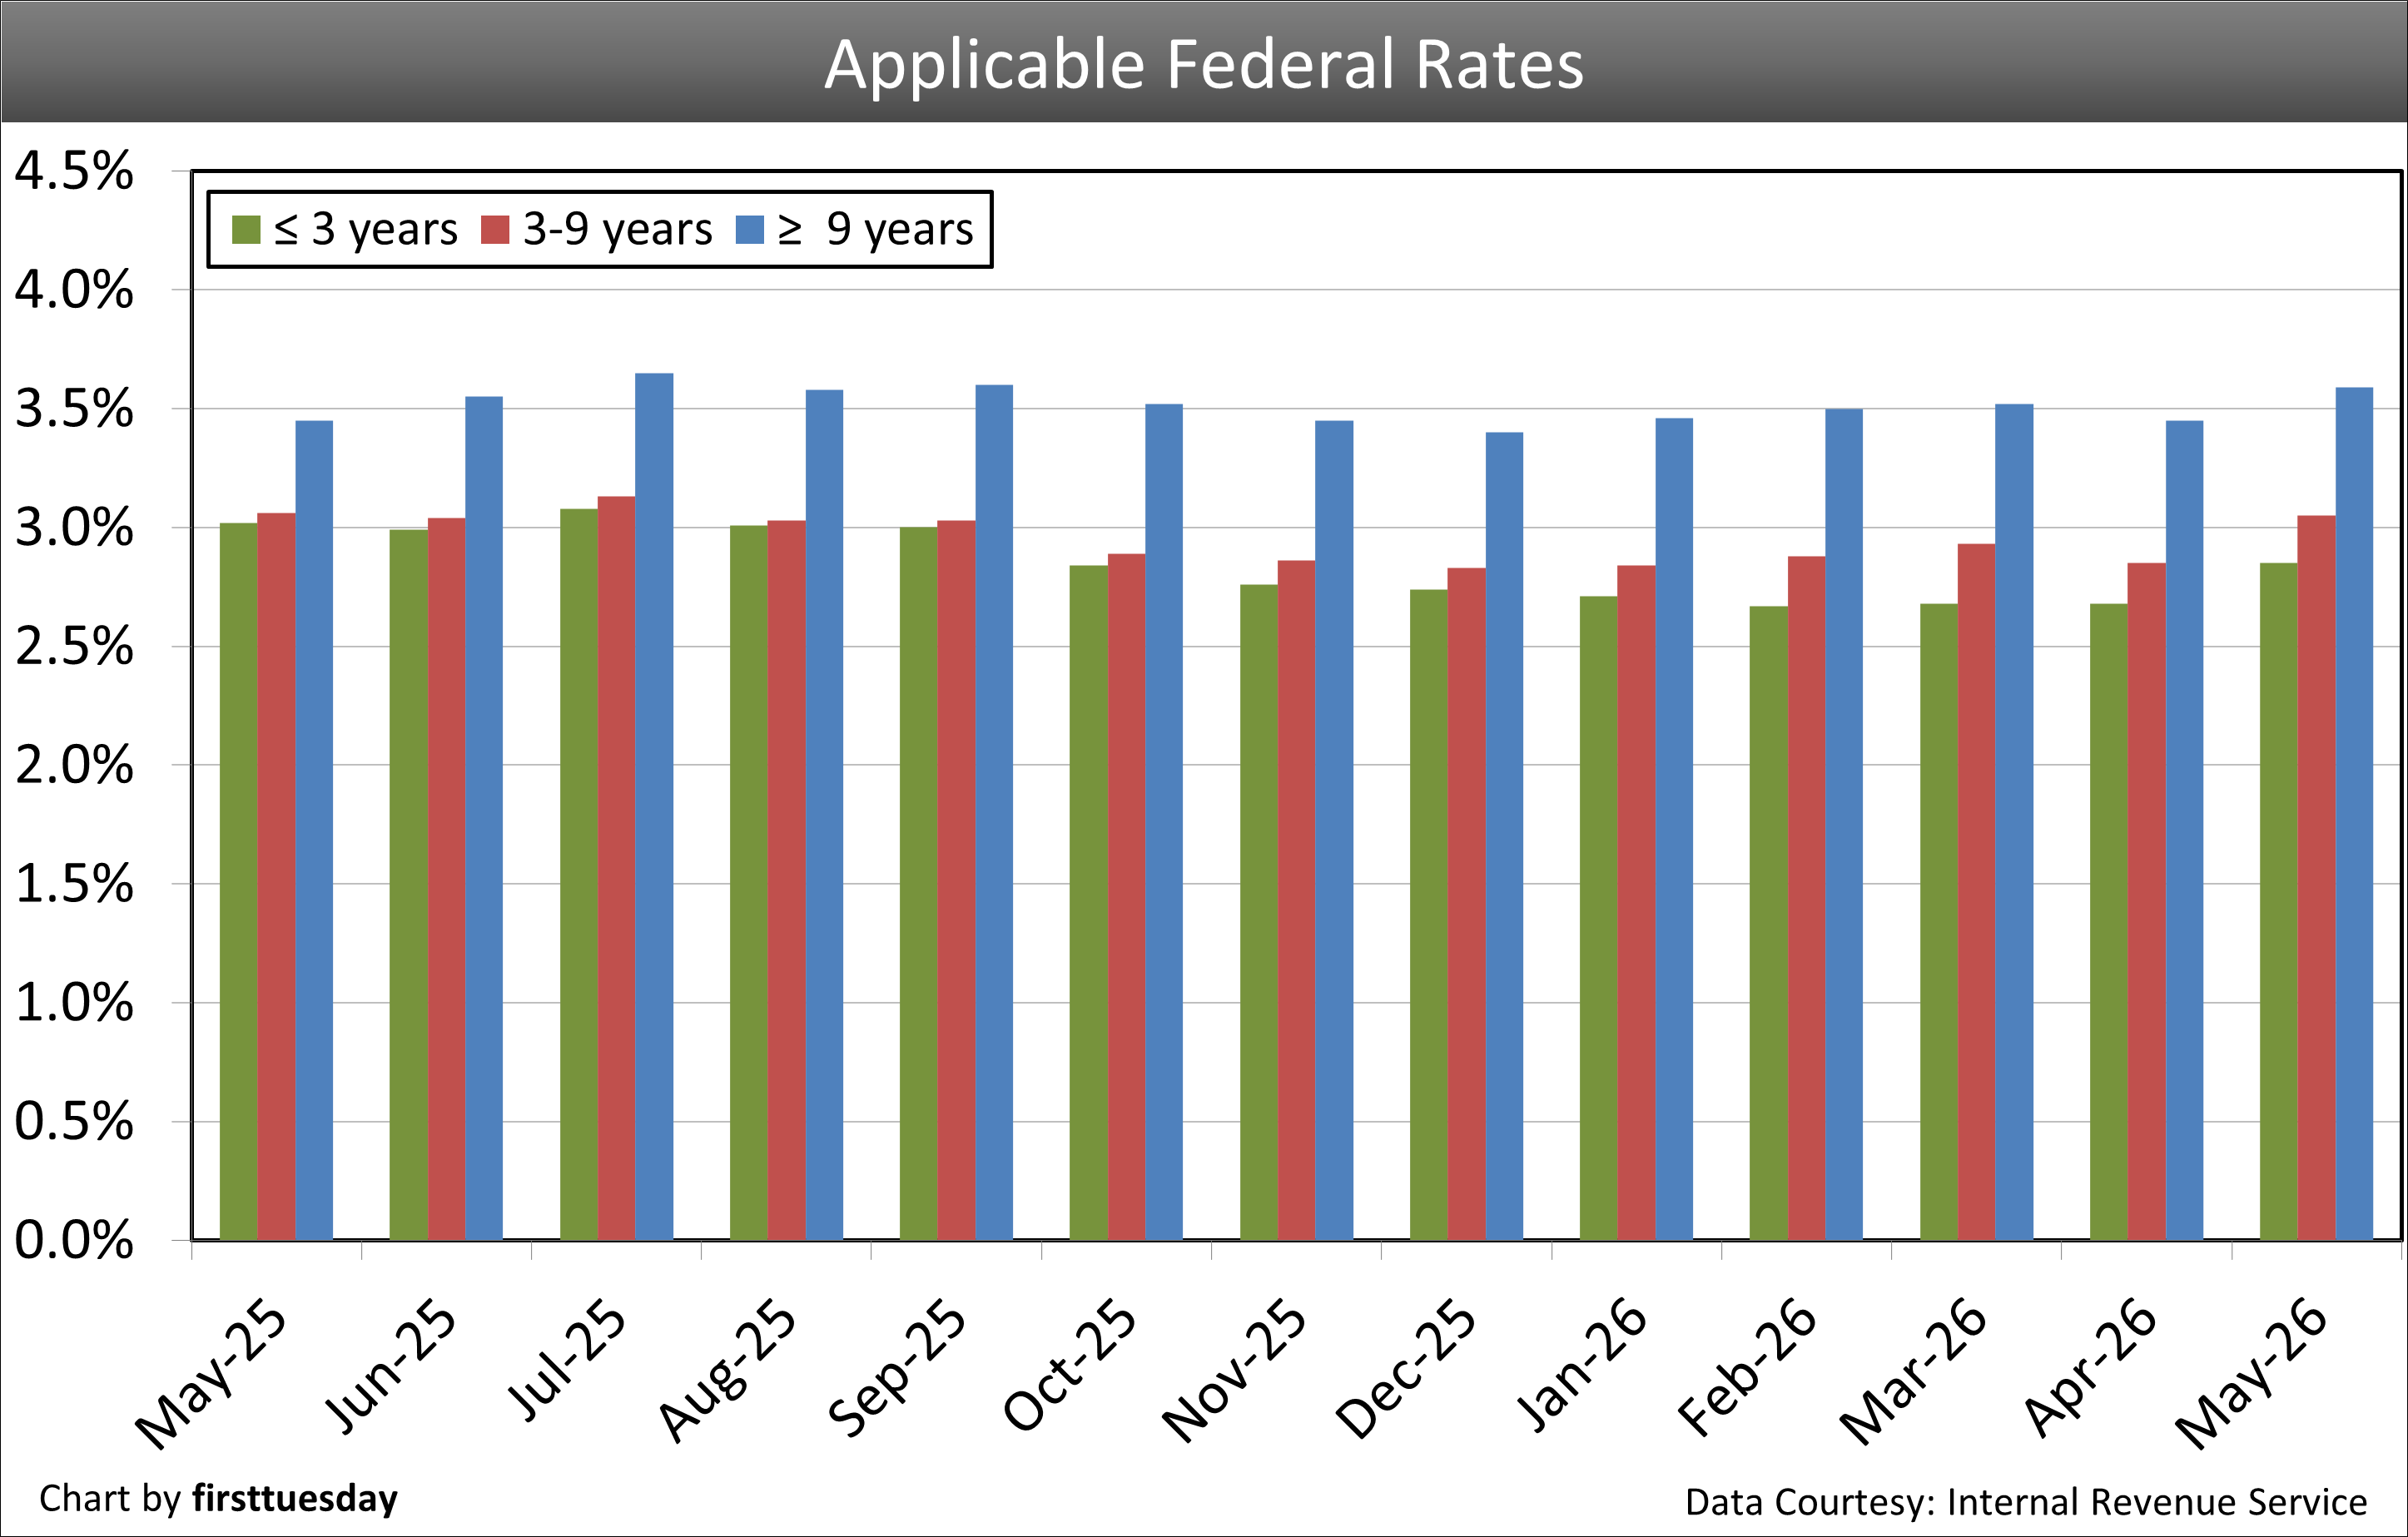
13. Applicable federal rates — Chart update 5/8/2026











Leave a comment