
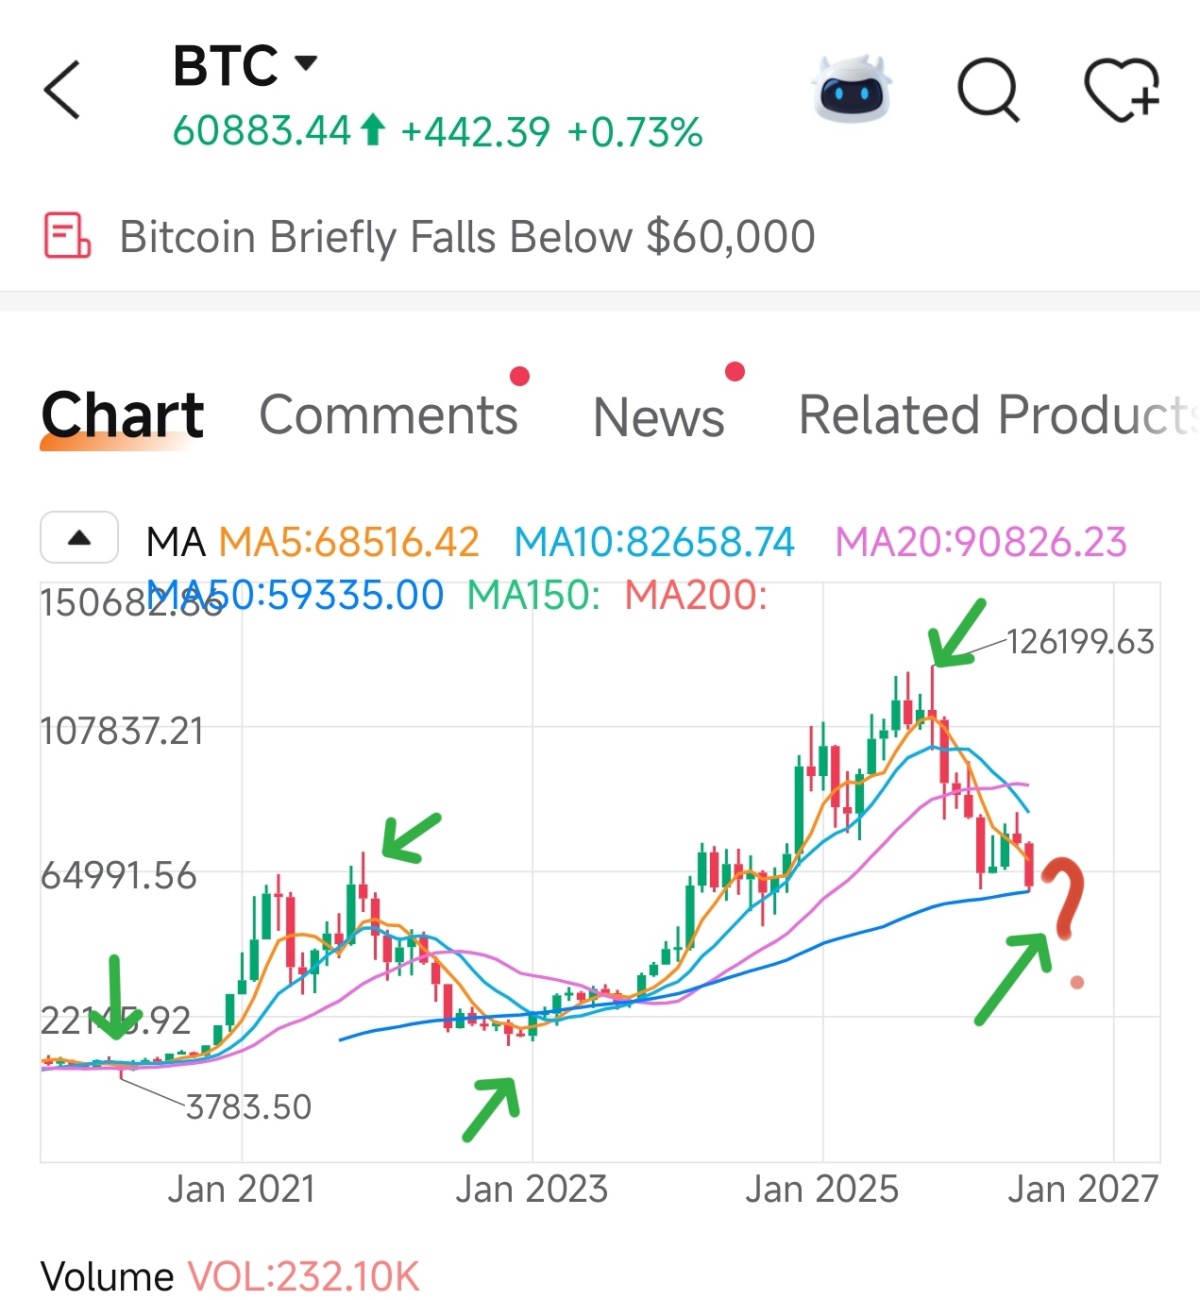
The chart maps out Bitcoin’s structural macro movements, highlighting a clear 4-year halving cycle behavior.
By analyzing the historical patterns established in the previous cycle on this chart, we can project the timeline for the current bottom, the birth of the next cycle, and the potential target for the next peak.
1. Finding the Cycle Bottom and the New Beginning
If we look at the previous cycle shown in the chart:
Previous Cycle Peak: Occurred around late 2021 (indicated by the second green arrow from the left).
Previous Cycle Bottom: The absolute bottom was found roughly 12 to 14 months later, around Jan 2023 (indicated by the third green arrow pointing up at the blue MA50 line).
The Transition: After hitting that Jan 2023 floor, Bitcoin consolidated sideways to upward, officially kicking off the early bull phase of the new cycle into 2024.
The Current Projection:
Current Cycle Peak: The chart shows a prominent peak at $126,199.63 around late 2025 (indicated by the green checkmark).
Predicting the Bottom: Following the ~1-year bear market rule established by the previous cycle, the current correction (where the red question mark sits) is expected to find its macro bottom roughly 12 months after the late 2025 peak. This places the macro bottom around late 2026 (Q4 2026).
The New Cycle Begin: Historically, once the bottom is set, a multi-month accumulation phase begins. The brand new cycle will likely start gaining clear upward momentum in early to mid-2027, ahead of the next major halving era.
2. Predicting the Price of the Next Peak
To estimate the next peak, we look at the law of diminishing returns typical of Bitcoin’s maturing market cap, alongside the historical multipliers shown on the chart.
The Math Behind the Cycles:
The 2021 Peak: Rounded out near $65,000–$69,000.
The 2025 Peak: Reached $126,199.63 (roughly a 1.9x to 2x multiplier from the previous cycle’s high).
Applying a similar, slightly decayed multiplier (between 1.6x and 1.8x) to the 2025 peak of $126,199.63 gives us a realistic target for the next macro bull market peak.
126,199.63 times 1.7x = 214,539
Predicted Next Peak Price: $210,000 to $230,000
Expected Peak Timeline: Following the 4-year rhythm, this next grand peak would be anticipated around late 2029.


Leave a comment