

Despite the Iran war-driven swoon in March, it’s shaping up to be another stellar year for Wall Street and investors. On June 2, the celebrated Dow Jones Industrial Average (^DJI 1.35%), broad-based S&P 500 (^GSPC 2.64%), and innovation-driven Nasdaq Composite (^IXIC 4.18%) all galloped to record closes.
These gains have been fueled by several factors, including:
- The evolution and proliferation of artificial intelligence (AI)
- A historically low corporate income tax rate, which powered record S&P 500 share buybacks in 2025.
- Better-than-expected corporate earnings
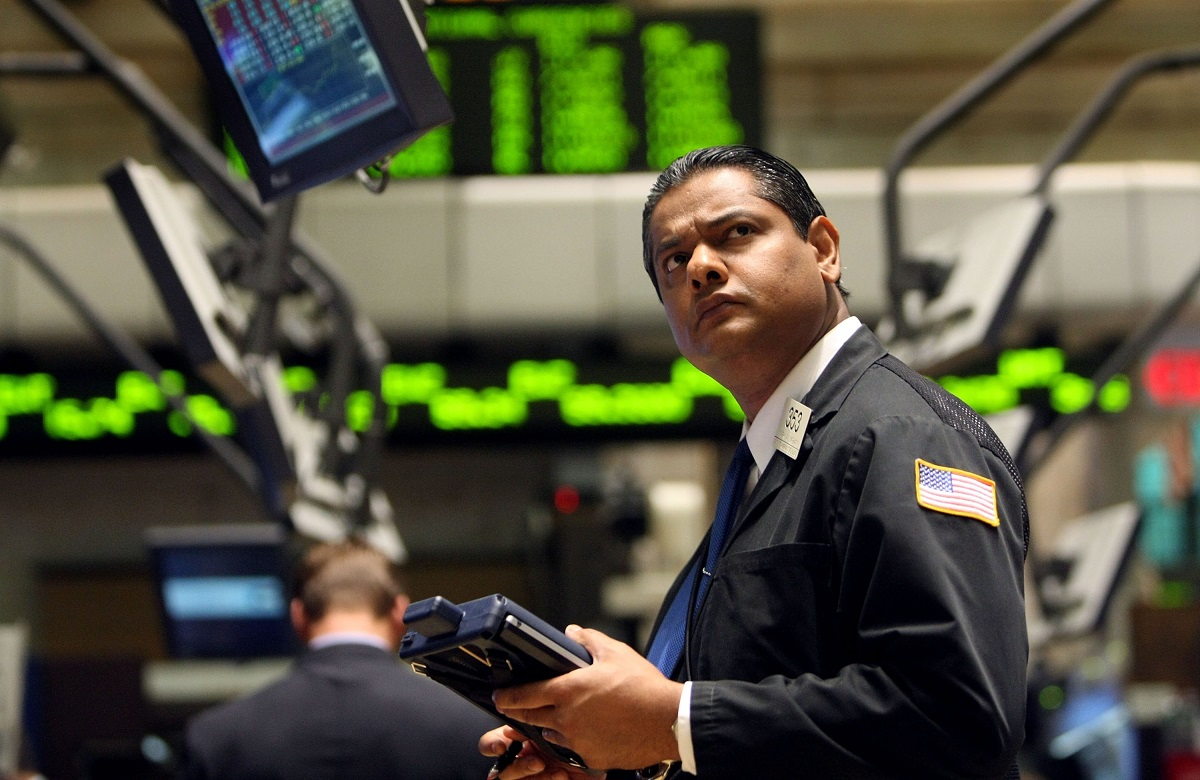
Image source: Getty Images.
But this parabolic move higher for Wall Street may be more precarious than this trio of leading indexes suggests. The stock market is on the verge of making dubious history — the type that hasn’t been witnessed over the last 155 years — and the implications for Wall Street and investors are downright frightening.
The stock market is within eyeshot of its priciest valuation in history
On the heels of the AI revolution, the stock market is nearing its priciest valuation in history.
To preface this discussion, “value” is a subjective term that varies from one investor to the next. Without a one-size-fits-all blueprint to evaluate public companies, one person’s trash can truly be another’s treasure on Wall Street.
With the above said, there is one valuation tool that consistently cuts through the emotional and subjective aspects of investing: the S&P 500’s Shiller Price-to-Earnings (P/E) Ratio. You’ll sometimes see the Shiller P/E referred to as the Cyclically Adjusted P/E Ratio, or CAPE Ratio.
Unlike the traditional P/E ratio, which is based on trailing 12-month earnings per share (EPS), the Shiller P/E accounts for average inflation-adjusted EPS over 10 years. A more encompassing view ensures that the Shiller P/E maintains its usefulness in any economic climate.
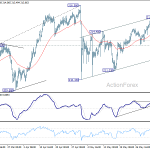
Shiller PE Ratio is now just 3.5% away from passing the Dot Com Bubble as the most expensive stock market valuation in history 🚨🚨🚨 pic.twitter.com/1ceOa3yhfs
— Barchart (@Barchart) June 1, 2026
Although economists introduced the CAPE Ratio in the late 1980s, it’s been back-tested to January 1871, providing 155 years of price-to-EPS data. Whereas the CAPE Ratio has averaged approximately 17.38 since January 1871, the S&P 500’s Shiller P/E closed out the June 2 trading session at 42.84.
To put this figure into context, the Shiller P/E has exceeded 30 during a continuous bull market only six times over 155 years. Narrowing further, it’s surpassed 40 on just three occasions. June 2 marked the highest Shiller P/E Ratio of the current bull market and the second-priciest reading, trailing only the all-time high of 44.19, set in December 1999, just months before the bursting of the dot-com bubble.
History shows that Shiller P/E Ratios above 30 are no laughing matter for Wall Street. While this time-tested valuation tool offers no help in determining when the music will stop, it’s consistently foreshadowed several harrowing stock market declines.
Excluding the present, the previous five times the CAPE Ratio exceeded 30 were eventually followed by declines of 20% to 89% in the Dow Jones Industrial Average, S&P 500, and/or Nasdaq Composite. In other words, history suggests that the clock is already ticking on this historic rally — and when the buzzer sounds, things could get ugly for Wall Street.

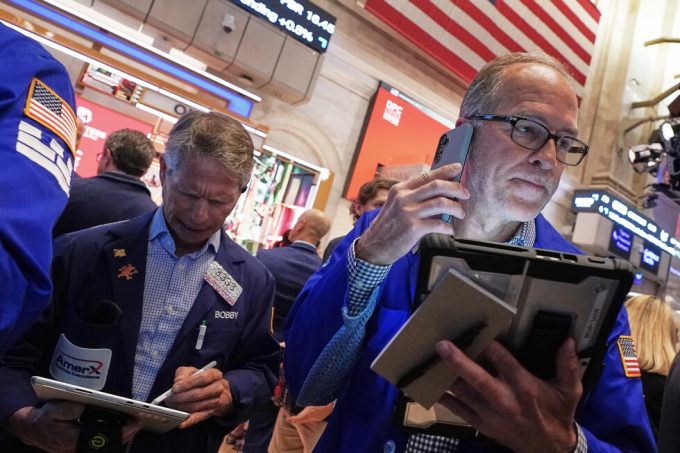
Image source: Getty Images.
History offers a silver lining, too
In one respect, history clearly points to trouble for the stock market. While game-changing trends are known to lift valuations and encourage risk-taking, there’s a limit as to how long premium stock valuations can persist.
The good news for investors is that historical precedent swings both ways and has traditionally favored long-term-minded investors.
Eventually, a steep correction or bear market will occur. No amount of well-wishing or fiscal/monetary policy maneuvering can stop corrections, bear markets, or the occasional crash from taking shape. But what’s important to note is the milewide disparity between bull and bear markets.
Recently, researchers at Bespoke Investment Group compared the performance of every S&P 500 bull and bear market, dating back to the start of the Great Depression in September 1929. Bespoke uncovered a very lopsided long-term story.
The current bull market that began on 10/12/22 is now the 9th longest in S&P 500 history, surpassing the 1,324-day bull that ended on 2/9/1966: pic.twitter.com/4mGsS2t2ft
— Bespoke (@bespokeinvest) May 30, 2026
On the one hand, the average of 27 S&P 500 bear markets over the last 97 years has lasted just 286 calendar days, or approximately 9.5 months. What’s more, no bear market downturn has endured longer than 630 calendar days.
At the other end, the average S&P 500 bull market has endured for 1,023 calendar days (nearly two years and 10 months). Furthermore, 10 of these 27 bull markets have lasted a minimum of 1,324 calendar days, which is more than double the lengthiest bear market since the Great Depression.
While the short-term outlook for the stock market appears bleak, given the S&P 500’s historically unsustainable valuation, the long-term outlook for equities is as bright as ever. If your time horizon is five or more years, stock market corrections and bear markets are nothing more than shopping events. But if you’re a short-term trader, the time-tested Shiller P/E Ratio offers a downright frightening forecast.


Leave a comment