


The S&P 500 broke out of its summer range this week to yet another record high. The index closed at 7,757.64 on Friday, clearing the 7,500 level it had circled since May 14. The index is 3.5% above its 50-day moving average and 9.8% above its 200-day moving average. Those are not extreme readings.
The breakout is a good moment to ask where this bull market fits in the historical record. The answer is that it’s in the middle. That is a more bullish finding than it sounds. Bull markets do not die of old age or of accumulated gains. They usually die when earnings roll over.
The current bull market has been compared to the dot-com era’s meltup/meltdown scenario. If the late 1990s ended with a stock-market meltup, will the late 2020s do the same? Back then, it was a FOMO-driven meltup; everyone feared being left out. This time, FEMO, or fabulous earnings momentum, is the driving force.
Here’s more:
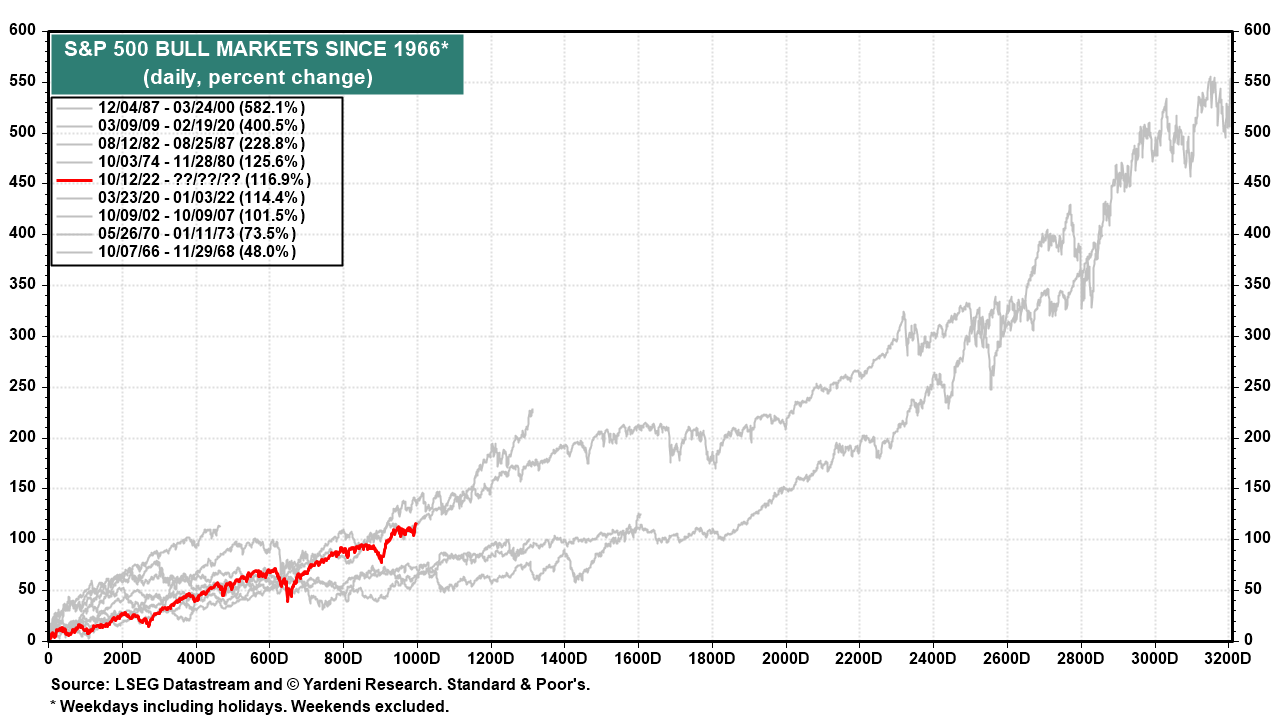
(1) History. In the current bull market, the S&P 500 is up 116.9% since it began on October 12, 2022 (chart). That ranks fifth of the eight bull markets since 1966. Investors who believe this market has run too far should look at what running too far can actually look like.
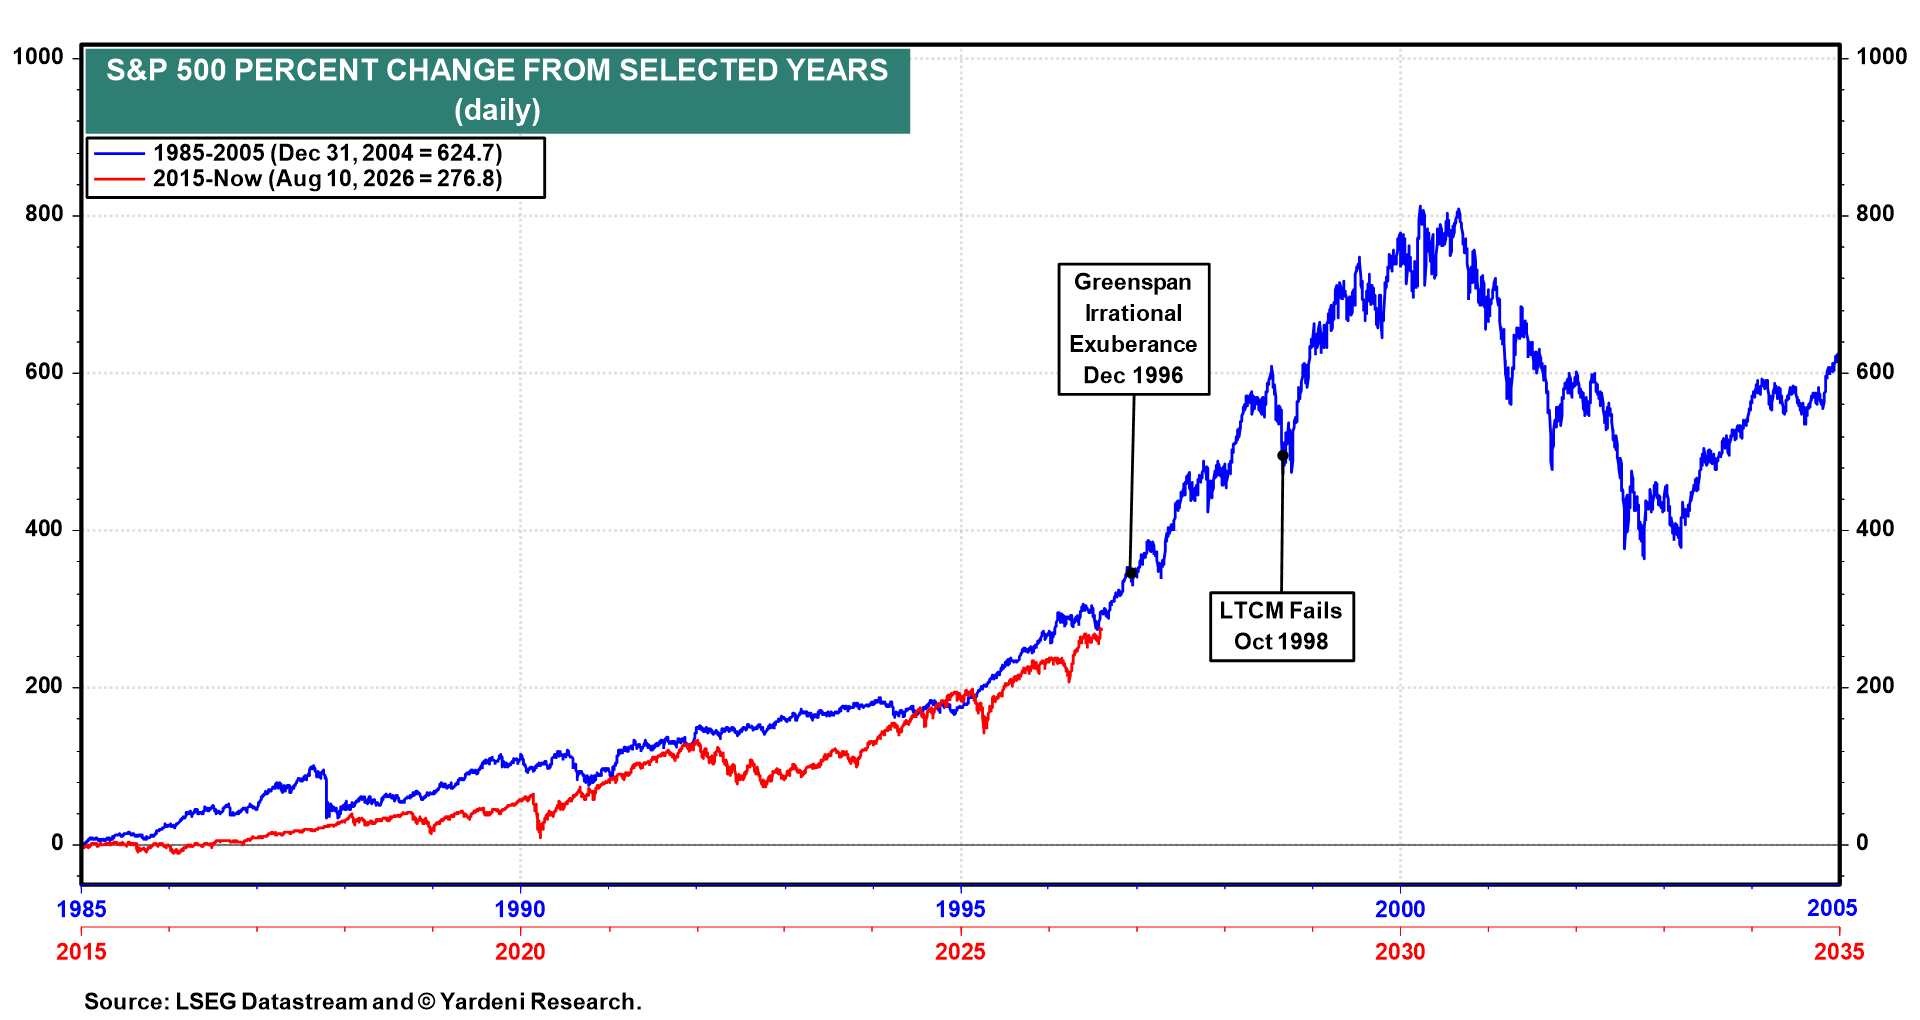
Overlay the current period starting in 2015 on 1985-2005, and the two paths track each other closely, with the current run at 276.8% since 2015 (chart). If the analog continues to hold, the market keeps climbing, and the interesting years are ahead rather than behind.
That brings us to the meltup question. Valuation multiples are higher today than they were heading into the Tech Wreck of the late 1990s (chart). So a meltup from here would more likely be an earnings-led meltup than a valuation-led meltup. It would be a FEMO one rather than a FOMO one.











Leave a comment