
Key Takeaways
- Bitcoin Cash is struggling to break above key resistance near $480.
- Indicators show weakening bullish pressure despite short-term recovery.
- A breakout could push BCH toward $510, but a failure could trigger a pullback.
Bitcoin Cash (BCH) recently approached $47 for a retest. But close was not enough.
The retrace that has followed is now the dominant short-term story for BCH — one that is raising questions the latest push had briefly pushed aside.
Can the Bitcoin Cash coin recover and breach the crucial resistance level?
Bitcoin Cash Wobbles Around the Same Zone
BCH is attempting a fresh breakout after a sharp rally into the $470 region, but momentum is already cooling as price pulls back toward $455.
Price structure shows a clear range between roughly $420 support and $480 resistance. The latest move tapped the upper boundary again, then stalled.
That implies that sellers are active and still defending that zone.
Momentum initially supported the breakout attempt on the 4-hour chart. The Awesome Oscillator (AO) flipped strongly positive, confirming bullish expansion.
However, the latest bars are fading. The upside attempt is slowing, not accelerating. That’s usually the first crack in a rally.
The Relative Strength Index (RSI) sits near 59, below overbought territory.
Bulls have room, but not dominance. RSI is flattening after a spike, signaling weakening buying pressure rather than continuation of strength.
Price action further reinforces this hesitation. After the impulsive push upward, candles are now smaller with wicks on both sides.
That reflects indecision as buyers pushed hard, but couldn’t hold the highs. By the look of things, the Bitcoin Cash coin is on the verge of sliding below the middle line of the ascending parallel channel.
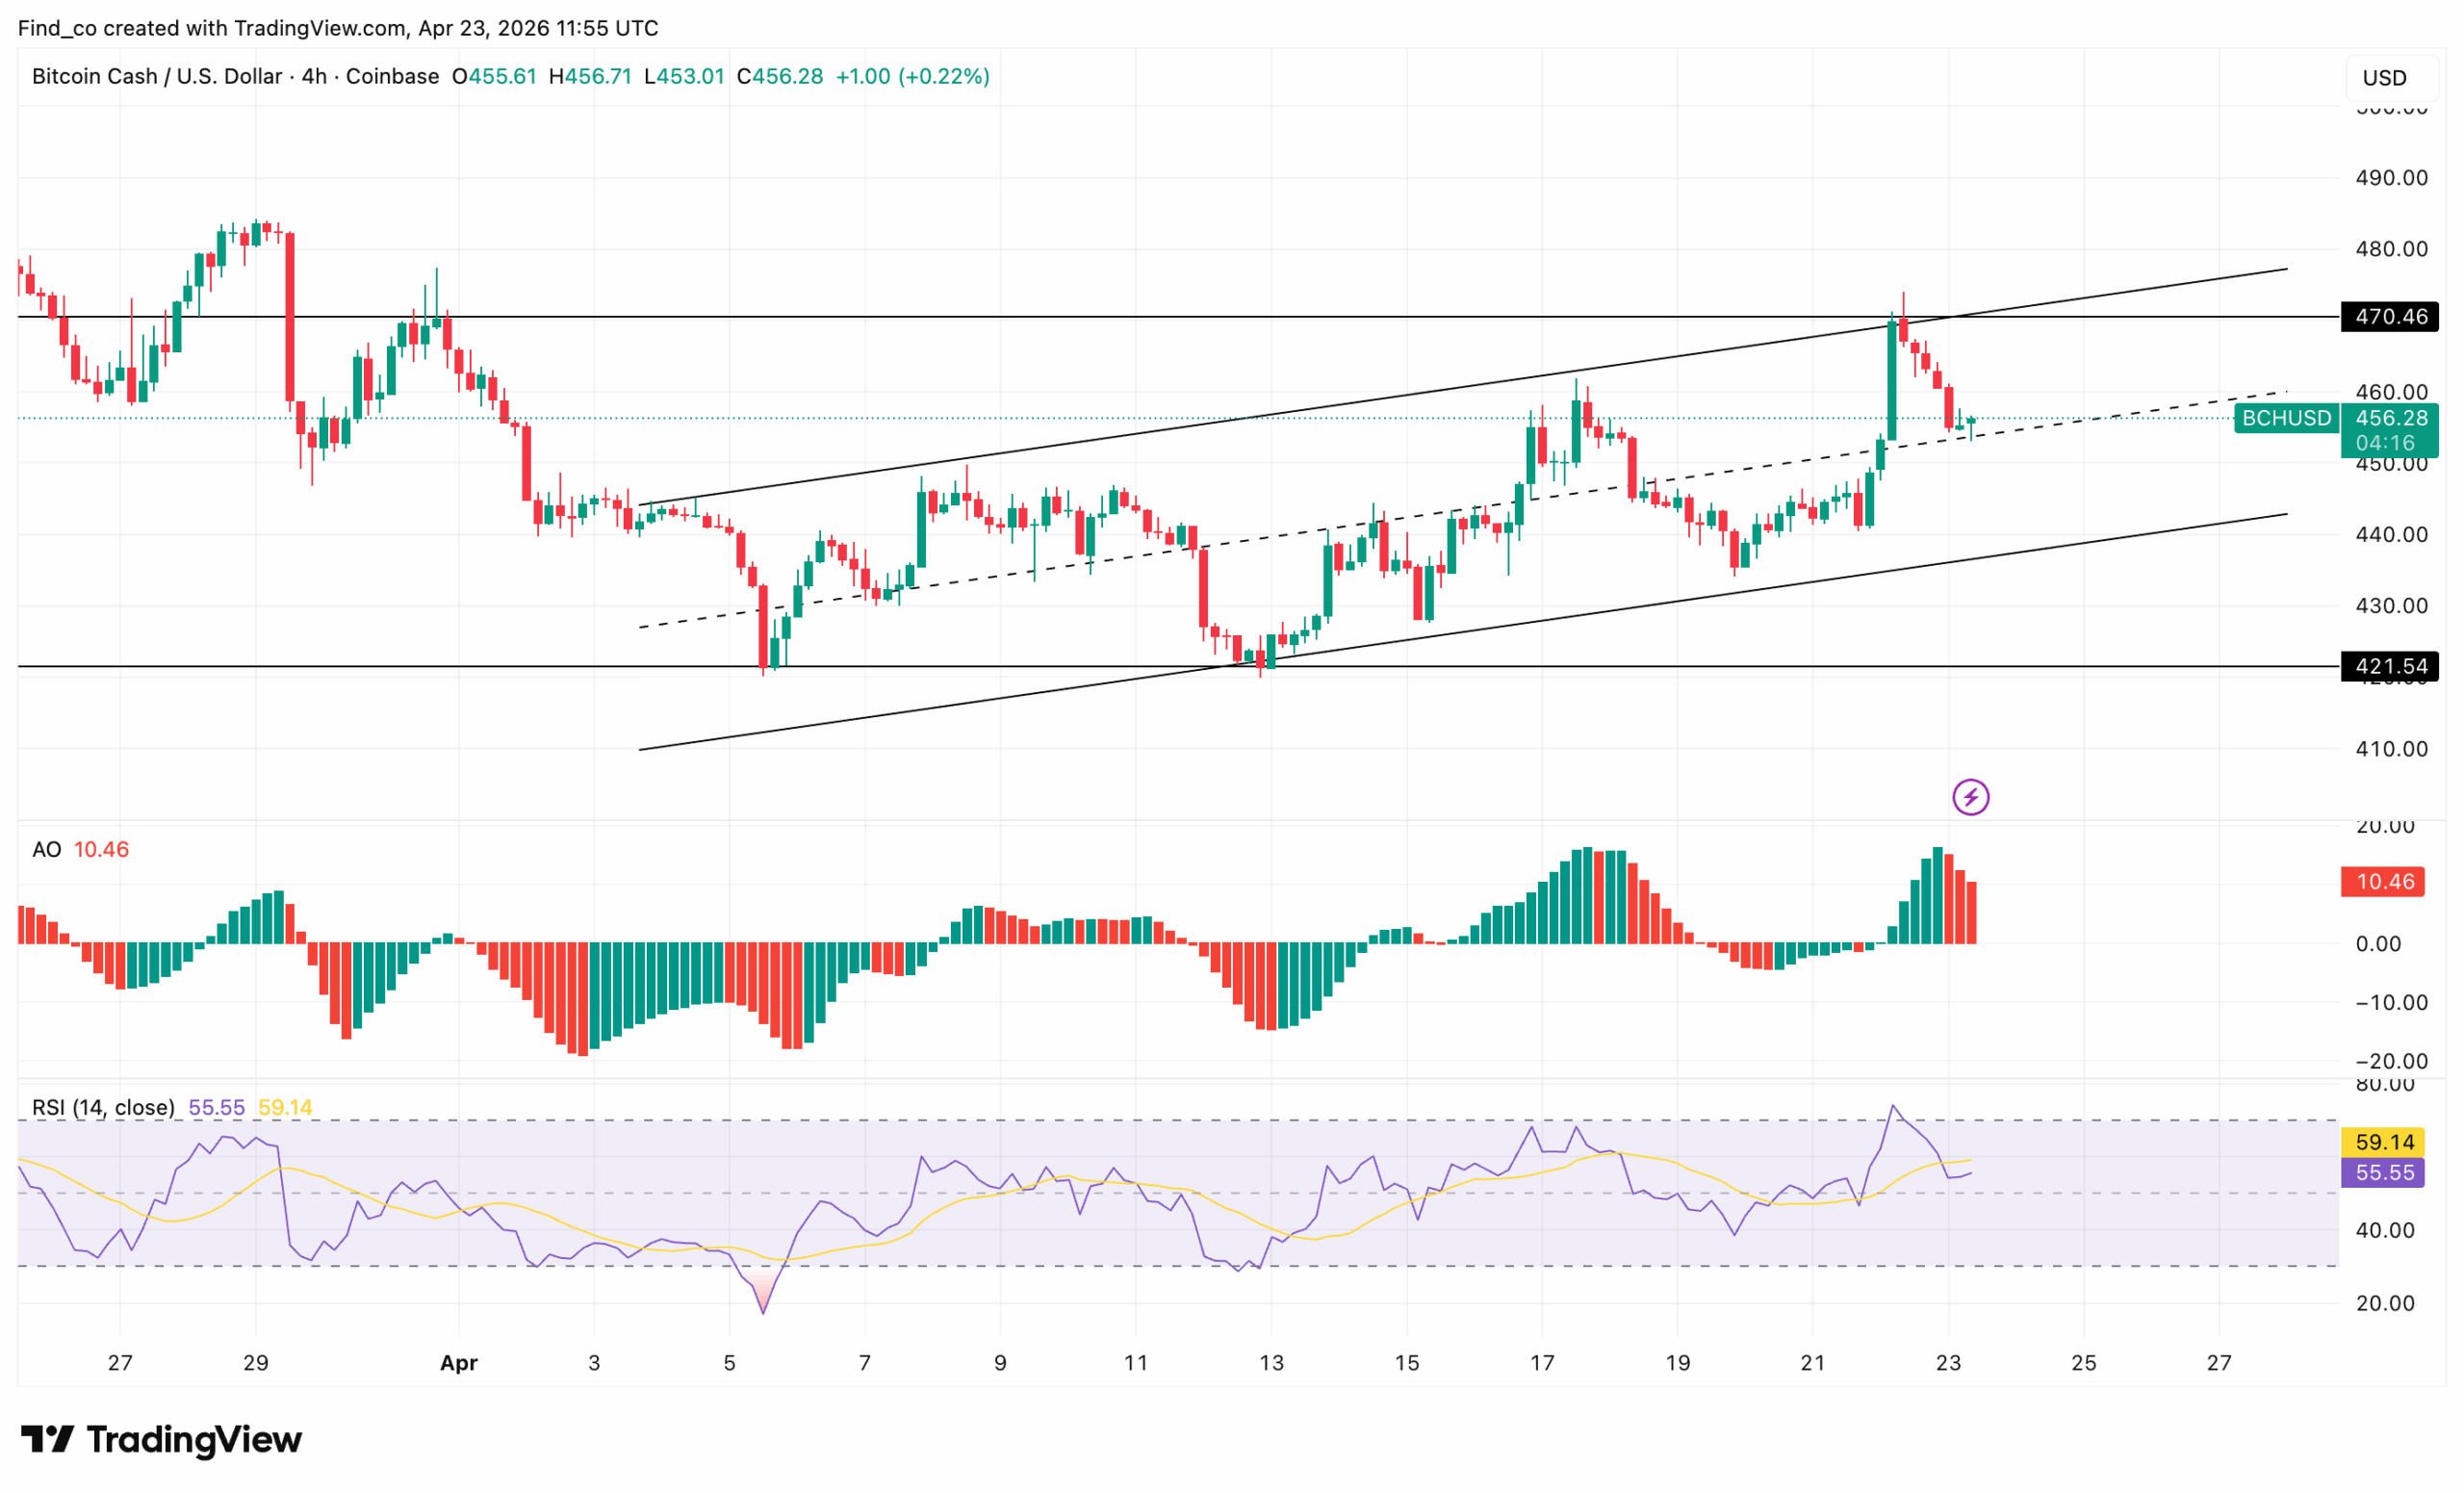
If bulls fail to quickly reclaim $470, this move risks turning into another rejection within the broader range.
What On-Chain Data Shows
In the meantime, the BCH’s 30-day MVRV ratio has remained below zero, indicating that, on average, recent holders have been sitting in a loss.
That usually means the market is in a weaker phase, with less incentive for short-term holders to sell aggressively into strength.
Recently, the Bitcoin Cash coin price has been stabilizing while MVRV has been recovering from deeper negative readings.
This has been suggesting that short-term holder stress was easing.
However, MVRV is still negative, so the signal has not fully turned bullish yet.
That means while BCH’s price has been recovering, the market has not yet shifted into a strong profit regime where momentum usually expands faster.
Thus, if the 30-day MVRV keeps rising toward and above 0%, BCH could continue to recover, and the price could first push toward the $510 area.
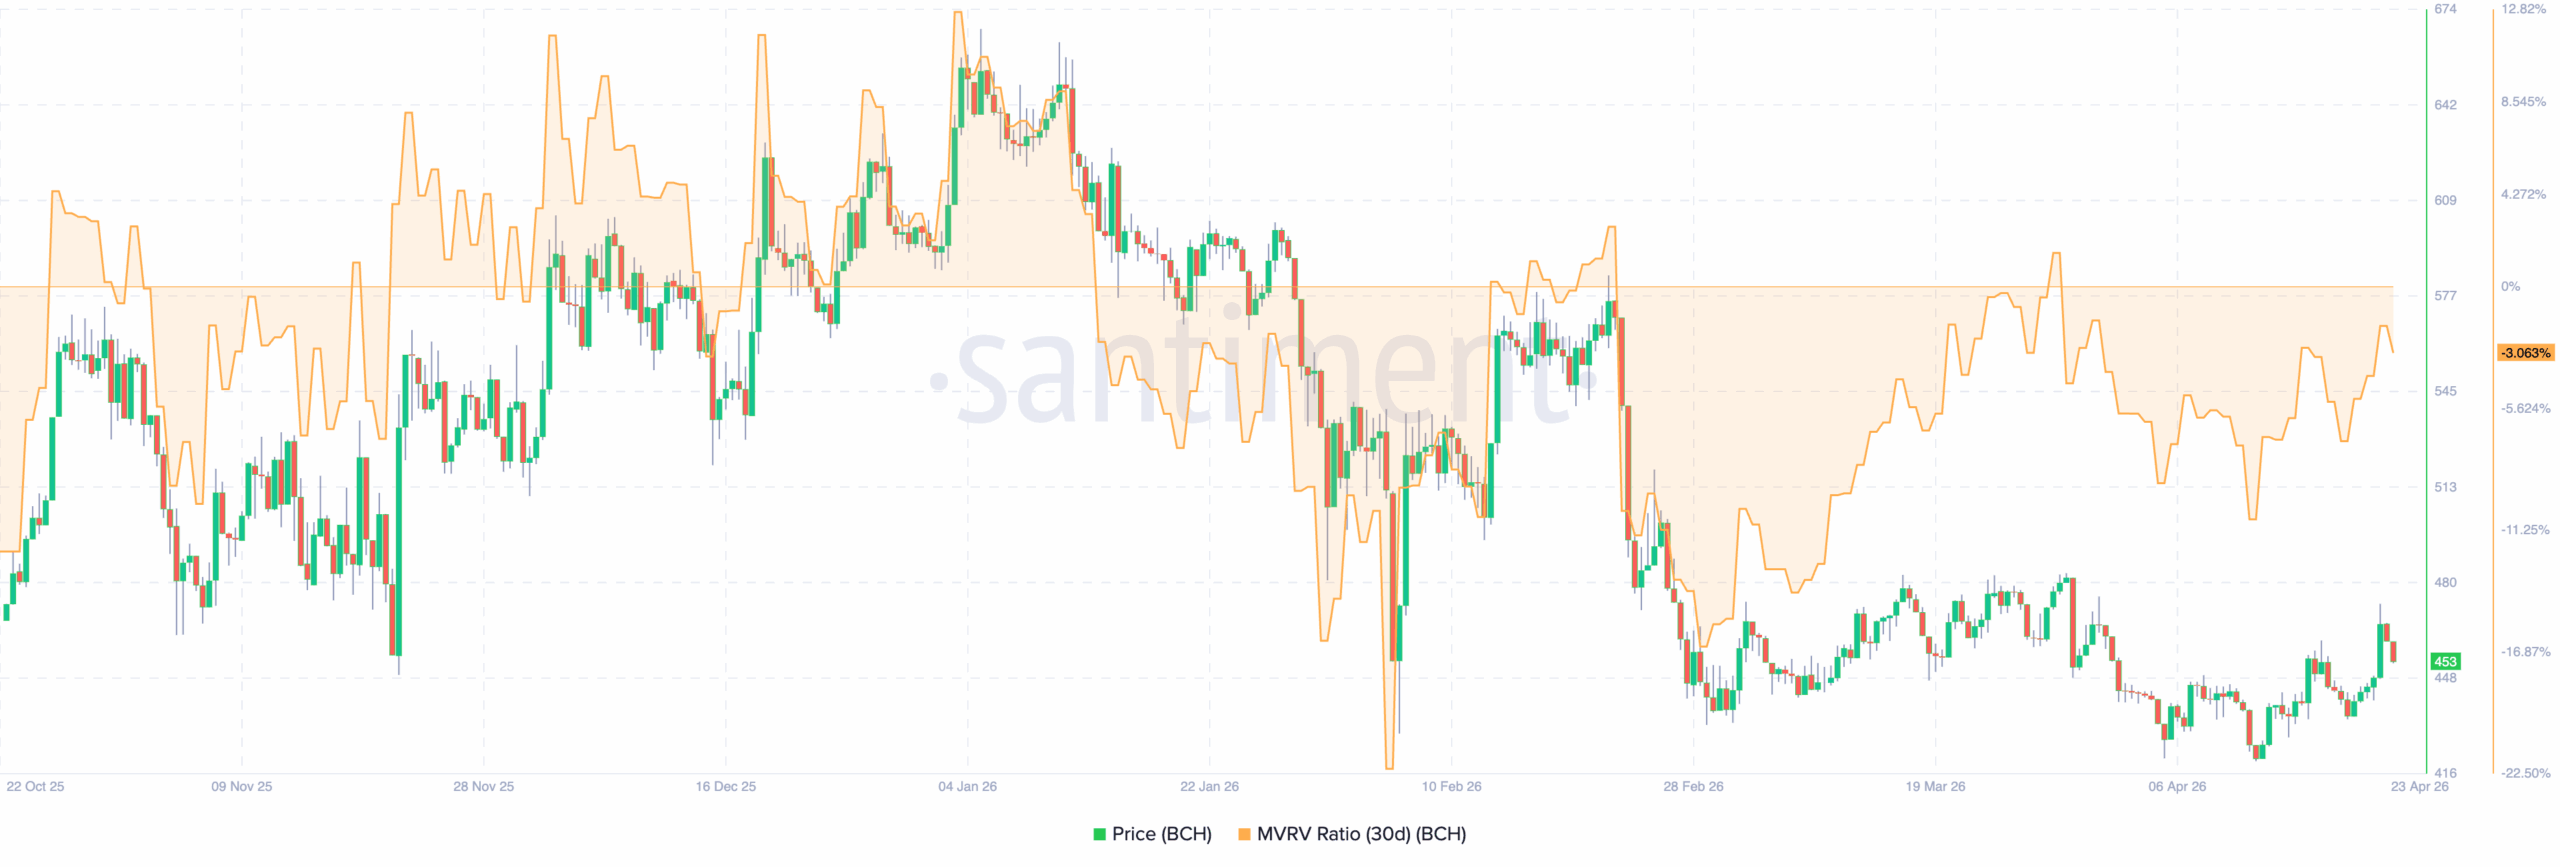
But if the metric starts falling again from here, it would suggest renewed weakness, and the price could drift back toward $430.
BCH Price Outlook: Bearish Setup Not Invalidated
The broader structure remains bearish on the daily chart. BCH’s price continues to trade below a descending trendline that has guided lower highs since the $680 peak.
Multiple Fibonacci retracement levels now act as overhead resistance, reinforcing the pressure on bulls.
The recent bounce off $418 is constructive, but not convincing yet.
Furthermore, the Bitcoin Cash coin price is still trapped below the 0.236 Fib level around $481, which now serves as the first major resistance barrier.
Bulls attempted recovery earlier near the 0.5 Fib level at $552 and the 0.618 Fib level at $584 but failed.
That sequence of rejections confirms a classic downtrend structure, lower highs, repeated breakdowns, and weak follow-through on rallies.
Meanwhile, the Bull Bear Power (BBP) has flipped positive, suggesting buyers are regaining short-term control.
Similarly, the Money Flow Index (MFI) sits near 60, indicating steady capital inflow, but not yet overheated conditions.
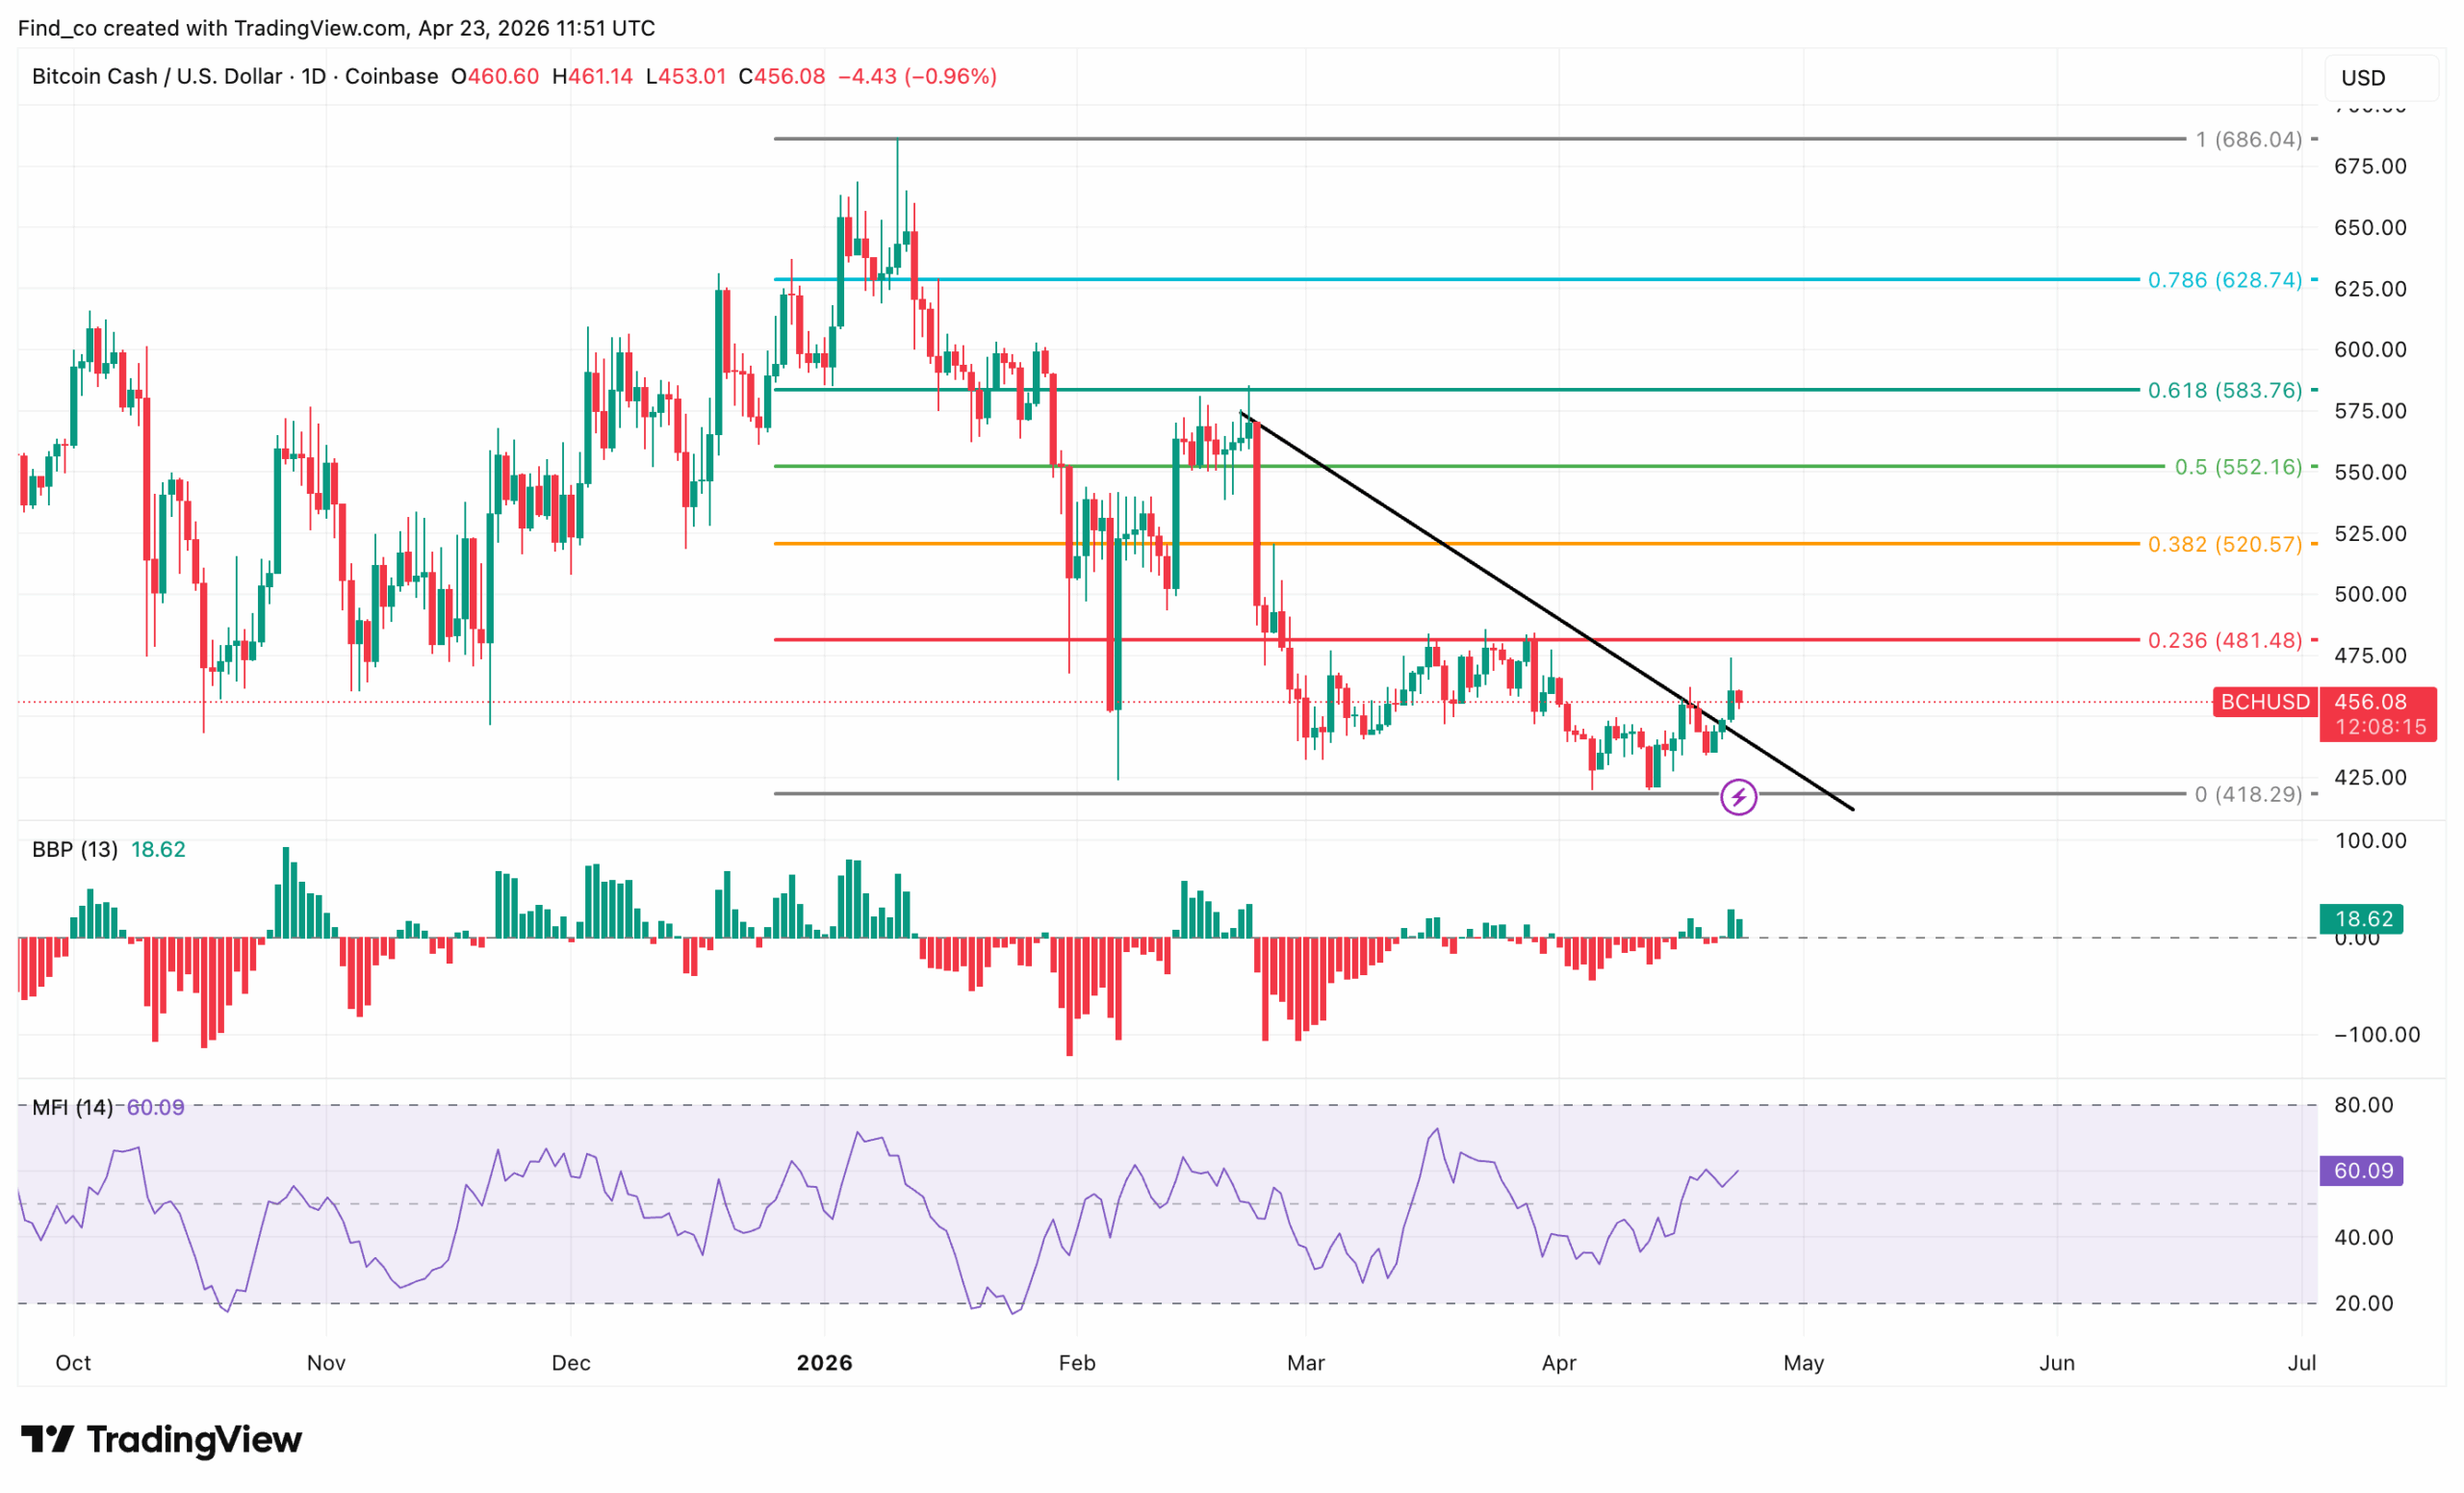
Still, the bigger picture matters. The descending trendline remains intact, and the price is respecting it.
Until that breaks, this recovery looks more like a relief bounce than a reversal.
The information provided in this article is for informational purposes only. It is not intended to be, nor should it be construed as, financial advice. We do not make any warranties regarding the completeness, reliability, or accuracy of this information. All investments involve risk, and past performance does not guarantee future results. We recommend consulting a financial advisor before making any investment decisions.

Victor Olanrewaju is a crypto analyst and reporter at CCN with deep roots in on-chain research and technical analysis. His crypto journey began in 2017, but it was the 2020 Uniswap airdrop that sparked a full-time pivot into the space.
With a foundation in copywriting, Victor honed his craft creating high-converting content for leading crypto brokers — most notably an XRP price prediction that ranked #1 on Google during the 2021 bull run.
He later joined AMBCrypto in 2022, where he combined storytelling with technical and on-chain analysis to cover key market narratives.
In 2024, he expanded his expertise at BeInCrypto, collaborating with analysts and using tools like Glassnode, Santiment, and IntoTheBlock to break down Bitcoin and altcoin trends.
At CCN, Victor covers the top cryptocurrencies, memecoins, macro shifts, blending real-time insights with deep-dive metrics.
He holds a Bachelor’s degree in Physics from the University of Ibadan, equipping him to simplify complex data for a wide audience. Follow his work or connect on LinkedIn or X.


Leave a comment