

British Pound Technical Forecast: GBP/USD Weekly Trade Levels
- GBP/USD has nearly erased the latest decline after rebounding sharply from key support at the yearly low.
- The recovery is once again approaching the same resistance zone that rejected Sterling last month – the near-term advance remains vulnerable while below.
- A sustained breakout would invalidate the recent downtrend and strengthen the case for a larger trend reversal while failure would keep the broader range intact.
- U.S. inflation data next week could provide the catalyst for the next major move in Sterling.
- Resistance 1.3460/74 (key), 1.3591, 1.3648/85- Support 1.3326, 1.3194/99 (key), 1.3092
The battle for control of GBP/USD is shifting back to a familiar battleground. After recovering sharply from support at the yearly lows, Sterling is once again confronting the yearly open and a major Fibonacci resistance zone that rejected price just weeks ago. The coming sessions should help determine whether buyers can finally force a meaningful breakout or if this latest recovery proves to be another counter-trend rally within the broader range. With U.S. inflation data looming next week, the macro backdrop may provide the catalyst for the next major move. Battle lines drawn on the GBP/USD weekly technical chart.
Review my latest Weekly Strategy Webinar for an in-depth breakdown of this Sterling setup and more. Join live on Monday’s at 8:30am EST.
British Pound Price Chart – GBP/USD Weekly
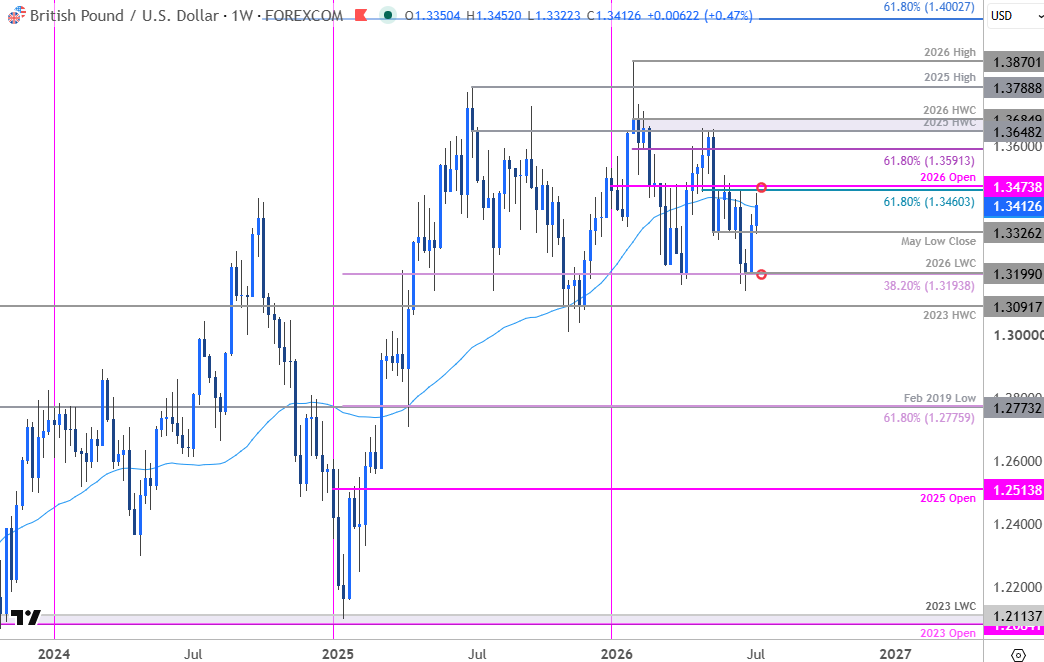
Chart Prepared by Michael Boutros, Sr. Technical Strategist; GBP/USD on TradingView
Technical Outlook: In last month’s British Pound Weekly Forecast we noted that the Sterling recovery had stretched into pivotal resistance at the 2026 yearly open, “and marks the first test for the bulls.” GBP/USD reversed sharply off resistance later that week with the decline extending more than 2.5% off the June highs. Price rebounded into the close of the month off lateral support at the 38.2% retracement of the 2025 advance with a two-week rally nearly erasing the entire decline. Sterling is once again trading into pivotal resistance at the 61.8% retracement of the May decline and the objective yearly open at 1.3460/73. The focus is on possible inflection off this threshold with the multi-week advance vulnerable while below.
Initial weekly support rests with the May low close at 1.3326 and is backed by the 38.2% retracement and the 2026 low-week close (LWC) at 1.3194/99. Note that a break / weekly close below this threshold would constitute a breakout of the yearly opening range and threaten the next major leg of the decline. Subsequent support rests with the 2026 high-week close (HWC) at 1.3092.
A breach / weekly close above this key pivot zone would invalidate the May downtrend and fuel a larger recovery within the yearly range. The next technical considerations beyond this level are eyed with the 61.8% retracement of the yearly range at 1.3591 and the 2025 & 2026 high week closes (HWC) at 1.3648/84– look for a larger reaction there IF reached.

Bottom line: The Sterling rally is now approaching pivotal Fibonacci resistance into the yearly open- risk for price inflection into this zone in the weeks ahead. Watch the weekly close today with respect to the 52-week moving average (currently ~1.3406) for guidance. From a trading standpoint, a good zone to reduce long-exposure / raise protective stops – the immediate focus is on a breakout of the 1.3326-1.3474 range for guidance with the near-term long-bias vulnerable below the yearly open.
The UK economic docket is rather light over the next few days with the U.S. June CPI & PPI data highlighting event risk next week. Stay nimble into the releases and respect the weekly close. Review my latest British Pound Short-term Outlook for a closer look at the near-term GBP/USD technical trade levels.
GBP/USD Economic Data Releases
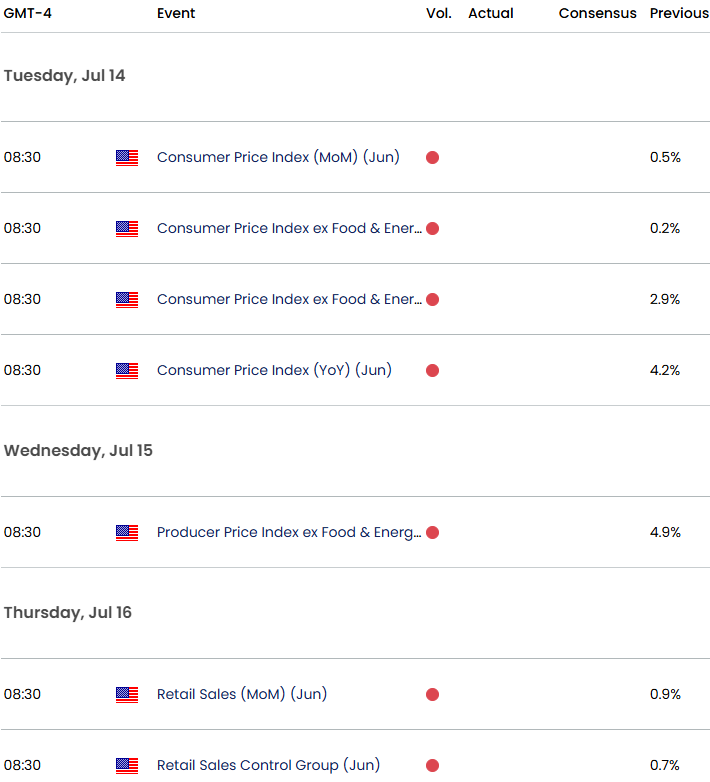
Economic Calendar – latest economic developments and upcoming event risk.
Active Weekly Technical Charts
— Written by Michael Boutros, Senior Technical Strategist
Follow Michael on X @MBForex












Leave a comment