
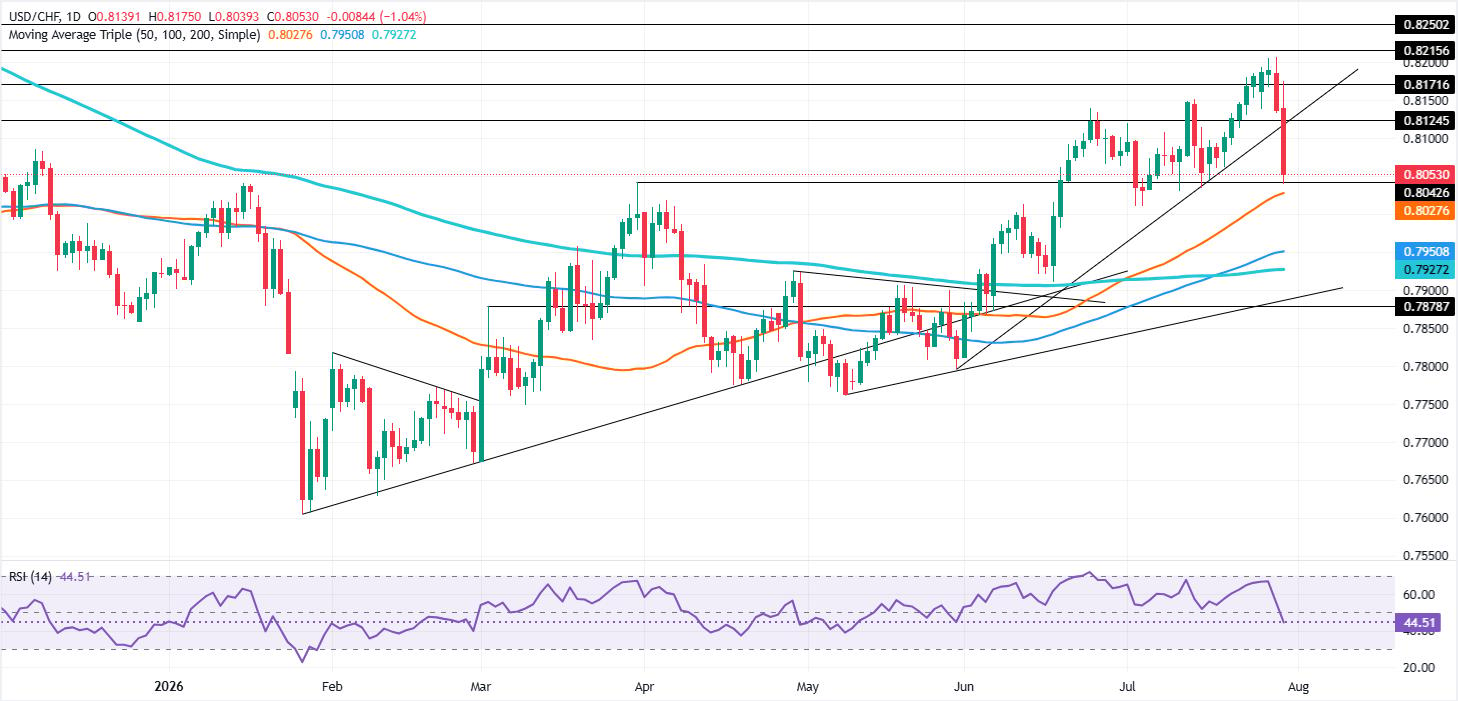
The USD/CHF retreats for the second straight day, down more than 1% amid growing speculation of an intervention in the FX markets, which boosted the Japanese Yen. The pair fell to a 10-day low of 0.8039, slightly above the 50-day Simple Moving Average (SMA) at 0.8027. As of writing, the pair meanders around 0.8250.
USD/CHF Price Forecast: Technical outlook
Despite its retreat, USD/CHF remains upward-biased. The market structure indicates that the uptrend remains intact as long as spot prices are above the 50-day SMA and the July 10 cycle low of 0.8010.
The Relative Strength Index (RSI) turned bearish. Hence, with price action revealing that bulls are still in charge, while the RSI is bearish, caution is warranted.
For a bullish resumption, USD/CHF needs to clear 0.8100. Above this area lies the high of the day (HOD) at 0.8175, ahead of 0.8200. If price registers a decisive break, the yearly high of 0.8207 might be up for grabs.
Downwards, a breach below the 50-day SMA and 0.8010 opens the door to a break of 0.8000. Below, the bullish market structure would be broken, opening the door for further downside. The next support would be the 100-day SMA at 0.7950, followed by the 200-day SMA at 0.7922.
USD/CHF Chart – Daily
Swiss Franc Price This Month
The table below shows the percentage change of Swiss Franc (CHF) against listed major currencies this month. Swiss Franc was the strongest against the US Dollar.
| USD | EUR | GBP | JPY | CAD | AUD | NZD | CHF | |
|---|---|---|---|---|---|---|---|---|
| USD | -0.91% | -1.55% | -1.80% | -1.32% | -1.55% | -3.37% | -0.37% | |
| EUR | 0.91% | -0.61% | -0.92% | -0.45% | -0.62% | -2.53% | 0.55% | |
| GBP | 1.55% | 0.61% | -0.26% | 0.21% | 0.00% | -1.90% | 1.17% | |
| JPY | 1.80% | 0.92% | 0.26% | 0.45% | 0.19% | -1.71% | 1.43% | |
| CAD | 1.32% | 0.45% | -0.21% | -0.45% | -0.26% | -2.13% | 0.98% | |
| AUD | 1.55% | 0.62% | -0.00% | -0.19% | 0.26% | -1.91% | 1.20% | |
| NZD | 3.37% | 2.53% | 1.90% | 1.71% | 2.13% | 1.91% | 3.15% | |
| CHF | 0.37% | -0.55% | -1.17% | -1.43% | -0.98% | -1.20% | -3.15% |
The heat map shows percentage changes of major currencies against each other. The base currency is picked from the left column, while the quote currency is picked from the top row. For example, if you pick the Swiss Franc from the left column and move along the horizontal line to the US Dollar, the percentage change displayed in the box will represent CHF (base)/USD (quote).





Leave a comment