

Solana (SOL) trades below $70 at the time of writing on Wednesday, after falling nearly 4% so far this week. Weakening derivatives positioning and deteriorating technical outlook suggest the selling pressure could accelerate, hinting at a deeper correction.
Derivatives traders turn bearish
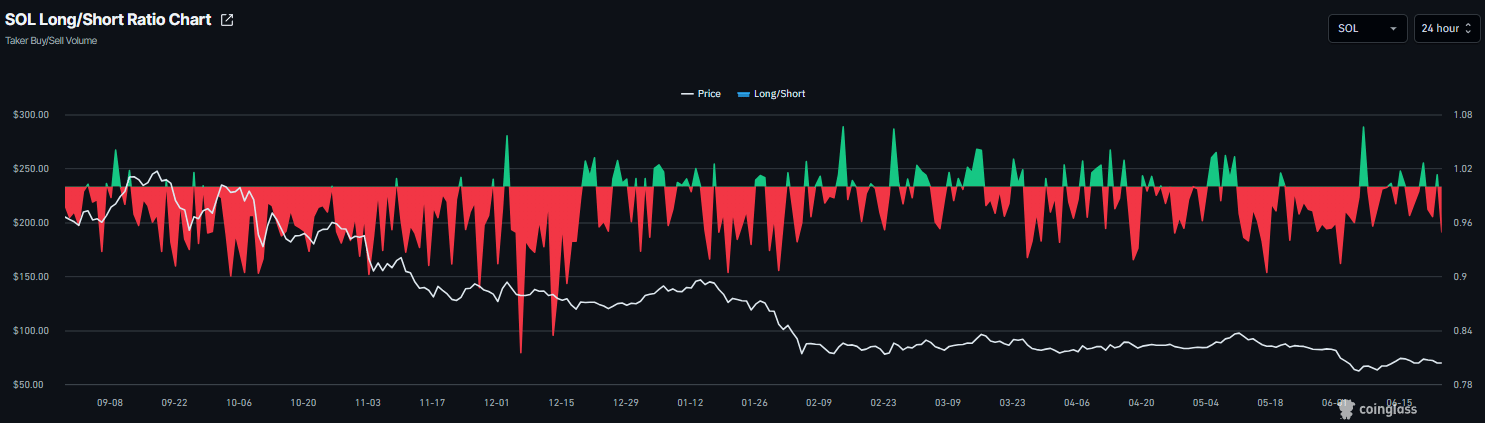
Derivatives metrics support a negative outlook for Solana. CoinGlass’ long-to-short ratio for SOL read 0.94 on Wednesday, nearing the lowest level over a month. The ratio being below one indicates bearish sentiment, as traders are betting that the assets’ prices will fall.
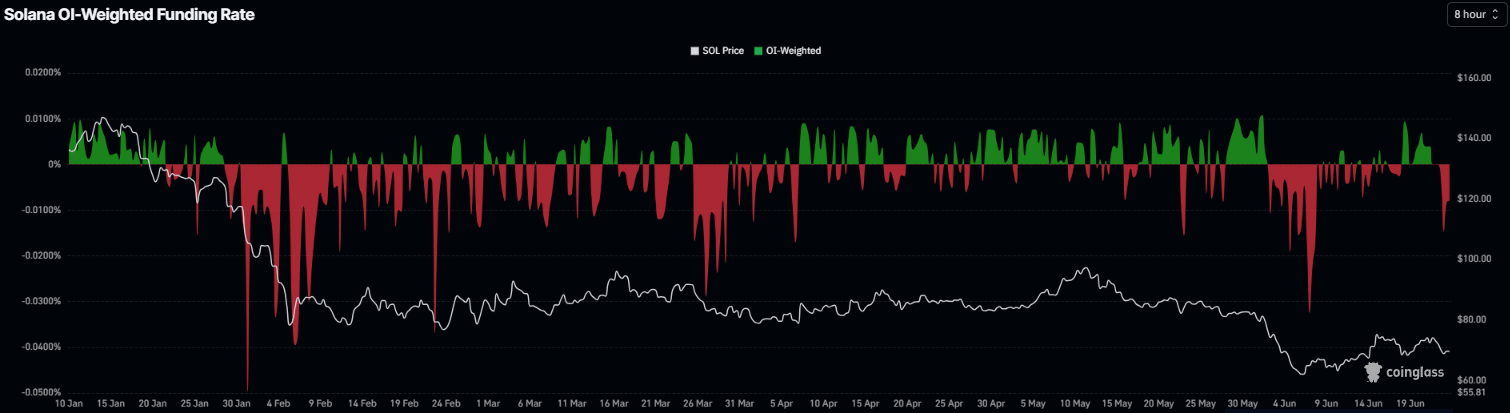
In addition, the funding rates turned negative on Monday, reading -0.0080% on Wednesday, indicating that shorts are paying longs and projecting bearish sentiment.
Some signs of optimism
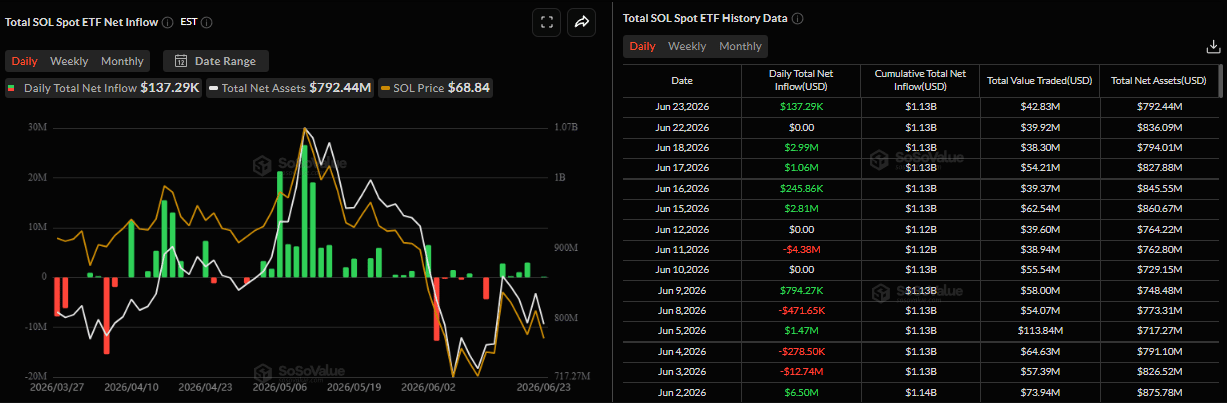
Despite the bearish outlook for the derivatives metrics, SOL still shows some signs of optimism. SoSoValue data shows some signs of optimism. Spot Exchange Traded Funds (ETFs) recorded a mild inflow of $137,290 on Tuesday. If this inflow trend continues and intensifies, SOL could see a recovery ahead.
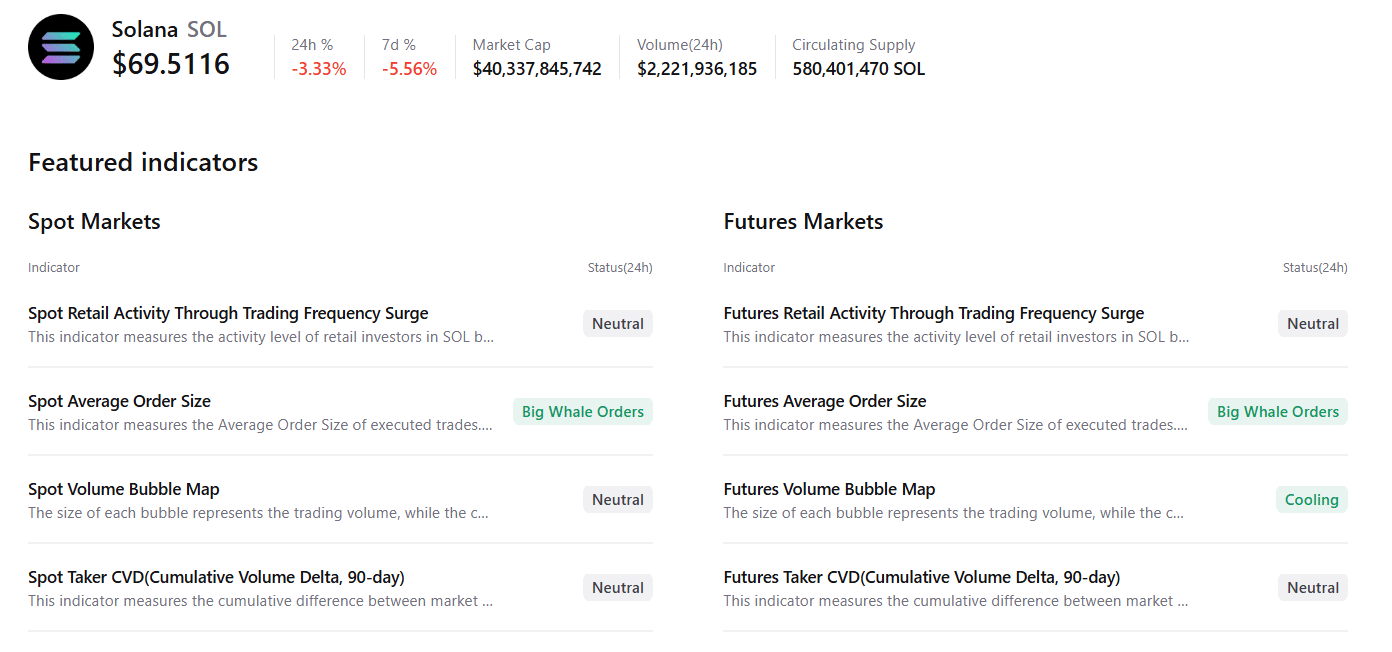
CryptoQuant’s summary data shows a positive outlook. SOL’s spot markets show large whales’ orders with neutral conditions in other metrics, supporting a potential recovery.
Solana Price Forecast: SOL slips below $70
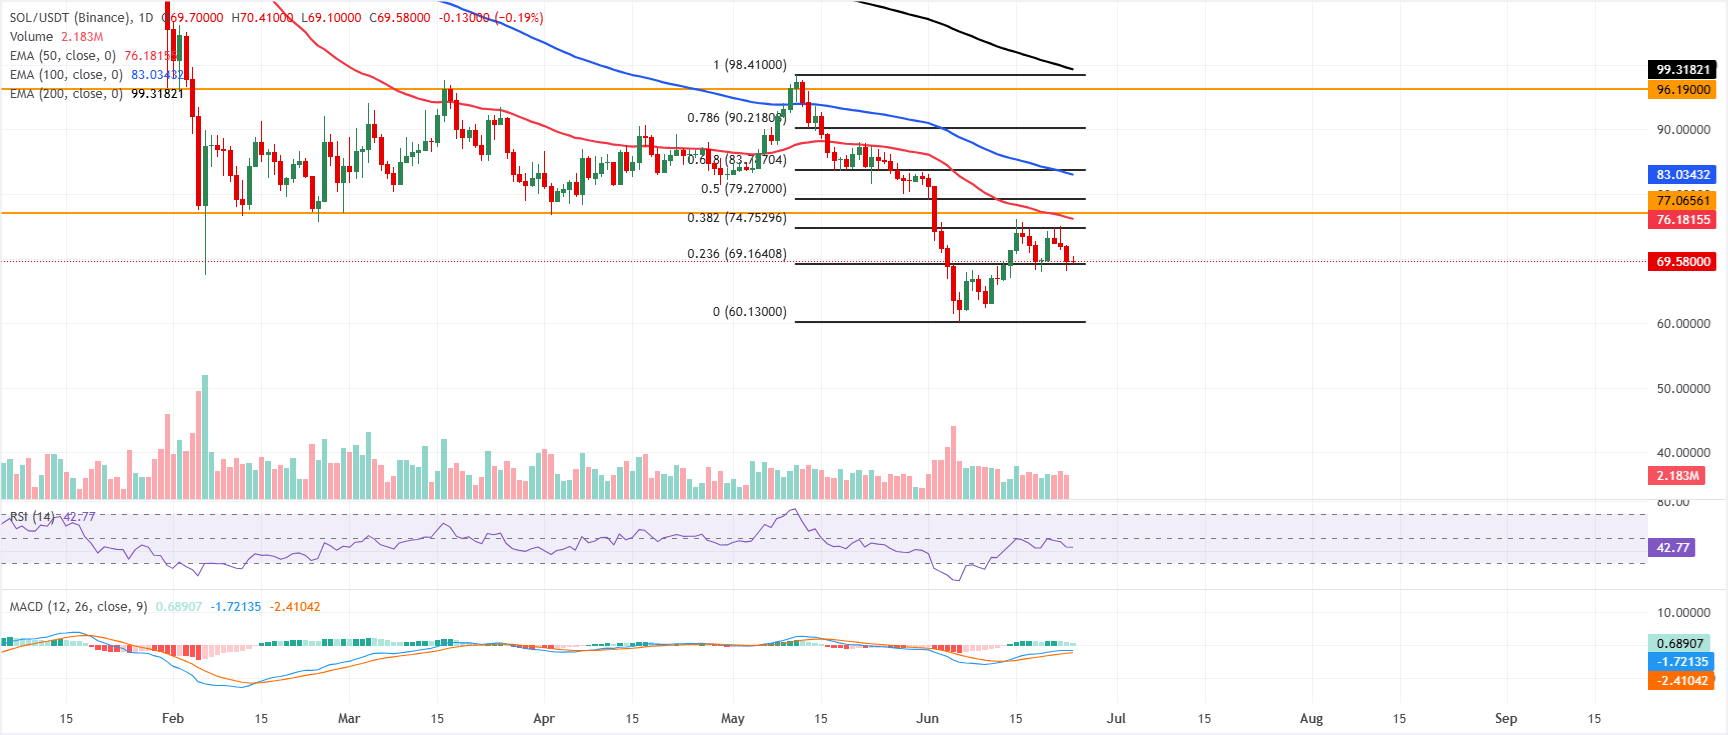
Solana trades at $69.58 on Wednesday, maintaining a bearish near-term bias as it remains decisively below the 50-day, 100-day, and 200-day Exponential Moving Averages (EMAs), which collectively form dynamic overhead resistance.
The Moving Average Convergence Divergence (MACD) indicator is in positive territory but flattening, while the Relative Strength Index (RSI) at around 43 remains below the midline, suggesting bullish momentum is insufficient for now to challenge the prevailing overhead supply.
On the topside, initial resistance aligns near the $74.75 area at the 38.2% Fibonacci retracement, followed by the 50-day EMA around $76.18 and the horizontal cap at $77.07. Above that, the 50% retracement at $79.27 and the 100-day EMA near $83.03 precede a heavier resistance band from the 61.8% Fibonacci retracement at $83.79.
On the downside, immediate support emerges at the 23.6% Fibonacci retracement around $69.16; a clear break lower would expose the next notable Fibonacci floor near $60.13.
(The technical analysis of this story was written with the help of an AI tool.)













Leave a comment